3952
GABA spectroscopic imaging at 9.4T to localize the epileptogenic zone in an animal model of focal epilepsy1Grenoble Institute Neurosciences, INSERM, U1216, University Grenoble Alpes, Grenoble, France, 2CRMBM, Aix-Marseille University, Marseille, France, 3Departement of Psychiatry, Columbia University, New York, NY, United States, 4Université Paris-Saclay, CEA, CNRS, MIRCen, Laboratoire des Maladies Neurodégénératives, Fontenay-aux-Roses, France, 5IRMaGe, INSERM, US17, CNRS, UMS 3552, CHU Grenoble Alpes, University Grenoble Alpes, Grenoble, France
Synopsis
Keywords: Data Acquisition, Spectroscopy, MEGA-LASER, CSI, edition
A surgical resection of the epileptogenic zone (EZ) can be proposed to drug-resistant epileptic patients, mainly suffering from focal epilepsy, in order to free them from their seizures. However, the mean efficiency of surgery is around 50 to 80%, indicating a possible miss-delimitation of the EZ. In recent studies, GABA was found to be a specific biomarker of the EZ in a mouse model of mesio-temporal lobe epilepsy (MTLE). Therefore, in this project, we propose a GABA-edited spectroscopic imaging method to improve the spatial localization of the EZ in this mouse model.
Introduction
For the 30% of drug-resistant epileptic patients who mainly suffer from focal epilepsy, a surgical resection of the epileptogenic zone (EZ) can be proposed with a 50 to 80% efficiency1. A precise identification of the EZ is mandatory for an effective resection. Despite a large panel of noninvasive preoperative explorations, intracranial EEG (IEEG) is often required2, but the low spatial sampling of each electrode and/or misguided implantation may result in the resection of an insufficient brain area. Therefore, the development of non-invasive methods to better identify the EZ remains a challenge.In this project, we hypothesized that MRS-based metabolomics could address this issue in mesio-temporal lobe epilepsy (MTLE). We used the KA-MTLE (kainate) mouse model which is predictive of the human MTLE syndrome with, in particular, a hippocampal sclerosis similar to human ones3. We found by ex vivo HRMAS MRS that GABA was the most discriminant metabolite of the EZ, compared to adjacent structures4. Afterwards, an in vivo single-voxel MEGA-PRESS5 method was developed to edit GABA in mice and enabled to confirm the large increase of GABA in the EZ. However, since single-voxel MRS is not sufficient to spatially delimit the EZ, we developed a Chemical Shift Imaging (CSI) MEGA-LASER pulse sequence to edit the GABA into a wide mouse brain region. In parallel to the pulse sequence development, a pipeline to specifically process GABA-edited CSI data was implemented.
Materials and Methods
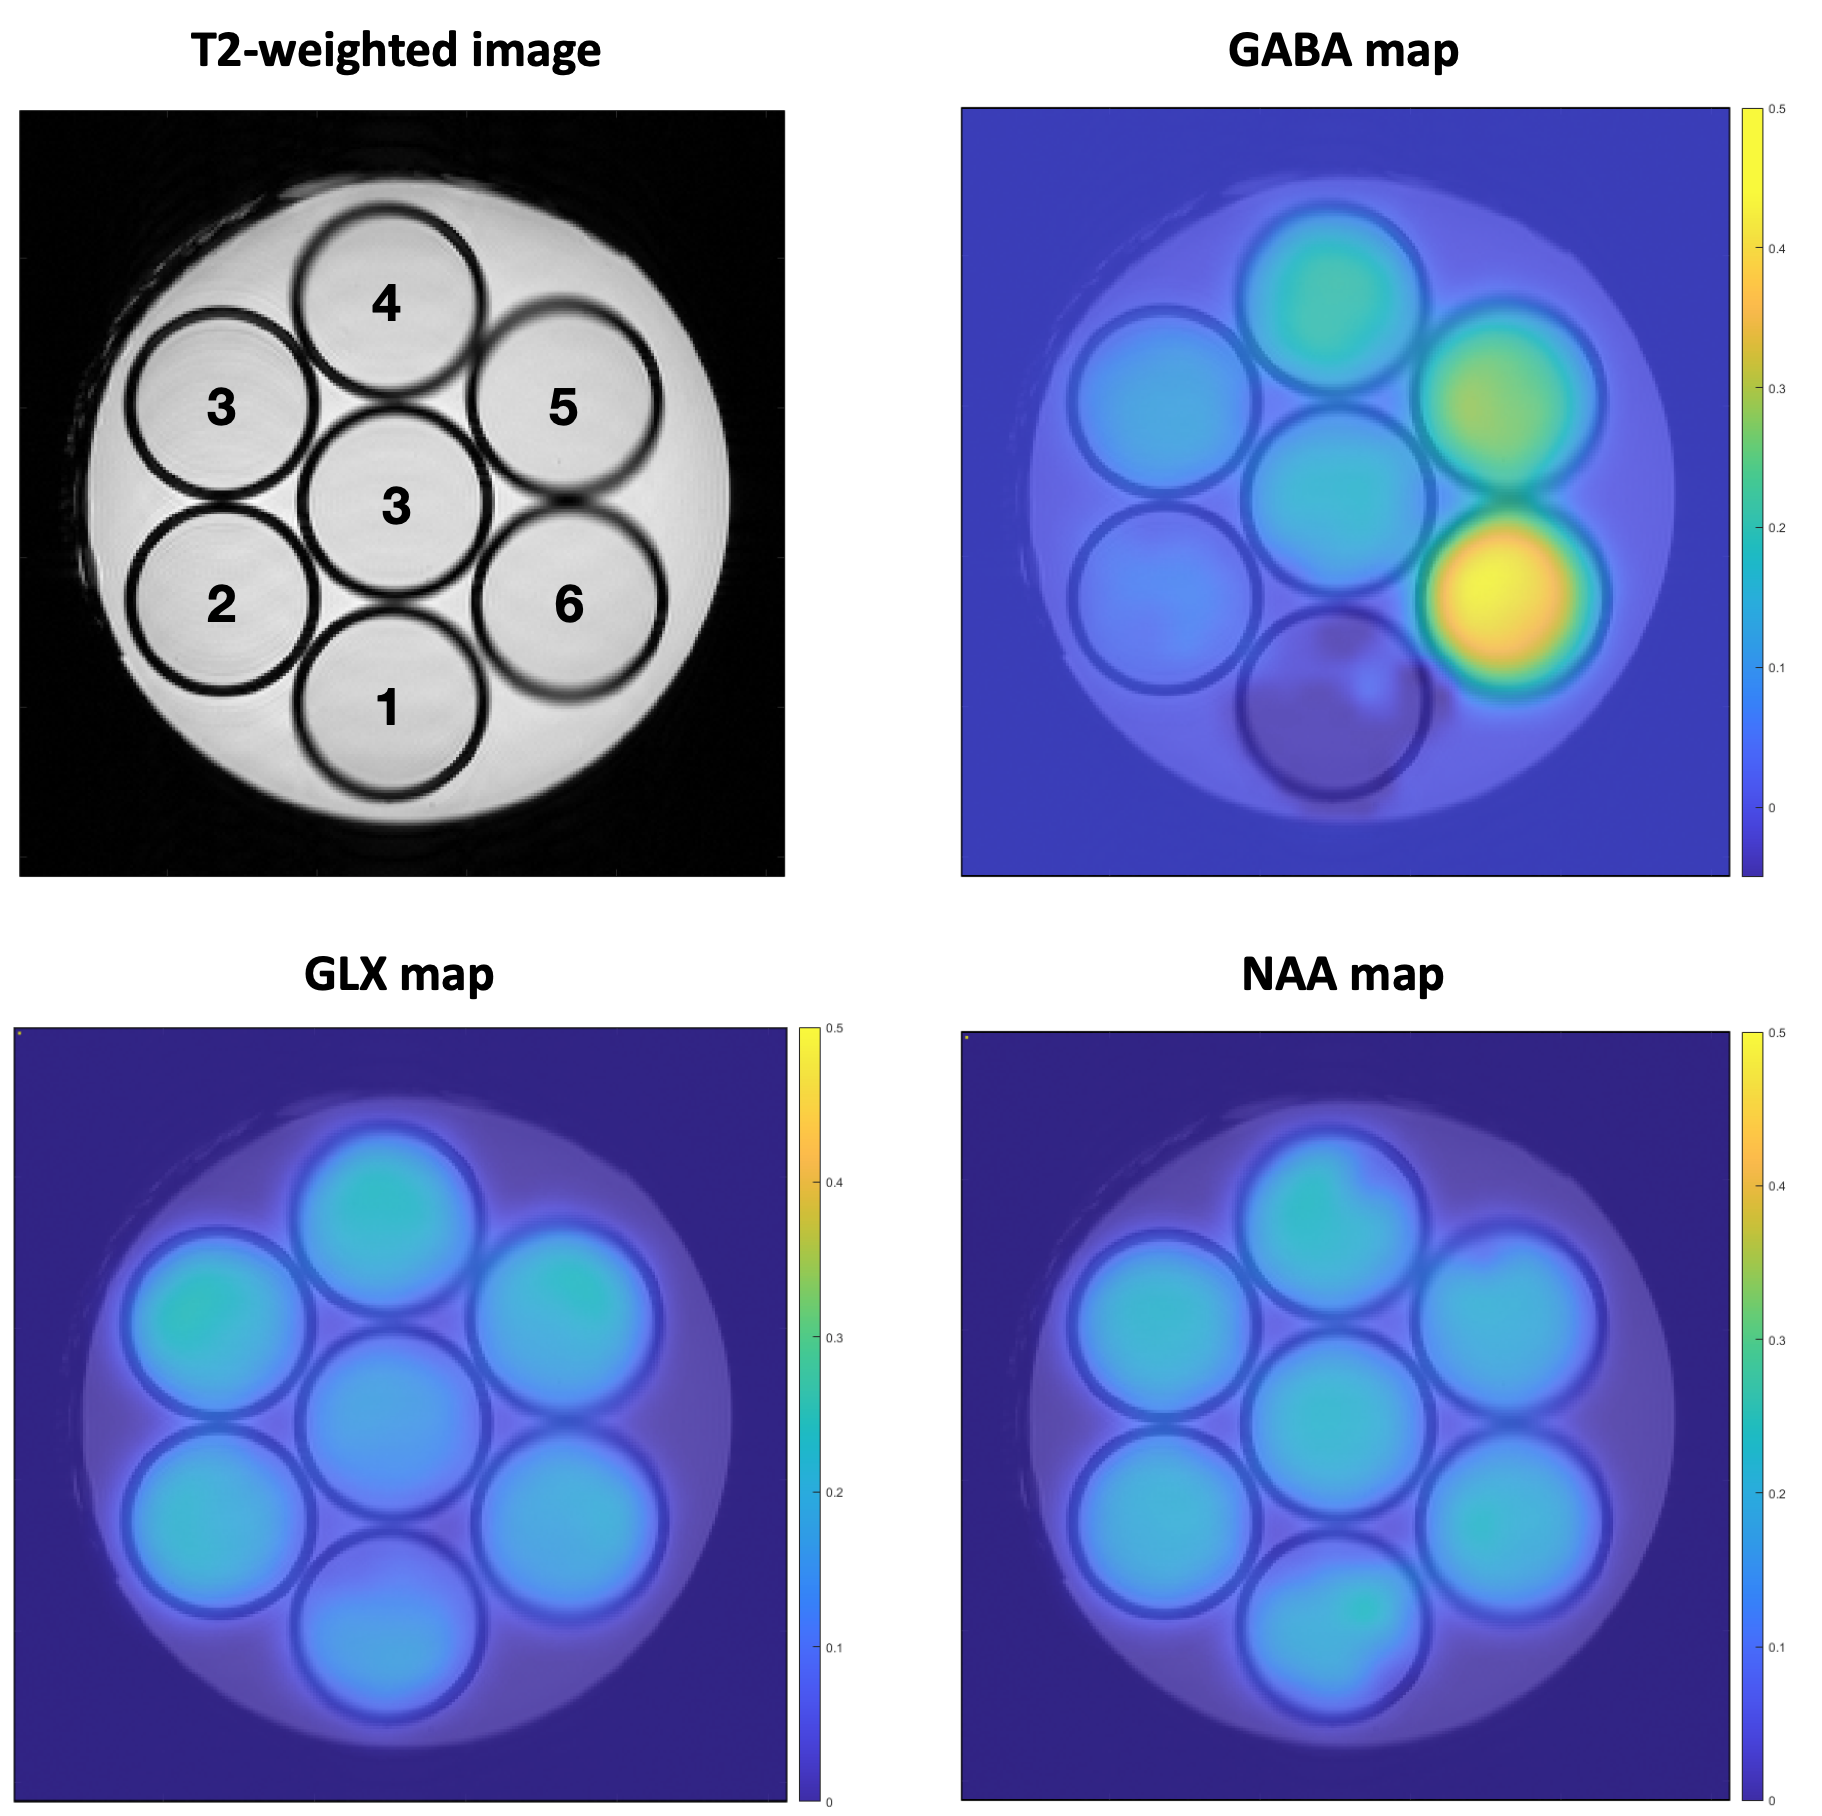
PhantomThe phantom was homemade by diluting 1% Agar gel in PBS pH=7.4, 0.01% Dotarem and metabolites. The gel was poured in 10mm diameter NMR tubes (for high resolution liquid MRS) and the same gel without metabolites was poured around the tubes. 7 NMR tubes were used with NAA, Cr, Glu and Gln 20mM each, and increasing GABA concentrations from 0 to 50mM (steps of 10mM) for the outer tubes, and 20mM for the central tube (Figure 1).
Animals
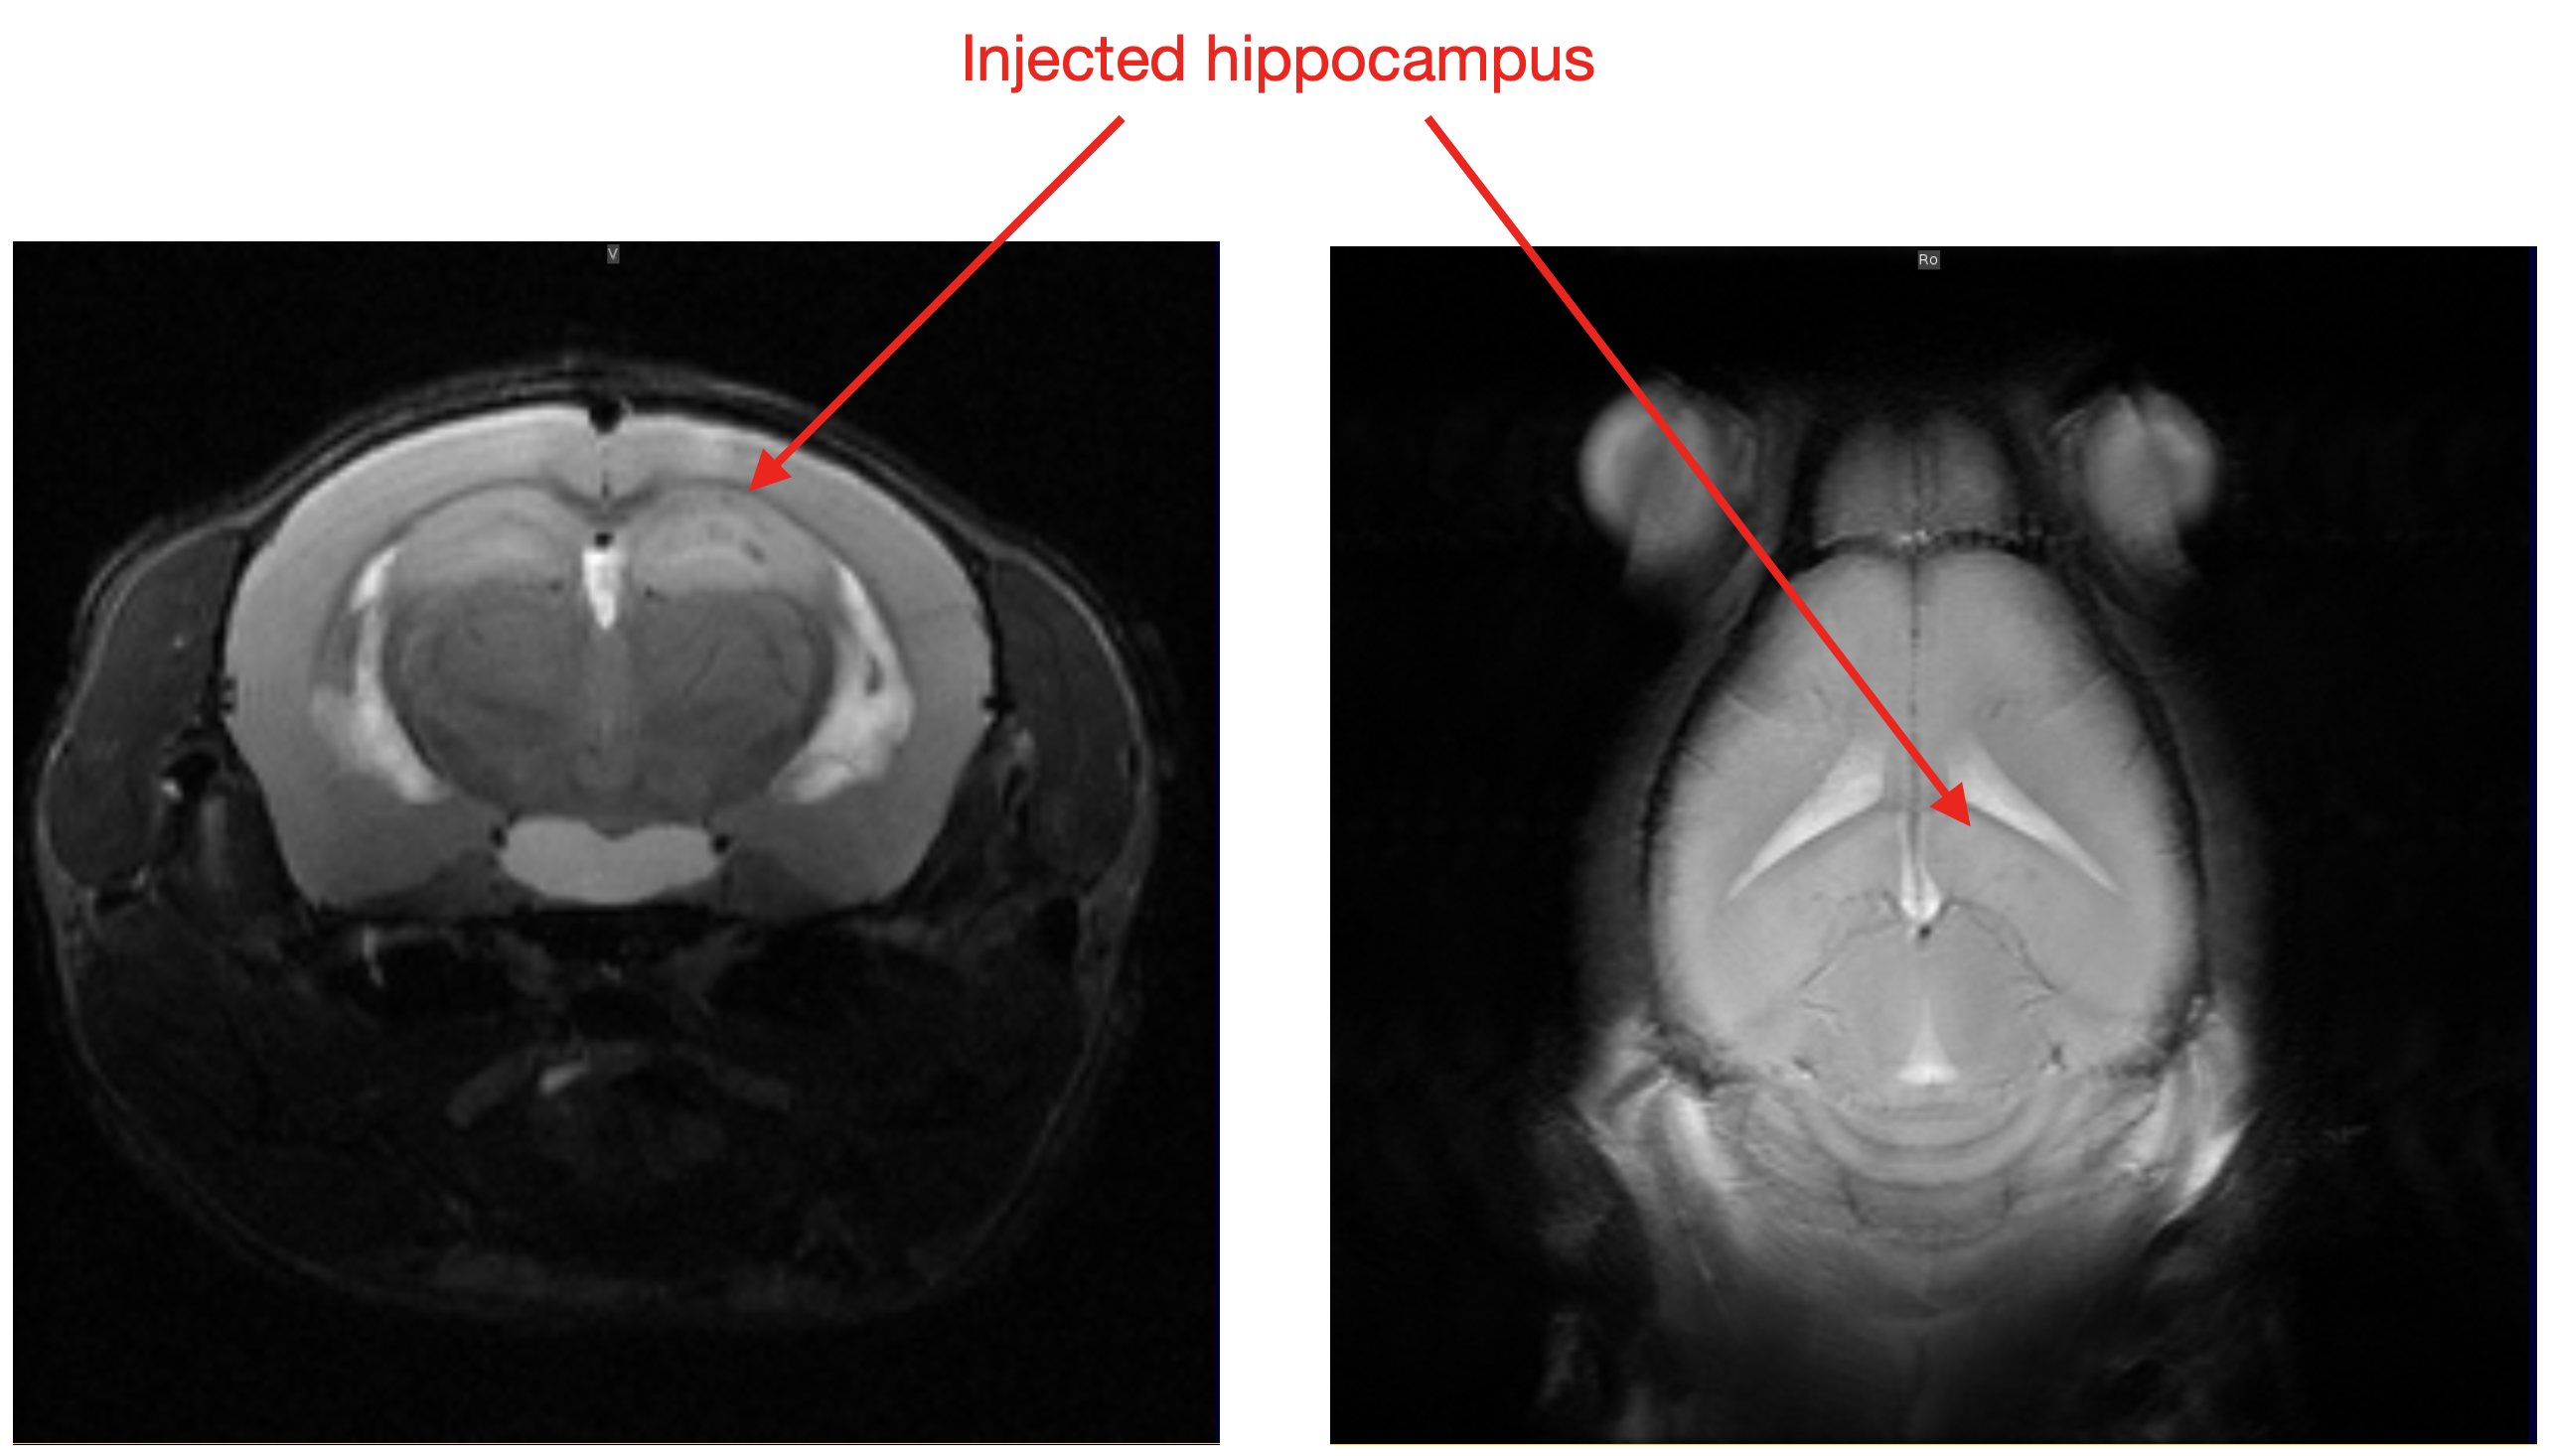
KA-MTLE mice were obtained by injecting 50nL of KA into the right dorsal hippocampus while Sham received NaCl. In this model, after the initial status epilepticus, a silent period of around 4 weeks takes place, after which the mice experience chronic epilepsy and hippocampal sclerosis, visible on T2-weighted images (Figure 2).
MRI experiments
MRI and MRS were performed on a 9.4Tesla scanner (BioSpec 94/20 Avance III HD, Bruker Biospin). A circularly polarized volume coil with 86mm inner diameter was used for RF Transmit and a 4-channels cryoprobe was used for signal detection. The MEGA-LASER CSI pulse sequence was programmed with interleaved ON and OFF acquisitions.
Main parameters for the MEGA-LASER CSI:
-Phantoms: Resolution=1.25x1.25x4mm3, FOV=39x39mm2, Voxel of Interest (VOI)=35x35x4mm3, 39x39 matrix, TE/TR=68/2000 ms, 100 weighted averages, 43h10min acquisition time.
-In vivo: Resolution=1.25x1.25x1.25mm3, FOV=21.25x21.25mm², VOI=5.5x5x1.25mm3, 17x17 matrix, TE/TR=68/2000 ms, 12 weighted averages, 1h10min acquisition time.
T2-weighted images were acquired with the same FOV geometry as the MEGA-LASER CSI one.
Data processing
A specific pipeline was implemented using existing tools which were adapted to GABA edited CSI-MEGA-LASER data.
First, the CSIApy software6 was used to read the raw Bruker data and export them into nifti files, but also to visualize the CSI spectra matrix, the anatomical images and the metabolite maps. The data were exported without zero-filling for the phantom, and with zero-filling for mice (from 17x17 to 51x51).
As for the pre-processing and quantification, we used JET7. This algorithm was originally developed to pre-process (i.e. for frequency alignment, phasing, and subtraction of ON and OFF data) and to quantify single-voxel MEGA-PRESS data, without any manual adjustments. It was adapted to sequentially process CSI data, voxel by voxel. Creatine+Phosphocreatine (CR), N-acetyl aspartate (NAA), GABA+ (GABA + macromolecule), and Glutamate+Glutamine (GLX) were quantified and the ratio GABA+/GLX was calculated.
Results
PhantomThe localization of the MEGA-LASER CSI sequence was first evaluated on a homogeneous phantom.
Afterwards, we evaluated the efficiency of the method to measure different GABA concentrations. We can observe in Figure 1 clear limits of the different compartments without visible chemical shift displacements artefacts.
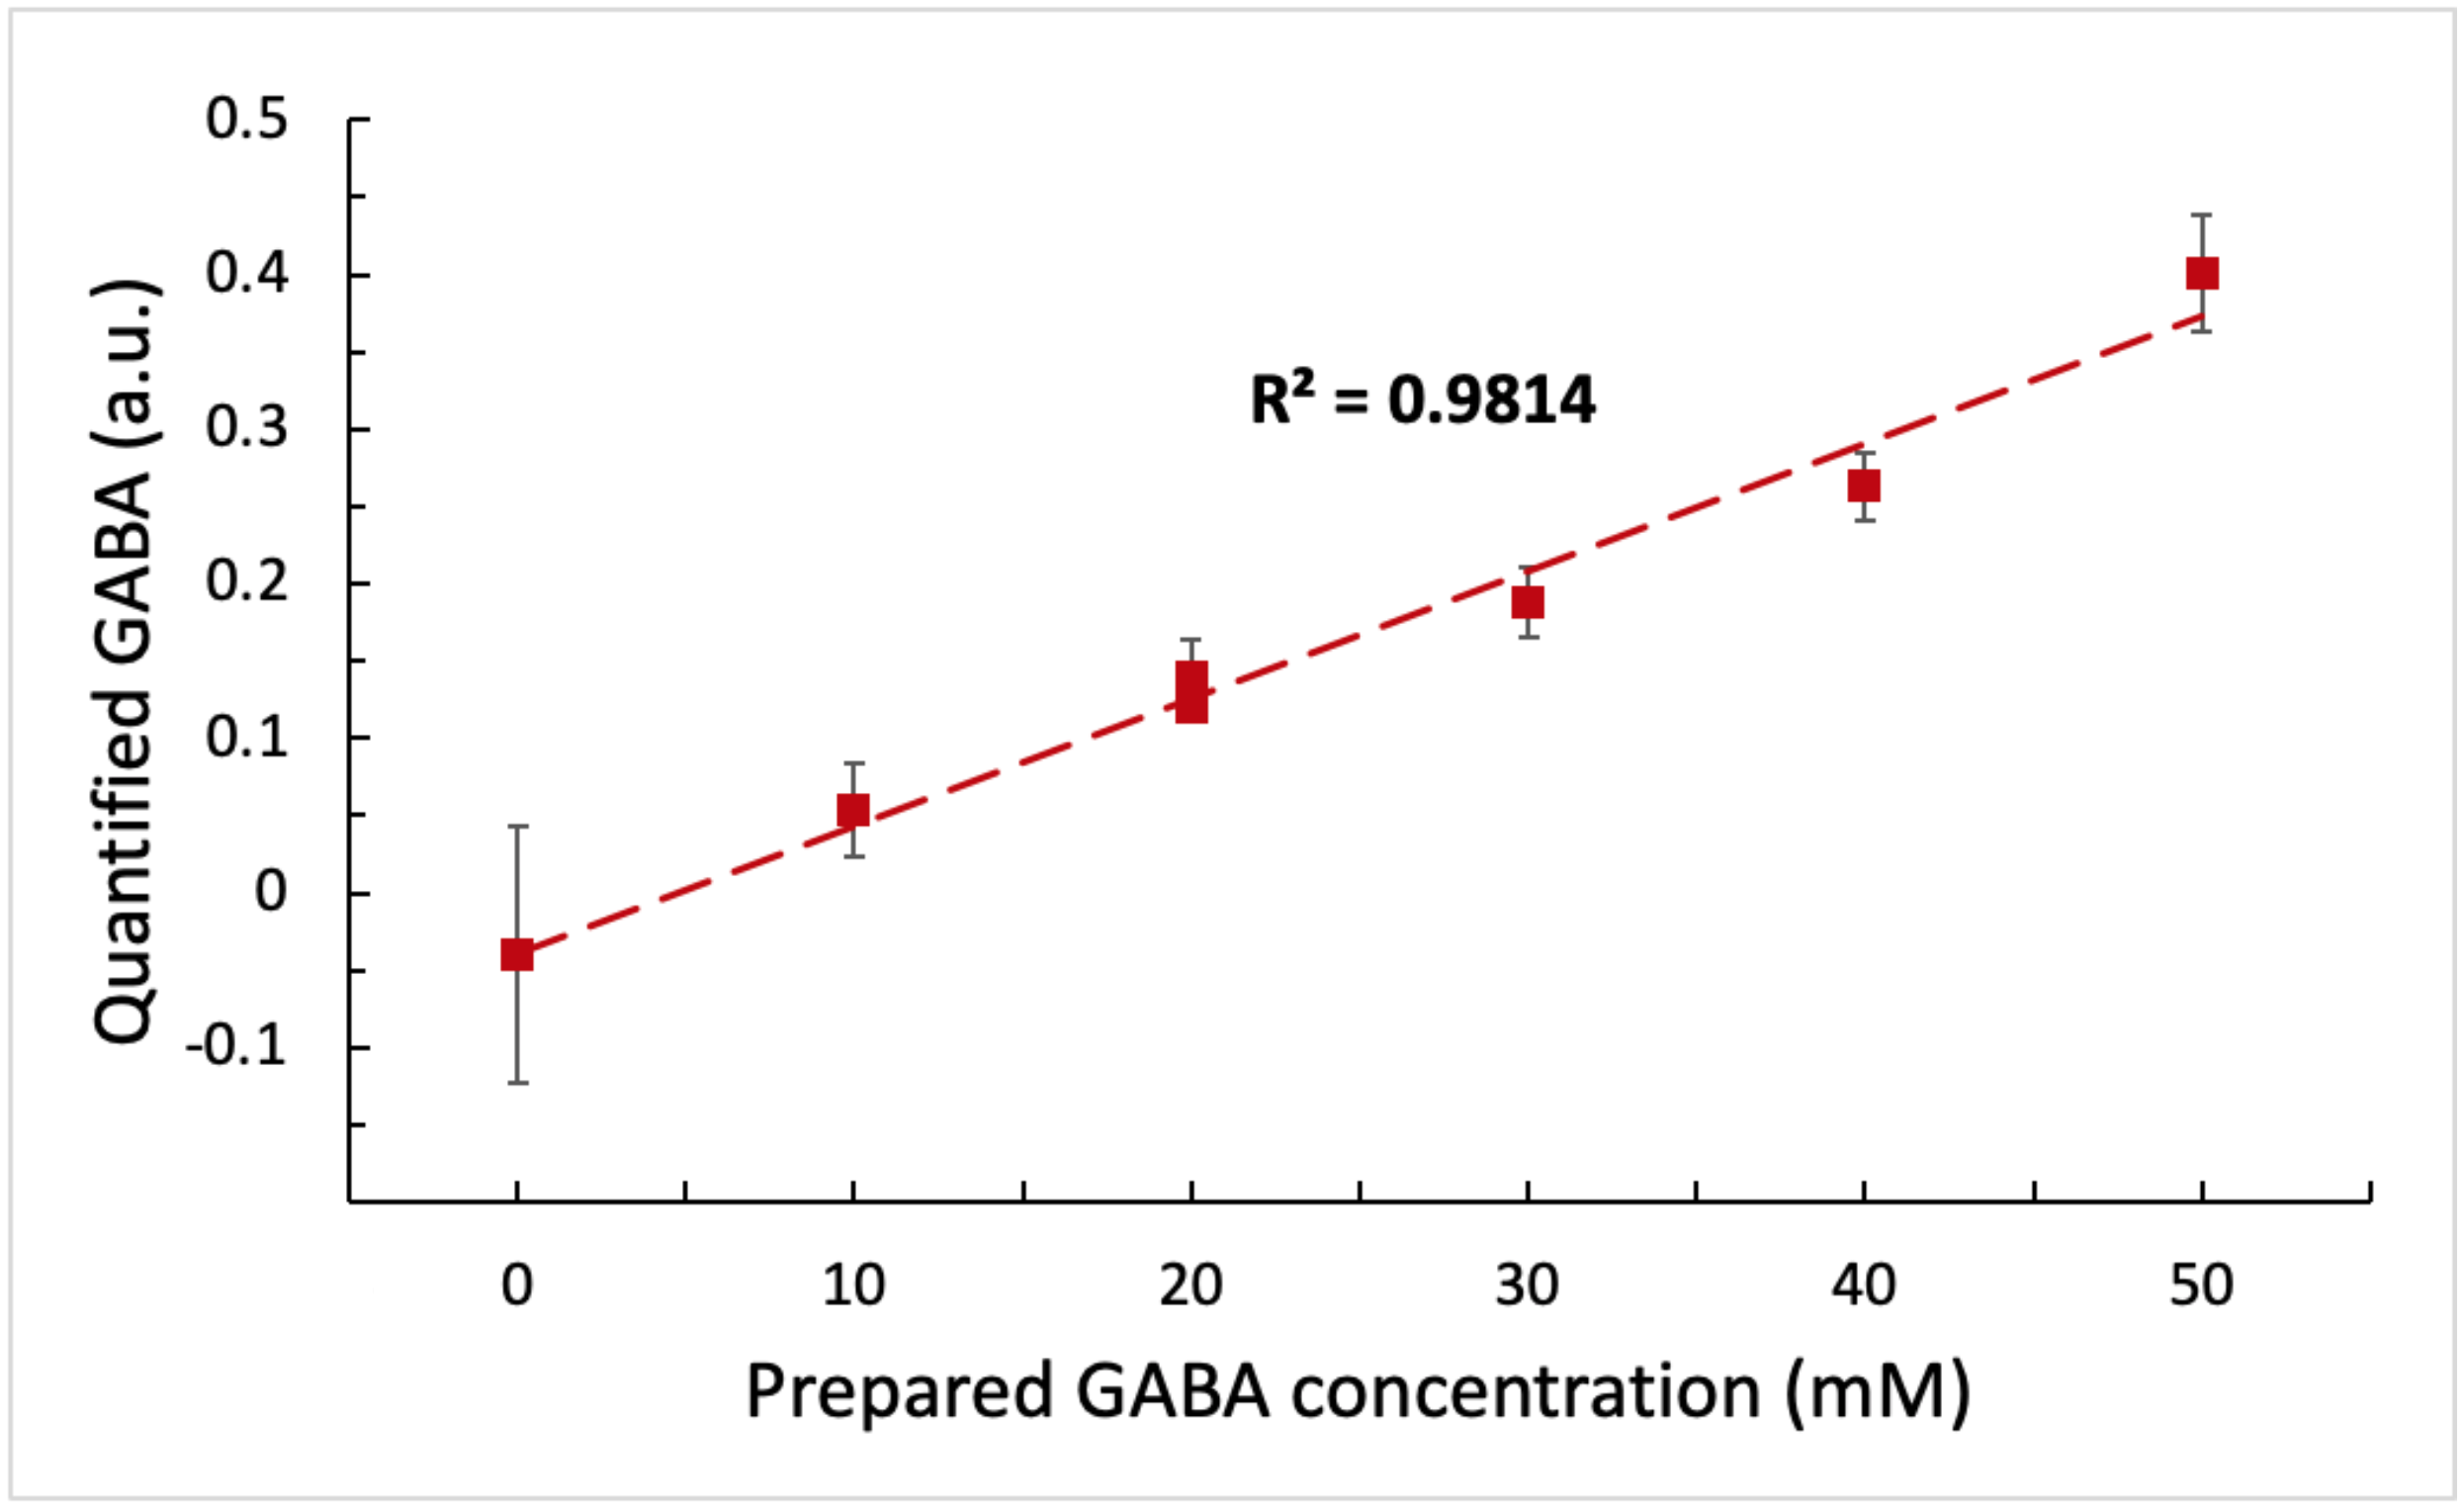
Moreover, we can observe on the metabolite maps that NAA and GLX do not vary between the 7 compartments, in accordance with their concentrations that are identical in the different tubes. On the contrary, the increase of GABA in the compartments is clearly visible. Figure 3 shows the high correlation between the known GABA concentrations and the quantified values in the different compartments. This validates our acquisition and processing protocol for the MEGA-LASER CSI method.
Mice
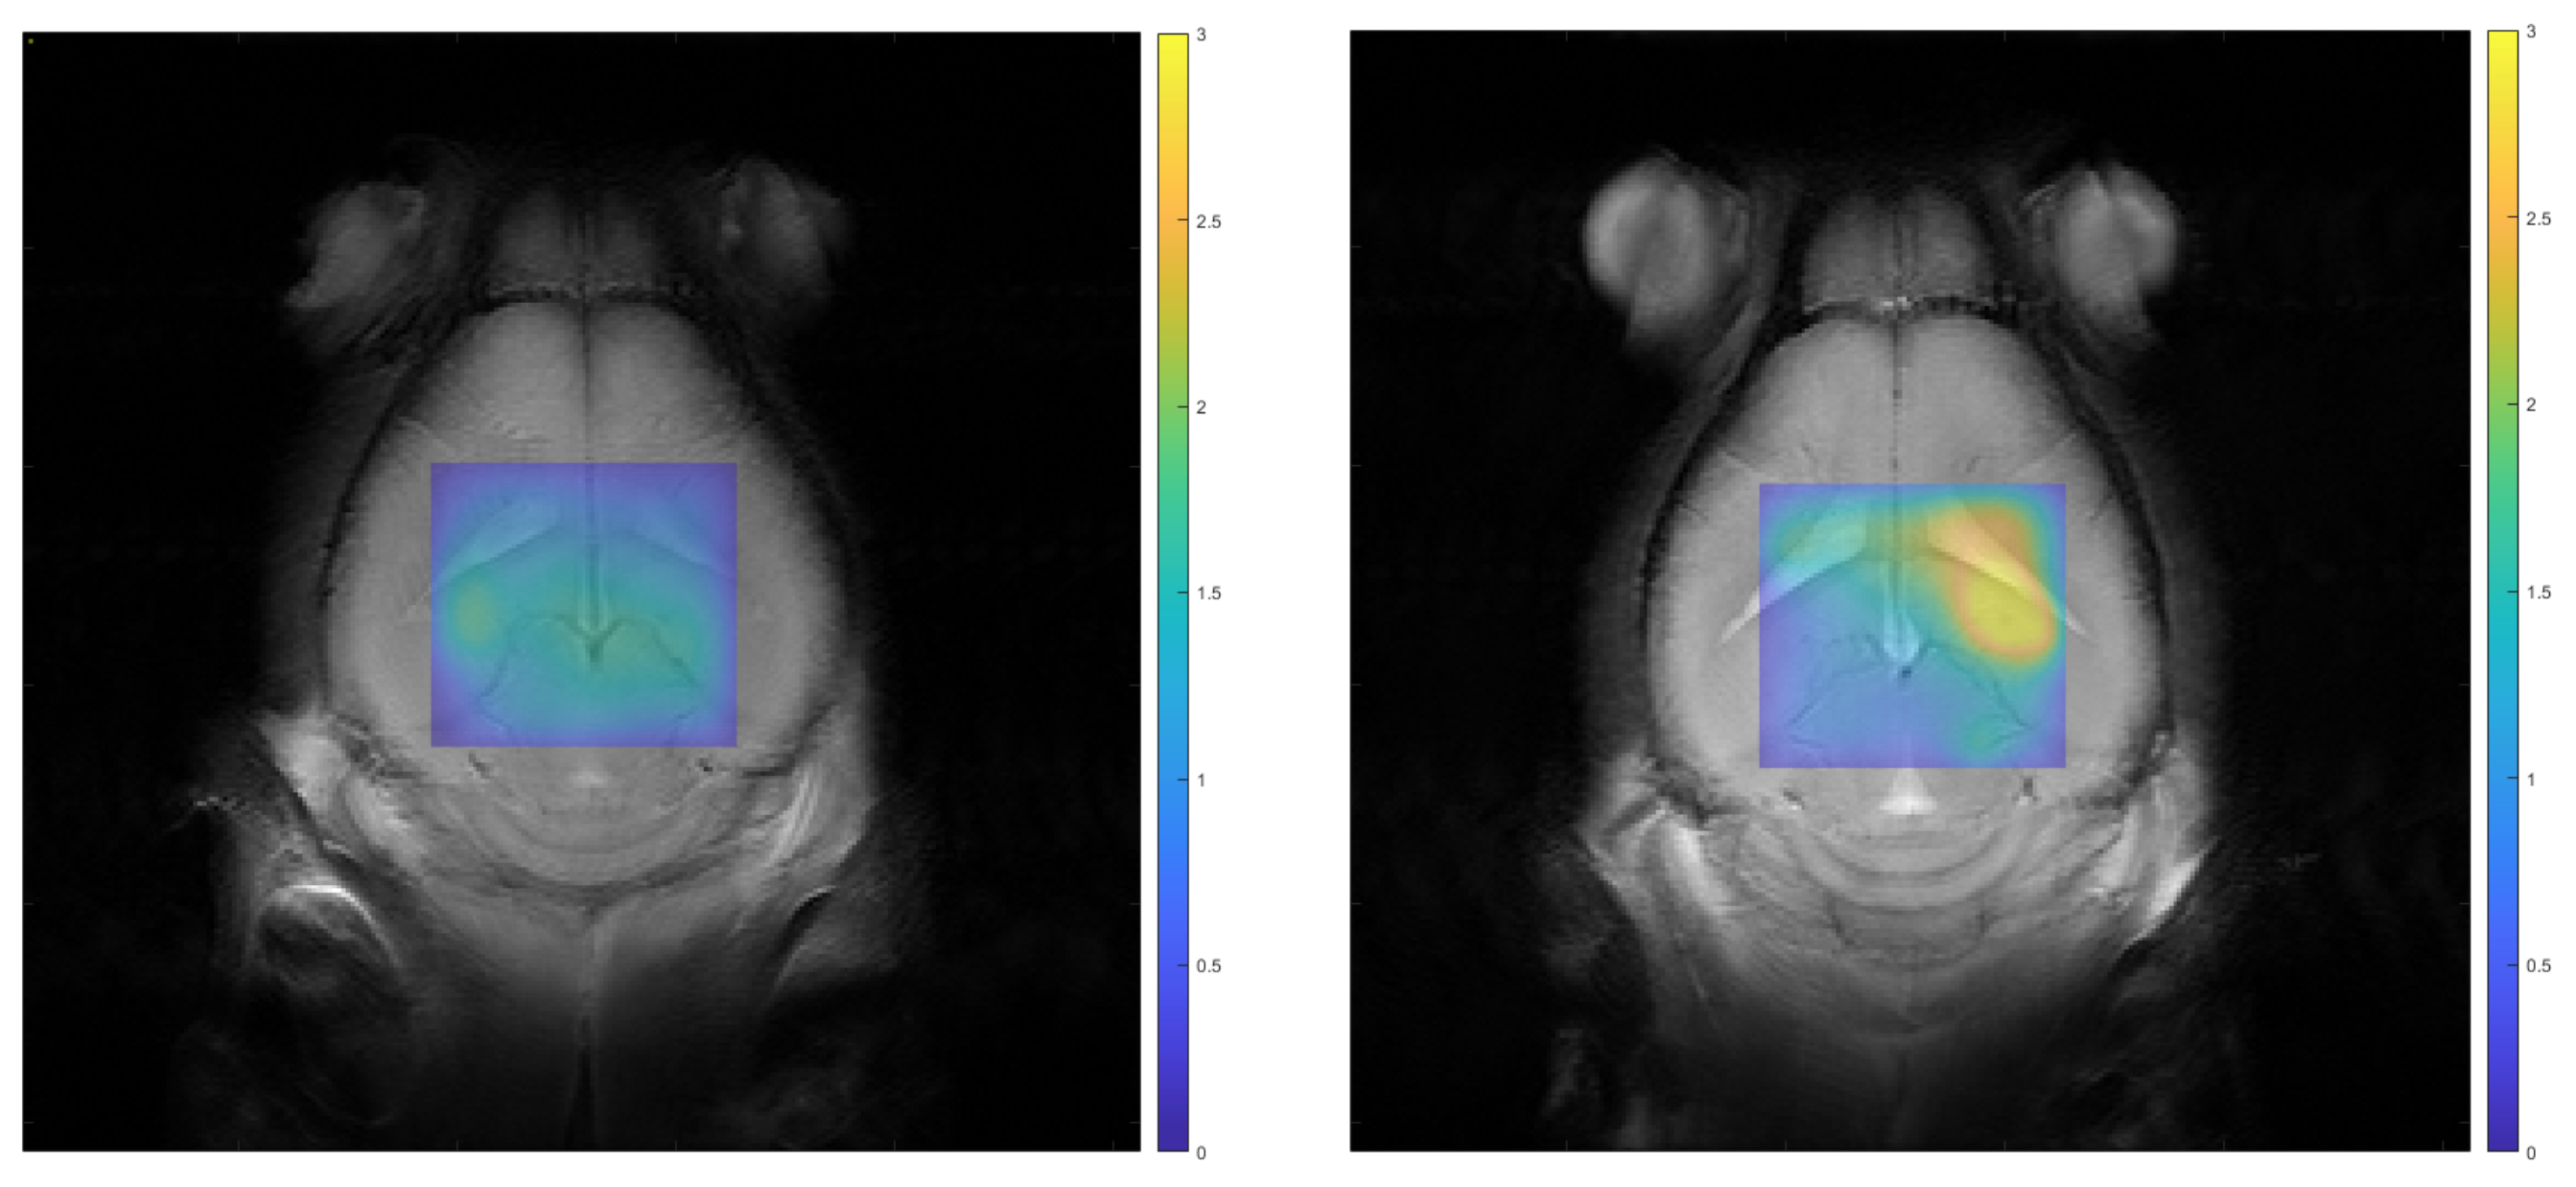
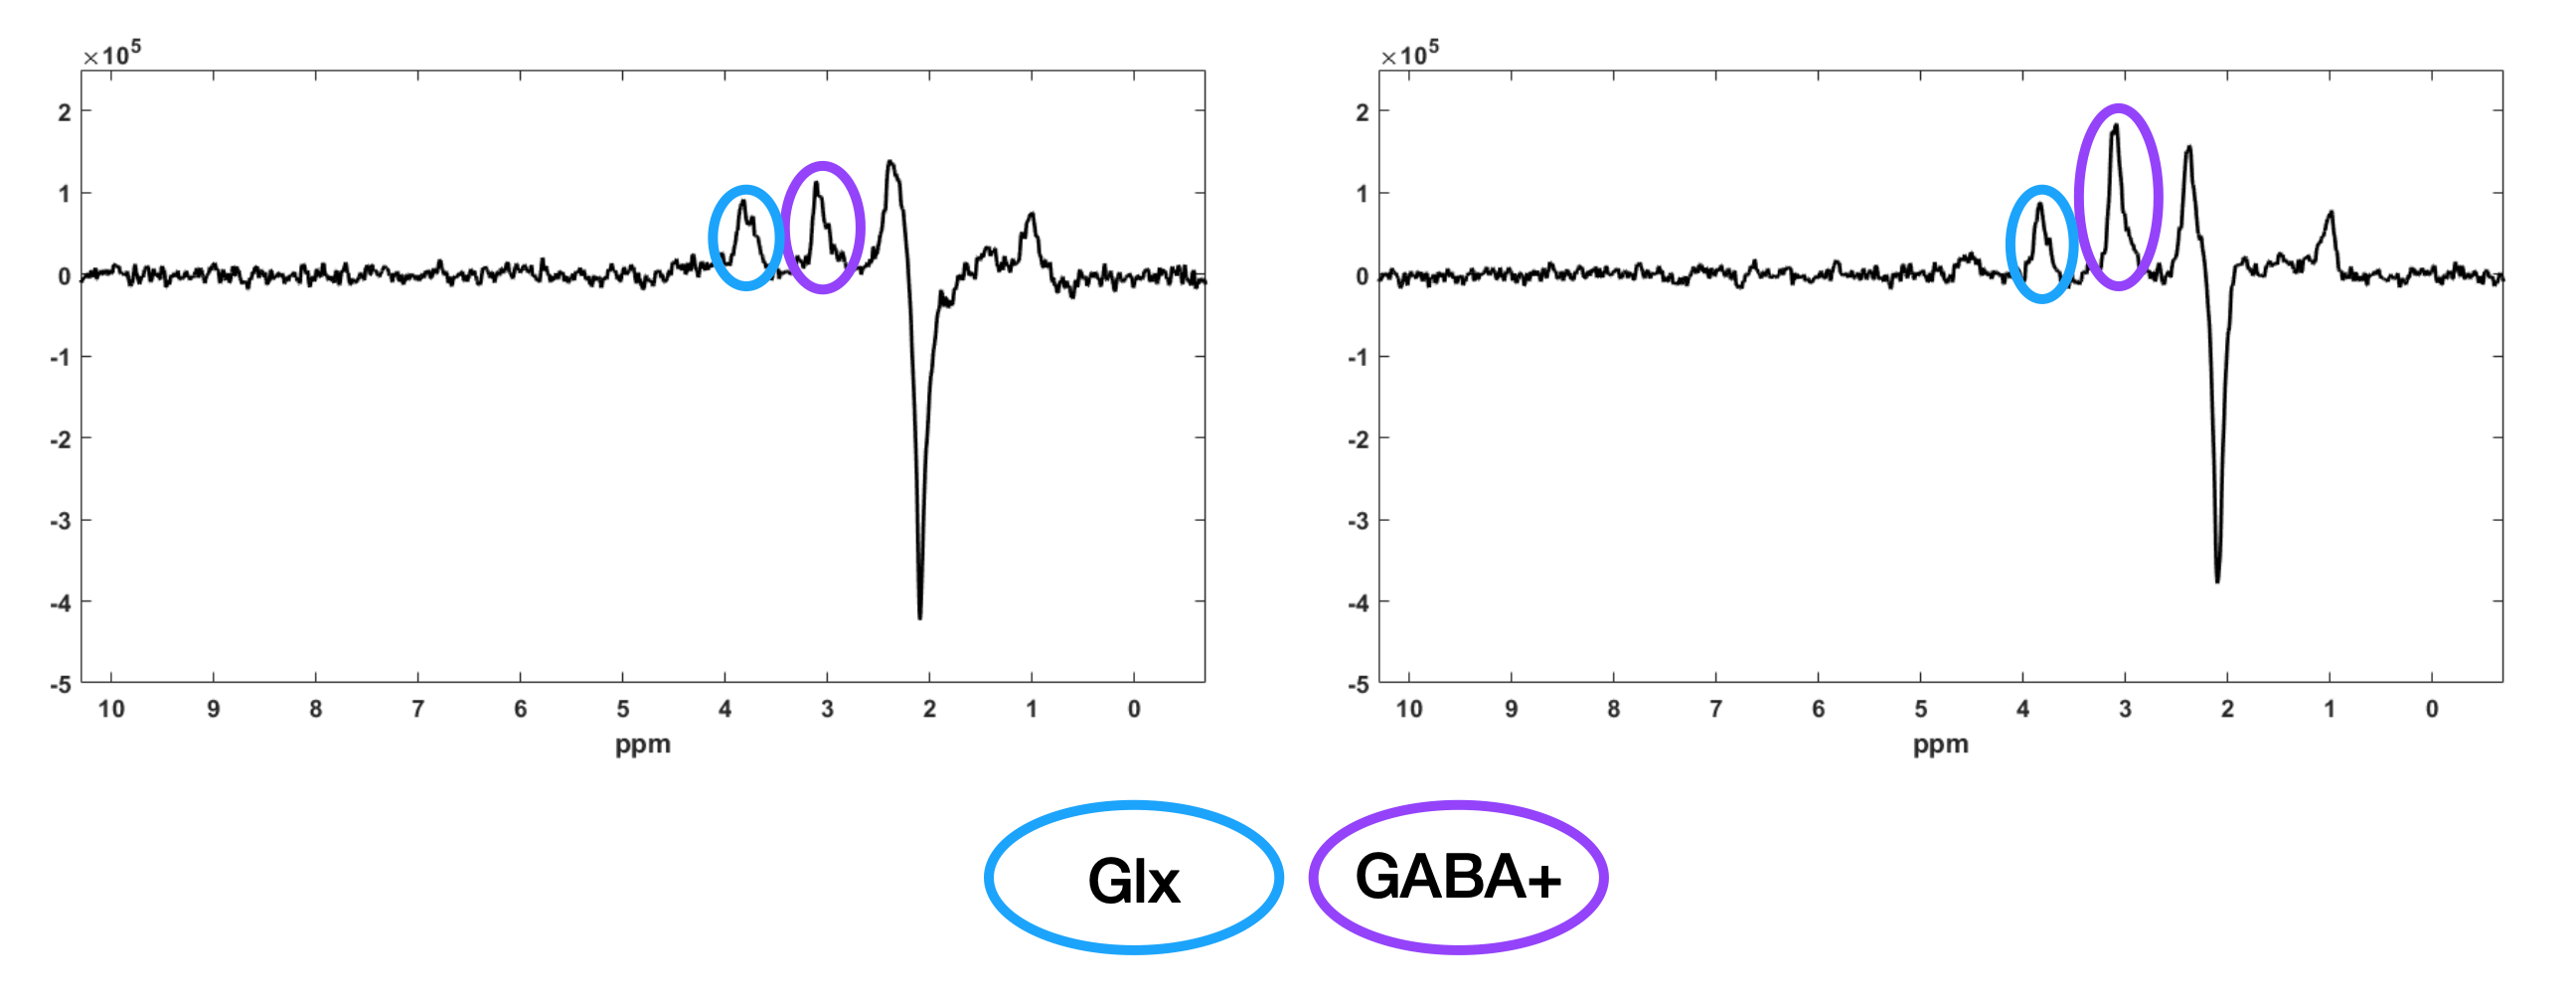
The GABA+/GLX map shows the large GABA+ increase in the right hippocampus of the KA-MTLE mouse, whereas for the Sham mouse, no difference was observed between both hippocampi (Figure 4). Two representative spectra from the ipsilateral and contralateral regions of KA-MTLE mouse are shown in Figure 5.
Conclusion/Discussion
With the phantom data, we demonstrated that the CSI MEGA-LASER sequence enables to edit GABA and thus to distinguish compartments with different concentrations of this metabolite.Moreover, the GABA increase and GLX decrease in the injected hippocampus of KA-MTLE, first detected using ex vivo MRS and in vivo single-voxel MRS, can be clearly highlighted using this MRS imaging method. Therefore, MEGA-LASER CSI could enable to spatially localize the EZ in this mouse model.
Acknowledgements
This study was supported by INSERM funding and a grant from the French Foundation for Research on Epilepsy (FFRE).References
1. Picot MC, Baldy-Moulinier M, Daures JP, et al. The prevalence of epilepsy and pharmacoresistant epilepsy in adults: a population-based study in a Western European country. Epilepsia. 2008 Jul;49(7):1230- 8.
2. Jayakar P, Gotman J, Harvey AS, et al. Diagnostic utility of invasive EEG for epilepsy surgery: Indications, modalities, and techniques. Epilepsia. 2016 Nov;57(11):1735-47.
3. Riban V, Bouilleret V, Pham-Le BT, et al. Evolution of hippocampal epileptic activity during the development of hippocampal sclerosis in a mouse model of temporal lobe epilepsy. Neuroscience. 2002;112(1):101-11.
4. Hamelin S, Stupar V, Maziere L, et al. In vivo gamma-aminobutyric acid increase as a biomarker of the epileptogenic zone: An unbiased metabolomics approach. Epilepsia. 2021;62:163-175.
5. Mescher M, Merkle H, Kirsch J, et al. Simultaneous in vivo spectral editing and water suppression. NMR Biomed. 1998 Oct;11(6):266-72.
6. Le Fur, Y., Nicoli, F., Guye, M. et al. Grid-free interactive and automated data processing for MR chemical shift imaging data. Magn Reson Mater Phy 23, 23–30 (2010).
7. Guo J, Gang Z, Sun Y, et al. In vivo detection and automatic analysis of GABA in the mouse brain with MEGA-PRESS at 9.4 T. NMR Biomed. 2018 ;31(1).
Figures