3951
Two Dimensional MRSI of Human Calf Muscle at 3T: Decoupling and NOE effects on PDE and total NAD1Human Magnetic Resonance Center, Institute for Applied Life Sciences, University of Massachusetts, Amherst MA, Amherst, MA, United States, 2Kinesiology, University of Massachusetts, Amherst MA, Amherst, MA, United States
Synopsis
Keywords: Data Acquisition, Spectroscopy
Using two-dimensional 31-phosphorus spectroscopic imaging (2D-MRSI) in human skeletal muscle, we have demonstrated that proton decoupling and nuclear Overhauser effect sequences improve the coefficient of variation and enhance the resolution of key metabolites in vivo.
Introduction
Phosphorus MR spectroscopy (31P-MRS) offers a unique window to detect metabolites that play crucial roles in tissue energy metabolism (1-3). Metabolic mapping strategies to examine specific muscle groups are very attractive in providing spatial information on the concentration of phosphodiester (PDE) and nicotinamide adenine dinucleotide (NAD+NADH = t-NAD). However, the detection of PDE and t-NAD, which depends on cellular membrane content and redox balance, is challenging at field strengths of 3T or below (4,5). In addition, MRSI can suffer from lower SNR due to small sample volumes. J-coupling between protons and phosphorus nuclei in proton-decoupling using the WALTZ-4 decoupling scheme improves spectral resolution in 31P MRS. Of note, proton decoupling will collapse multiplet structures visible in phosphorus spectra due to J-coupling between phosphorus nuclei and neighboring proton nuclei. In addition to improvements in spectral resolution from 1H decoupling, the sensitivity in the decoupled 31P spectra may be increased during proton irradiation via the nuclear Overhauser effect (NOE) (6). NOE enhancement occurs when using proton decoupling because of partial saturation of the proton resonances. The goals of the present study were to perform localized 2D-MRSI with decoupling and NOE using a birdcage coil to (1) detect and quantify the muscle-specific concentration of PDE and t-NAD resonances and (2) calculate the coefficient of variation of PDE and t-NAD in human soleus (SO), gastrocnemius (GN), and tibialis anterior (TA) muscles at 3T.Materials and Methods
Five healthy volunteers (25.6 ± 2.7 yrs) participated in this study. 2D-MRSI was performed using a Siemens Skyra scanner running on a VE11C platform. Data were acquired with a birdcage quadrature transmit-receive proton and phosphorous dual-tuned knee coil (length: 35cm, diameter: 15cm) positioned around the leg. A 2D MRSI pulse was acquired with the following parameters: TR/ TE: 2000ms / 2.3 ms; FOV: 200x 200 mm; matrix: 8x8; vector size: 2048; thickness: 80 mm; averages: 32; FA: 90; bandwidth: 4000Hz; encoding: weighted; decoupling pulse: Waltz-4 with decoupling total duration of 40%. NOE was performed with a rectangular pulse; NOE duration 5ms and 900 flip angle. Axial T1-weighted proton images were used for MRSI voxel placement. All measurements were achieved within SAR limits. Magnetic field homogeneity was optimized on water using the 1H coil and confirmed on the PCr peak of the 31P signal to yield full width at half maximum (FWHM) of ~14 Hz. The carrier frequency was placed between the PCr and Pi peaks. All the metabolites in the selected soleus, gastrocnemius, and tibialis anterior were processed using jMRUI and quantified using the AMARES non-linear least squares algorithm. ATP (8.2 mM) was used as an internal reference for determining metabolite concentrations. Inter-subject coefficients of variation (CV, %) were calculated. Paired t-tests were used to detect differences in PDE and t-NAD with vs. without NOE + decoupling.Results
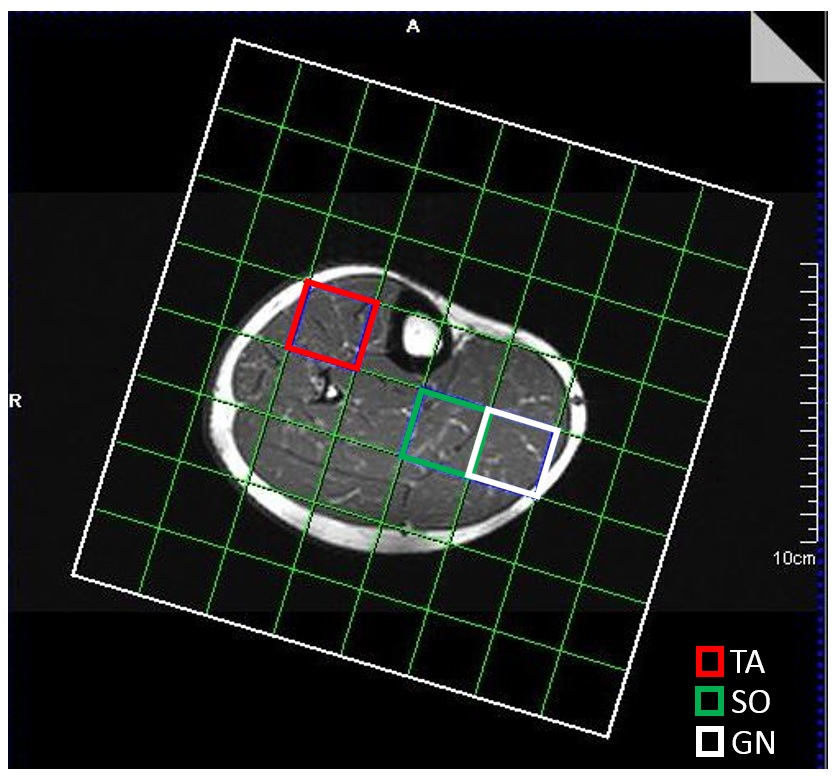
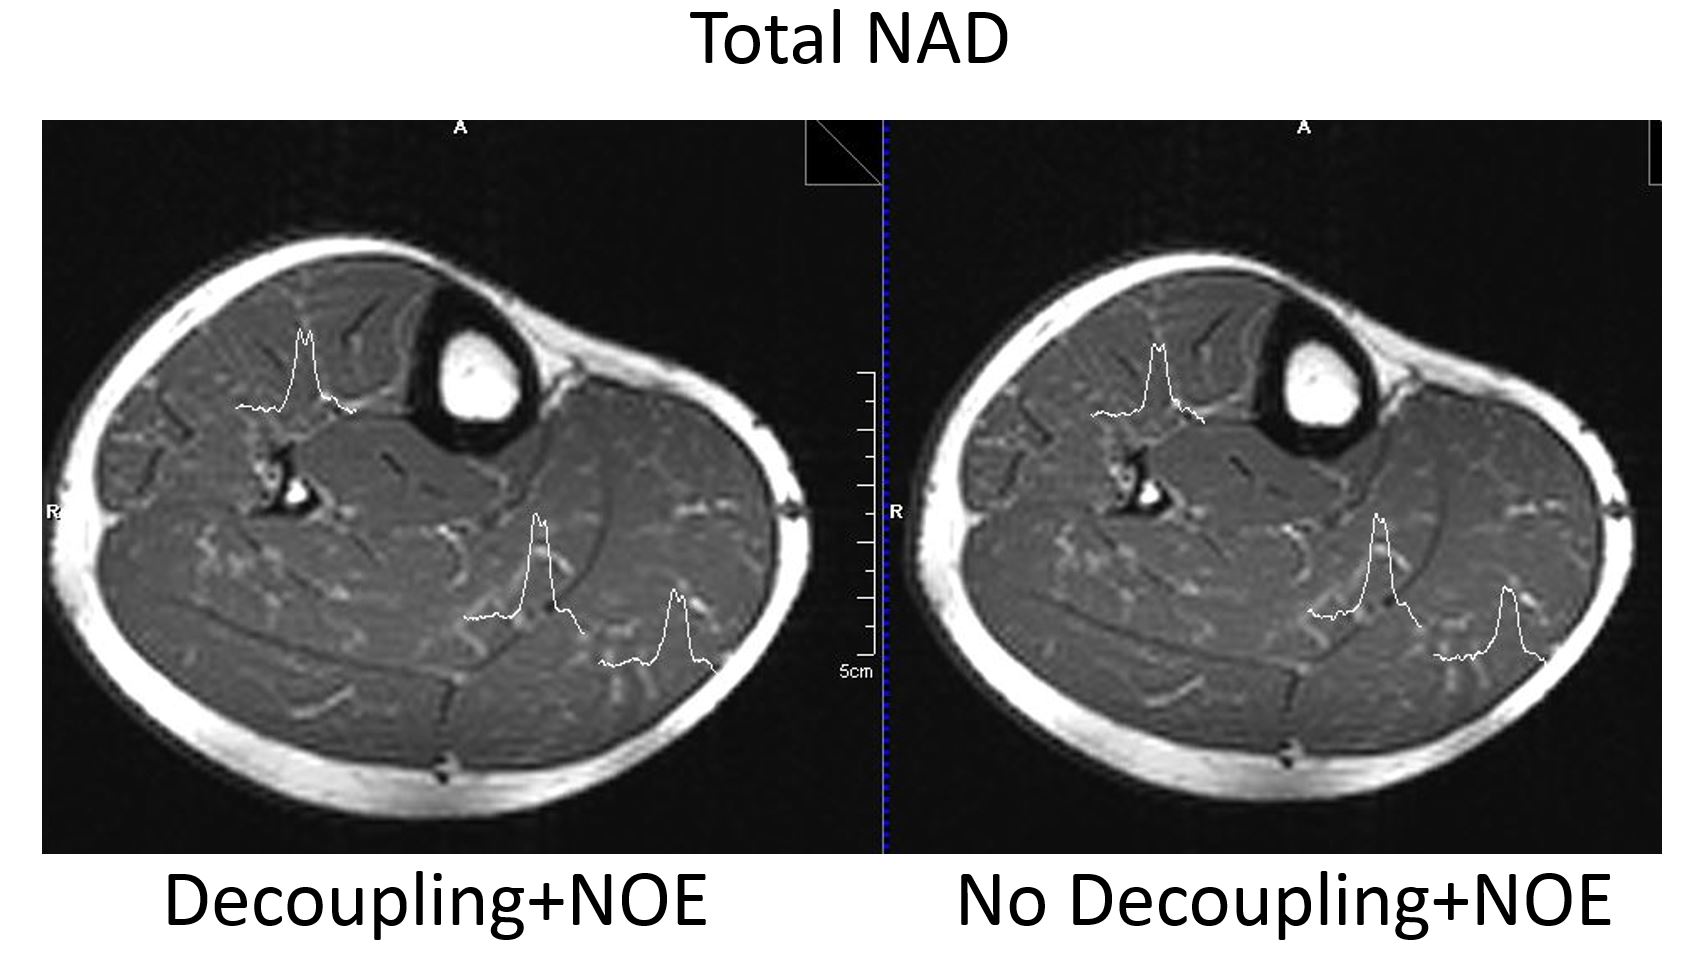
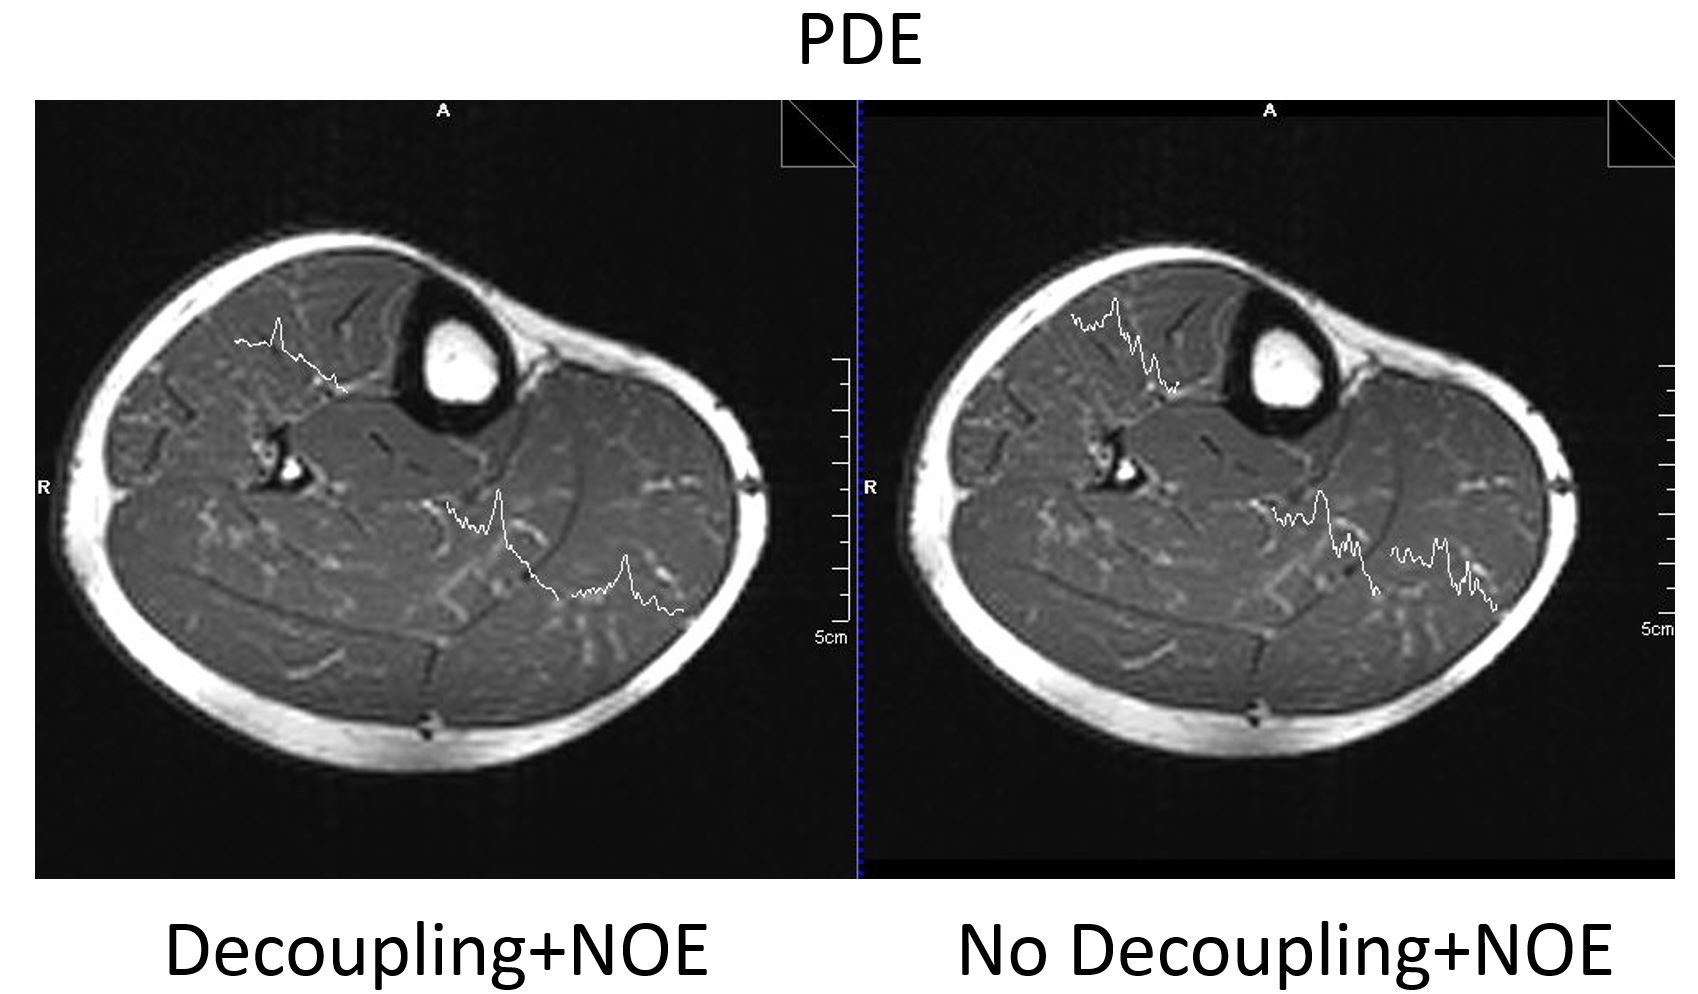
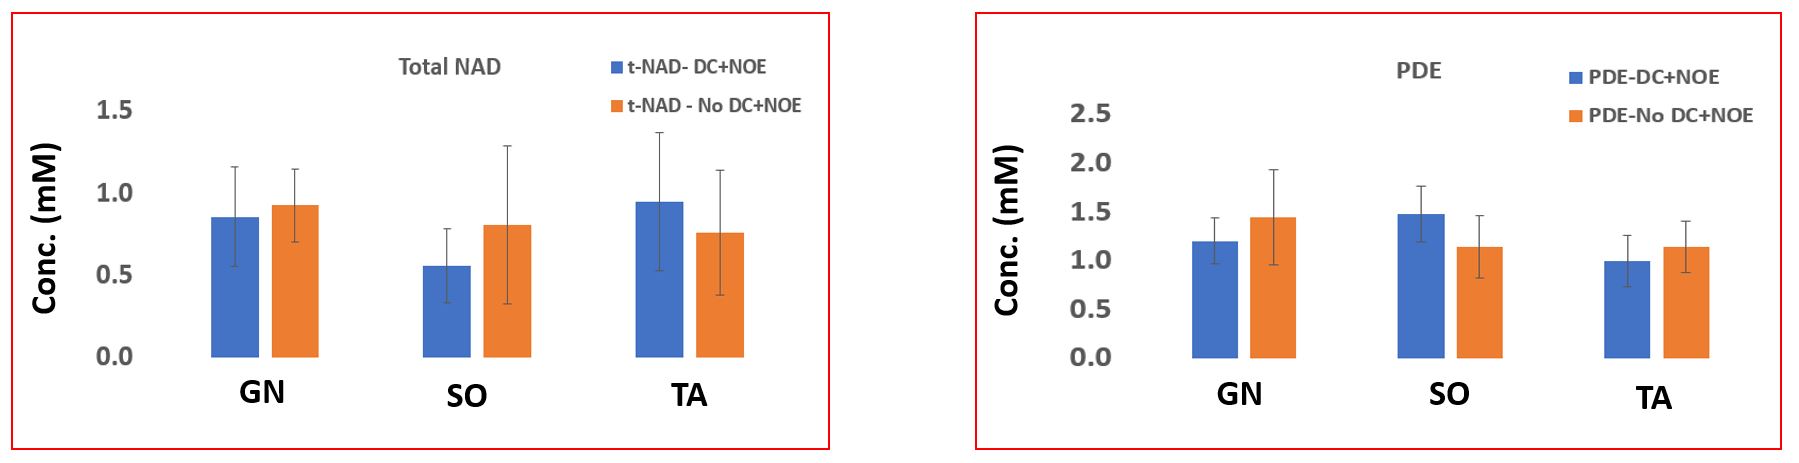
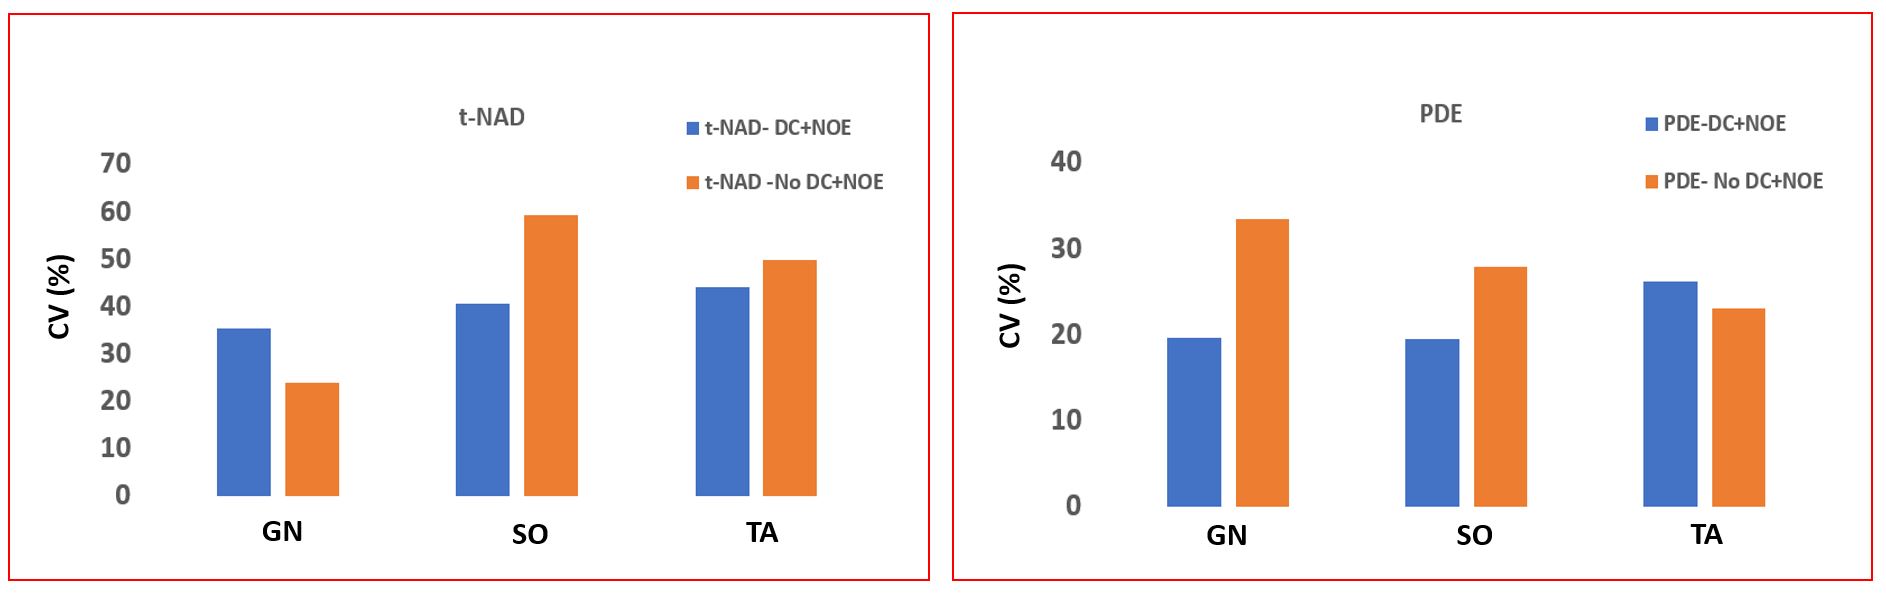
Phosphorus metabolites were detected in the soleus, gastrocnemius, and tibialis anterior muscles. Figure 1 shows the 2D MRSI voxel placement and selected voxels from the soleus, gastrocnemius, and tibialis anterior of a representative healthy young adult. Figure 2 shows representative axial MRI and t-NAD spectra from the soleus, gastrocnemius, and tibialis anterior muscles from the same representative subject, with and without decoupling+NOE. PDE with and without decoupling+NOE is shown in Figure 3. Mean total NAD and PDE concentrations with and without decoupling+NOE from gastrocnemius, soleus and tibialis anterior muscles are shown in Figure 4, and the CV for these measures are displayed in Figure 5. The concentration of PDE was not significantly different for any muscle with vs. without decoupling and NOE (1.20±0.24 vs. 1.45±0.49mM in the gastrocnemius, respectively; 1.48±0.29 vs. 1.15±0.32mM in the soleus; and 1.00±0.26 vs. 1.15±0.27mM in the tibialis anterior; P>0.05). Similarly, the concentration of t-NAD was also not significantly different with vs. without decoupling and NOE in all three muscles (0.86±0.30 vs. 0.93±0.22mM in the gastrocnemius, 0.56±0.23 vs. 0.81±0.48mM in the soleus, and 0.95±0.42 vs. 0.76±0.238mM in the tibialis anterior; P>0.05).Discussion and Conclusions
This study demonstrates the feasibility of mapping skeletal muscle metabolites at low concentrations, such as PDE and t-NAD at 3T. Figures 2 and 3 show better-resolved resonance signals and improved spectral quality of 1H-decoupled+NOE 31P compared to non-decoupled spectra, which could result in more reliable PDE and t-NAD measurement. Also, the CV of PDE without decoupling and NOE was higher in gastrocnemius and soleus muscles compared to decoupling and NOE. Again, the t-NAD coefficient of variance is also elevated in the soleus and tibialis anterior muscle without decoupling and NOE. The small coverage of the k-space with low-resolution MRSI gives rise to side lobes in the spatial response function, causing significant cross-voxel contamination and leading to a higher coefficient of variation. This technique needs to be validated with measurements in more subjects.Acknowledgements
We thank Elena Bliss, our MR Technologist, and Sean Doherty for the jMRUI prior knowledge optimization.References
1. Chance B, Eleff S, Leigh J, et al. Mitochondrial regulation of phosphocreatine/inorganic phosphate ratios in exercising human muscle: gated 31P NMR study.PNAS, 1981; 78, 6714–6719.
2. Meyerspeer M, Boesch C, Cameron D, et al. 31P magnetic resonance spectroscopy in skeletal muscle: Experts' consensus recommendations. NMR in Biomedicine. 2021 May;34(5):e4246.
3. Cresshull I, Dawson M, Edwards R, et al. Human muscle analysed by 31P nuclear magnetic resonance in intact subjects. Journal of Physiology. 1981, 317, 18P
4. Conley KE, Ali AS, Flores B, et al. Mitochondrial NAD (P) H In vivo: Identifying Natural Indicators of Oxidative Phosphorylation in the 31P Magnetic Resonance Spectrum. Frontiers in physiology. 2016;7.
5. Nagarajan R, Bartlett M, Jung KJ, Kent JA, Yadava N. Non-invasive Detection of NADH+ NAD+ in Human Muscle Using 31P MR Spectroscopy at 3T. ISMRM 2018, 5129.
6. Li CW, Negendank WG, Murphy‐Boesch J, et al. Molar quantitation of hepatic metabolites in vivo in proton‐decoupled, nuclear Overhauser effect enhanced 31P NMR spectra localized by three‐dimensional chemical shift imaging. NMR in Biomedicine: An International Journal Devoted to the Development and Application of Magnetic Resonance In Vivo. 1996 Jun;9(4):141-55.
Figures