3948
Alterations in cerebral metabolism from wakefulness to non-REM sleep1Department of Radiology, University of Pennsylvania, Philadelphia, PA, United States, 2Department of Neurology, University of Pennsylvania, Philadelphia, PA, United States, 3Department of Neurosciences, ‘G. d’Annunzio University’ of Chieti-Pescara, Chieti, Italy, 4Institute for Advanced Biomedical Technologies (ITAB), ‘G. d’Annunzio University’ of Chieti-Pescara, Chieti, Italy
Synopsis
Keywords: Data Analysis, Metabolism
Sleep is fundamental to human health and function. Cerebral metabolism and blood supply are key physiological parameters of brain function, but the manner in which they change during different sleep stages is still largely unknown. In this study, we collected wakefulness and sleep data with concurrent EEG-MRI. We measured CBF, SvO2 and CMRO2 with radial OxFlow MRI. Our data show that CMRO2 is lower during non-REM sleep than during wakefulness and declines progressively as sleep stages become deeper. CBF decreases during non-REM sleep compared with wakefulness, while SvO2 gradually increases from wakefulness to slow wave sleep.Introduction
Sleep is important for various aspects of brain function. The human sleep cycle consists of three non-rapid eye movement (non-REM) sleep stages defined as N1, N2, slow wave sleep (SWS) and rapid eye movement sleep. Each sleep stage has a distinct function. Cerebral blood flow (CBF), venous oxygen saturation (SvO2) and cerebral metabolic rate of oxygen (CMRO2) are key physiological parameters of brain function. A recent study has demonstrated feasibility of quantifying changes in cerebral metabolism associated with sleep, specifically to uncover the changes in brain oxygen metabolism during SWS1. In distinction to this prior work, the purpose of the present study was to investigate the changes in these physiological parameters during various sleep stages.Method
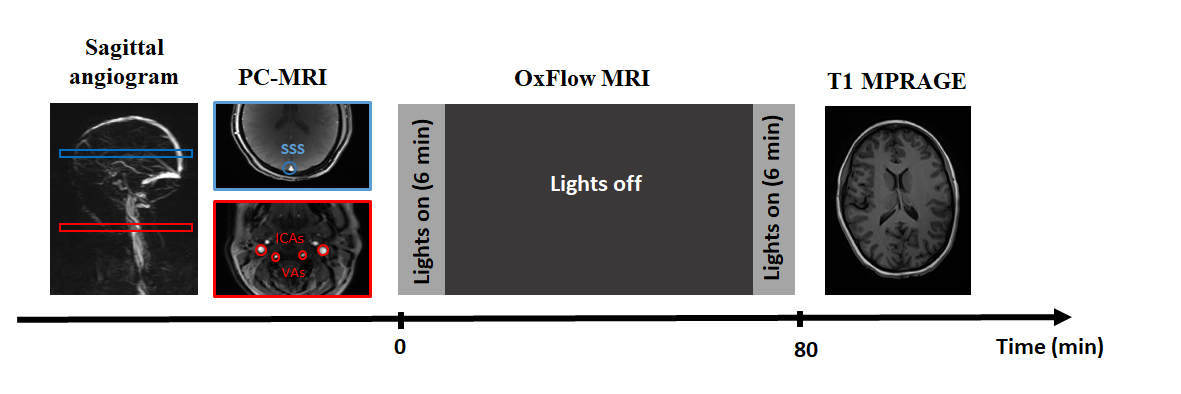
The study was approved by the Institutional Review Board of the University of Pennsylvania. Eight subjects (6 female, mean age: 27±4.1 y) were recruited. EEG data were acquired with a 15-channel MR-compatible EEG system from Brain Products with a sampling rate of 5000 Hz. EEG data were processed offline with Brain Vision Analyzer. First, gradient artifacts were removed using a sliding window average of 21 intervals. Pulse artifacts were removed by subtracting an average ECG artifact template. Subsequently, a passband filter encompassing the range from 0.5 to 24 Hz was applied, with a notch filter at 60 Hz. Independent component analysis was applied to remove residual noise. The data were further down-sampled to 250 Hz. Sleep stage was scored for every 30-s frame of preprocessed EEG data according to AASM criteria.Five discrete sleep stages were identified and scored: wakefulness, non-REM stage 1 (N1), non-REM stage 2 (N2), slow wave sleep (SWS), and REM.Imaging was performed on a 3T MR scanner (Siemens Prisma, Erlangen, Germany) using a 64-channel head-neck coil. Figure 1 shows the study protocol. Scan parameters for the OxFlow sequence were as follows: FOV=240*240 mm2, slice thickness=5 mm, flip angle=20°, TR=40 ms, inter-echo spacing=5 ms, velocity encoding (VENC)=76.4 cm/s, first echo time=6.03 ms, duration=80 min. The OxFlow sequence uses golden angle radial k-space sampling1-2. The temporal footprint is 48.8 s and the effective temporal resolution is 2.72 s. CBF was quantified in the superior sagittal sinus (SSS), and upscaled to yield total CBF; SvO2 was also quantified in the SSS via MRI susceptometry3. CMRO2 was calculated via Fick’s principle. Mean and standard deviation of the parameters were calculated for each sleep stage. One-way ANOVA with Tukey’s post hoc test was applied to compare the differences in the three parameters under different sleep stages.
Results
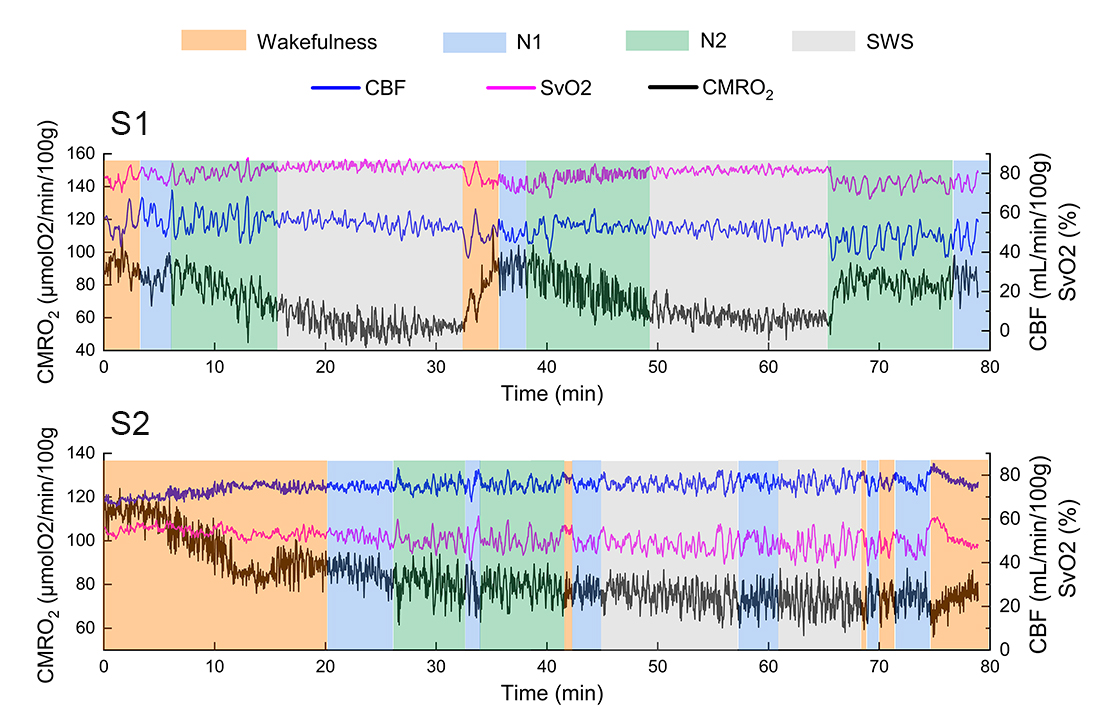
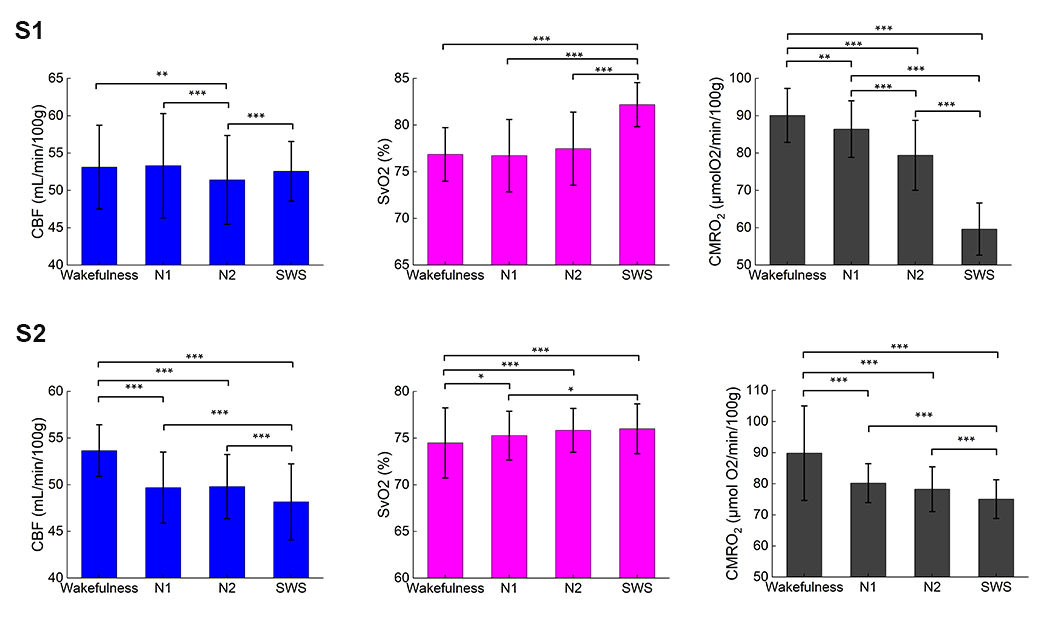
Three out of eight subjects achieved slow wave sleep and one of them was excluded due to head motion, thus two subjects (S1: female, 29y; S2: female, 27y) were included in this abstract. Figure 2 shows CBF, SvO2 and CMRO2 time-series for the two subjects who successfully achieved slow-wave sleep. Subject S1 exhibits a typical non-REM sleep pattern. CMRO2 decreases gradually during the first non-REM sleep cycle (from t=0 to t=32 min). The subject achieved slow-wave sleep at t=15 min, and CMRO2 reached a nadir at t=25 min. Subsequently, the subject awakens from SWS at t=32 min, coincident with a sharp increase in CMRO2. Subject S2 displays more arousals compared with the first subject. The subject achieved slow-wave sleep at t=45 min, with the mean CMRO2 during SWS clearly lower than during wakefulness and light sleep (N1). Figure 3 shows the three parameters during different sleep stages. Multiple comparison results show that CBF during wakefulness, N1 and SWS are significantly higher than N2 for the first subject. For the second subject, CBF during wakefulness is higher than during non-REM sleep, reaching a minimum during SWS. Conversely, SvO2 gradually increases from wakefulness toward SWS, reaching a maximum during SWS for both subjects. CMRO2 is lower than during wakefulness during non-REM sleep, declining progressively toward greater sleep stage for both subjects.Discussion
We investigated the changes in cerebral metabolism during wakefulness and non-REM sleep with radial OxFlow MRI. The data suggest SvO2 to be greater than during wakefulness during all non-REM sleep stages, and increasing progressively toward deeper sleep, while CMRO2 during non-REM sleep is lower than during wakefulness, reaching a minimum during SWS as found previously1. CBF for the second subject was found to decrease from wakefulness to non-REM sleep, consistent with recent finding in the authors’ laboratory1. However, CBF during wakefulness was not significantly higher than during N1 and SWS for the first subject. The reason might be that the subject was very sleepy at beginning of the exam, as suggested by the short sleep onset latency of 3 minutes. Further, the total wake time of 6 minutes was found to be unusually short. There are two limitations in the study. First, five out of eight subjects did not achieve SWS, which we attribute to the discomfort of the scanner environment (EEG cap, scanner noise, space confinement), which could, at least in part, be mitigated through active sleep deprivation. Further, while minor, we did not distinguish eyes open from eyes closed conditions. Previous studies found that global CBF differs between eyes-open and eyes-closed resting state4,5. In future work, we plan to determine the metabolic implications of these two states of wakefulness.Acknowledgements
NIH R21 AG065816References
1. Caporale A, Lee H, Lei H, et al. Cerebral metabolic rate of oxygen during transition from wakefulness to sleep measured with high temporal resolution OxFlow MRI with concurrent EEG. J Cereb Blood Flow Metab. 2021; 41(4):780-792.
2. Cao W, Chang YV, Englund EK, et al. High-speed whole-brain oximetry by golden-angle radial MRI. Magn Reson Med 2018; 79: 217–223.
3. Wehrli FW, Fan AP, Rodgers ZB, et al. Susceptibility-based time-resolved whole-organ and regional tissue oximetry. NMR Biomed. 2017;30(4): e3495.
4. Raichle, ME, MacLeod, AM, Snyder, AZ, et al. A default mode of brain function. Proc.Nat. Acad. Sci. U. S. A. 2001; 98: 676 – 682.
5. Uludağ K, Dubowitz DJ, Yoder EJ, et al. Coupling of cerebral blood flow and oxygen consumption during physiological activation and deactivation measured with fMRI. NeuroImage. 2004; 23(1):148-55.
Figures