3946
Correlations of 31P-containing metabolites in human brain at 3 and 7 Tesla1National Institute of Mental Health, National Institutes of Health, Bethesda, MD, United States
Synopsis
Keywords: Data Analysis, Spectroscopy
Numerical Monte Carlo analysis was performed to quantify metabolite-metabolite correlations of spectral origin in 31P MRS spectra acquired from human brain at both 3 and 7 Tesla without any confounding biological correlations. Significant correlations were found for many 31P-containing metabolite pairs. In particular, the 3 and 7 Tesla NAD+-NADH correlations are significantly different because of the field strength difference. These results demonstrate that it is necessary to incorporate metabolite-metabolite correlations originating from spectral overlap into statistical models that correlate MRS measurements with clinical parameters when overlapping 31P signals are of clinical interest.Introduction
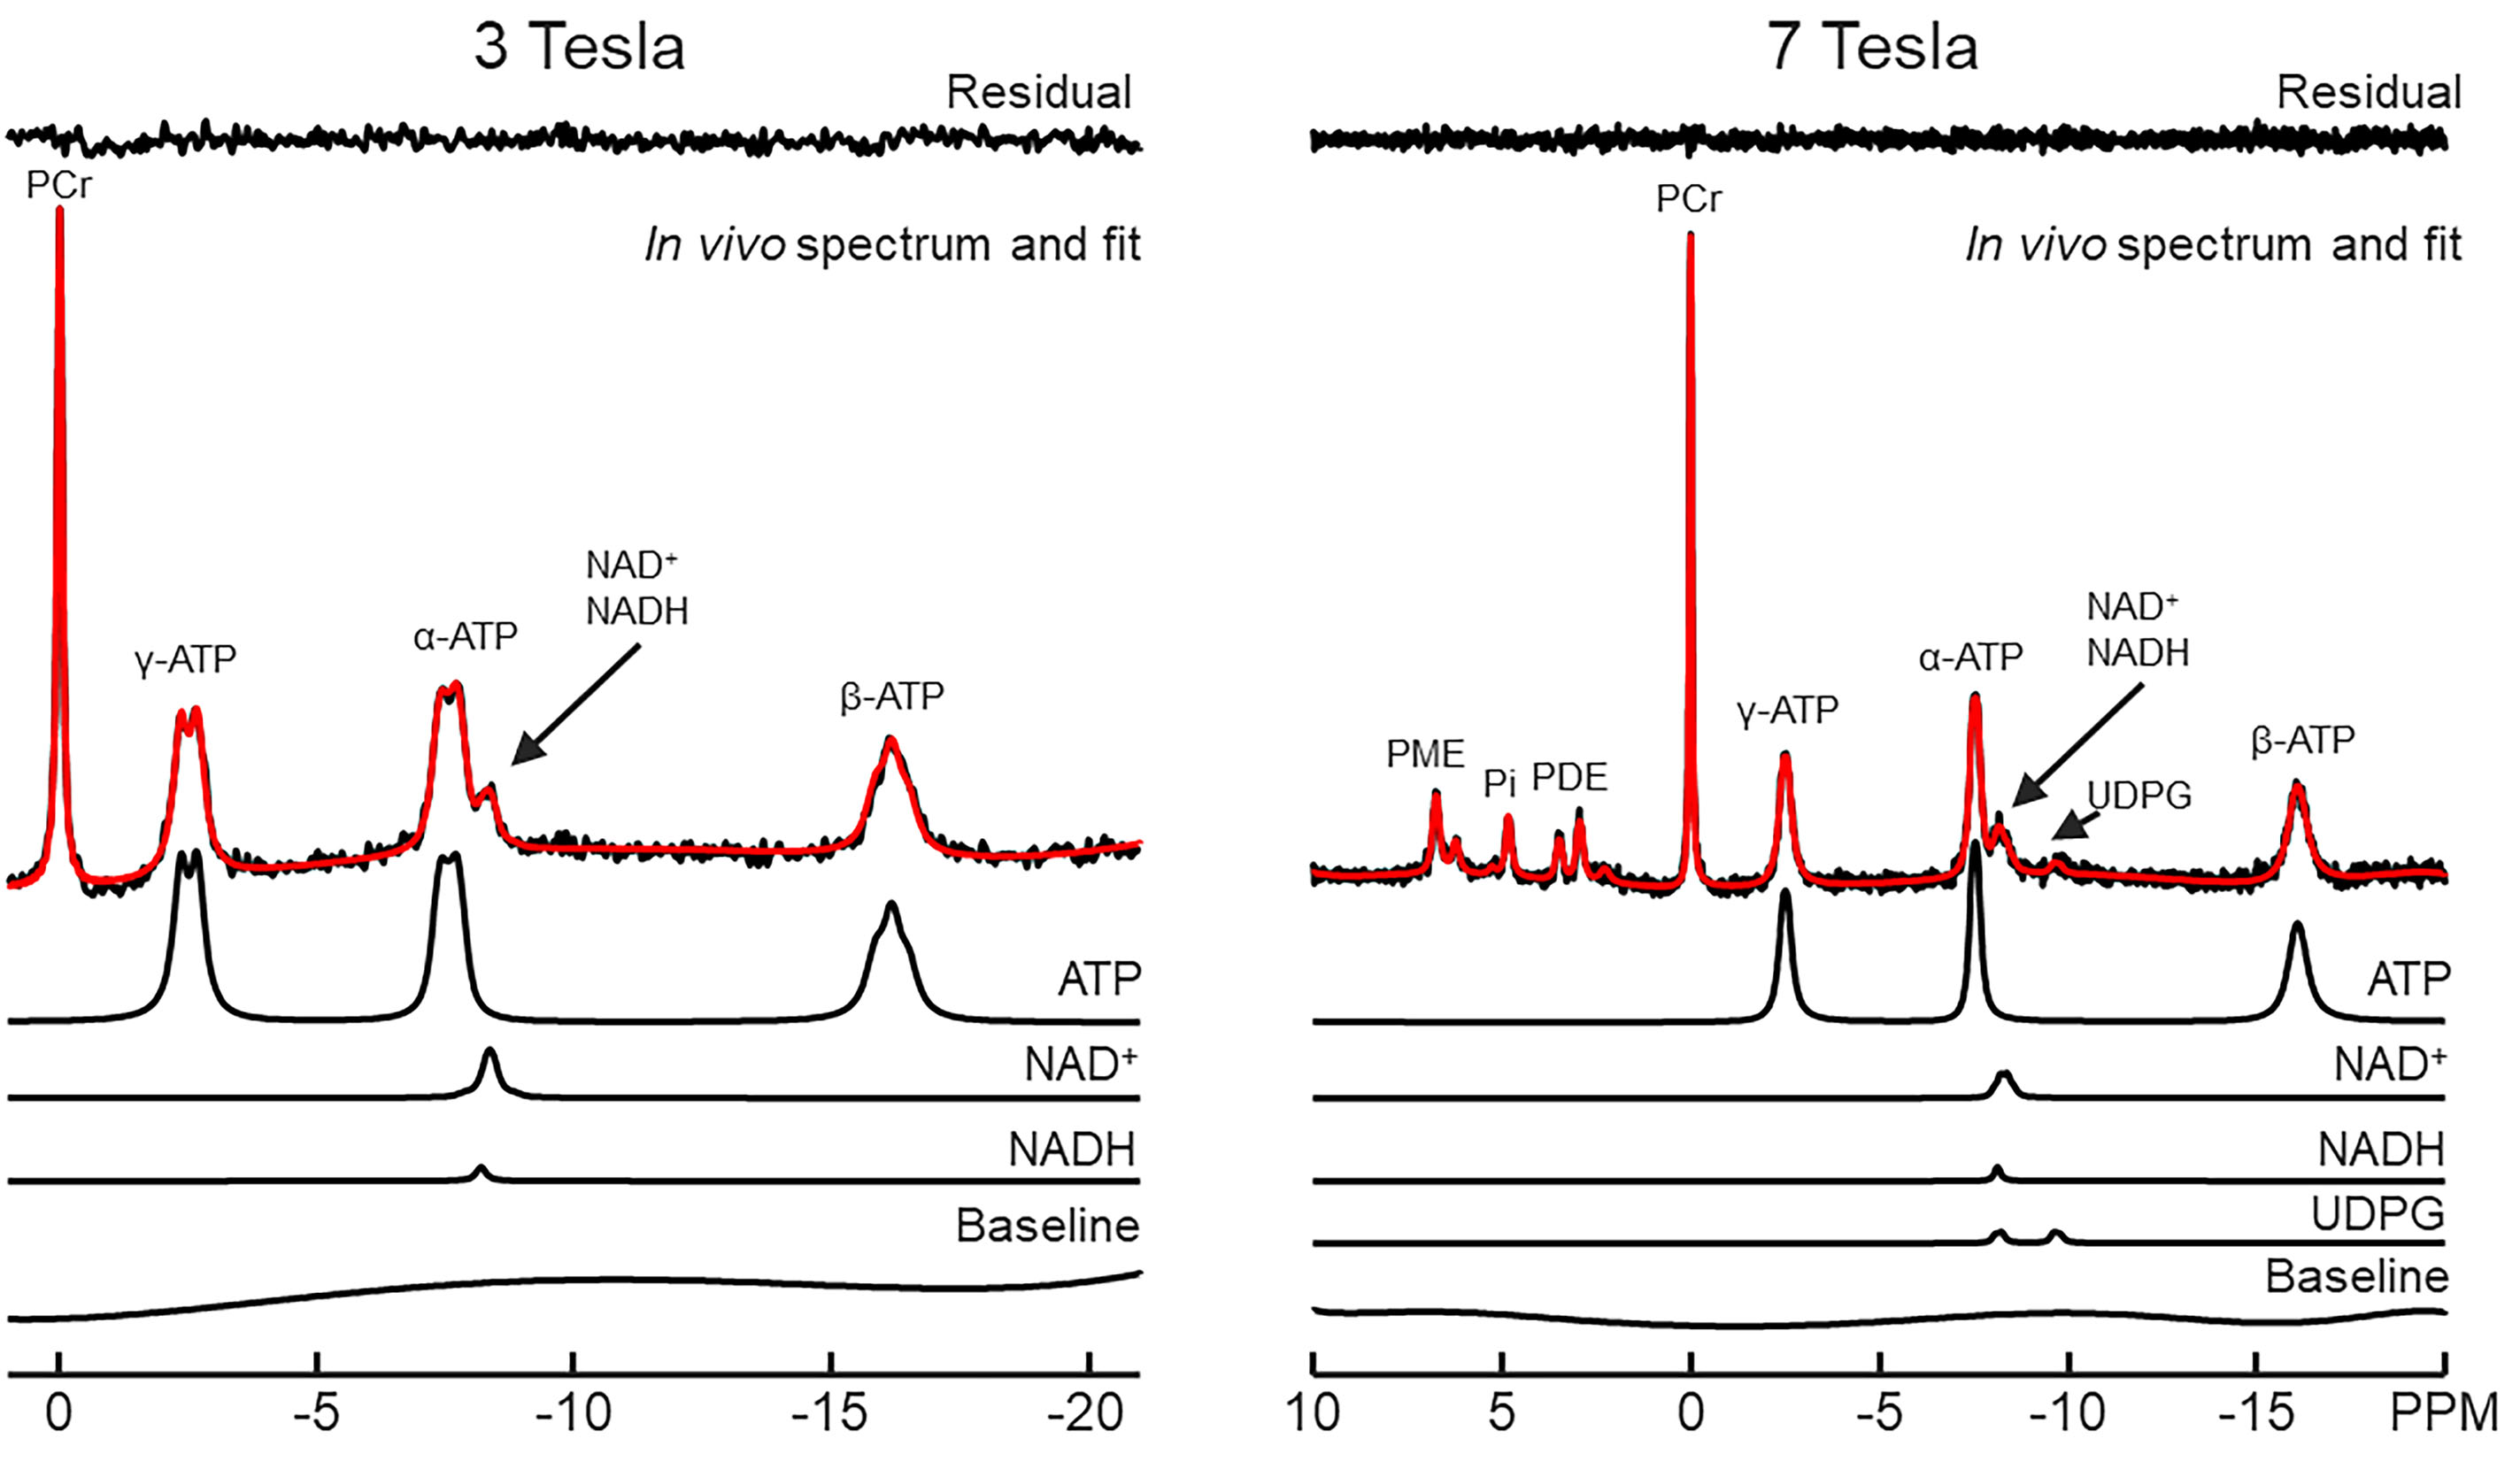
In vivo 31P MRS has been widely used to study brain disorders. However, there is severe spectral overlap in 31P MRS spectra even at 7 Tesla (for example, spectral overlap among α-ATP, NAD+, NADH, and UDPG). Since spectral overlap per se can lead to significant correlations between metabolites1 it is necessary to incorporate correlations of spectral origin into statistical models for correlating overlapping 31P MRS signals with clinical parameters. In this work, Monte Carlo analysis was performed to systematically quantify metabolite-metabolite correlations of spectral origin in 31P MRS spectra in the absence of any confounding correlations of biological origins. The effects of field strengths and background spectral baseline on metabolite-metabolite correlations were also characterized in detail.Methods
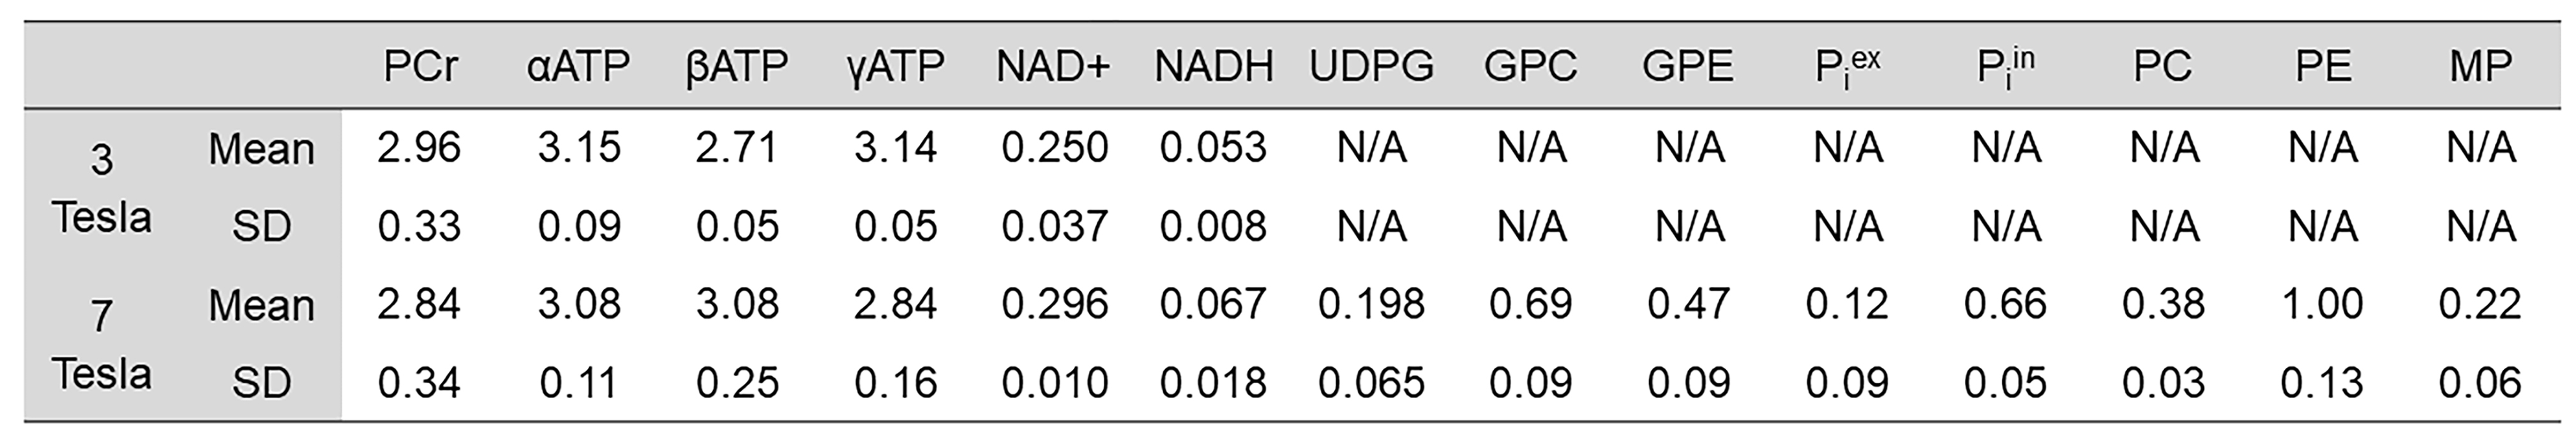
In vivo 31P MRS data In vivo data of five healthy participants for each field strength were analyzed. The in vivo 31P MRS data were acquired using Siemens Skyra 3 Tesla and Magnetom 7 Tesla scanners (Siemens Healthcare, Erlangen, Germany) and home-built coil assemblies using a circular 31P coil with 7.0 cm diameter as described previously2. Briefly, in vivo 31P MRS data acquisition used a pulse-acquire sequence. Relevant parameters at 3 Tesla were: TR = 2 seconds; spectral width = 5 kHz; number of acquisitions = 128; number of data points = 1024. Identical parameters were used at 7 Tesla except that TR = 3 seconds.Data processing and quantification The same data processing procedure was applied for both field strengths. The first two data points in FID were set to zero to suppress the baseline in 31P MRS spectrum3. Subsequently, zero-filling, 1-Hz exponential line broadening, Fourier transform, zero- and first-order phase corrections, and chemical shift referencing (PCr was set at 0 ppm) were performed. All spectra were quantified using an in-house developed fitting program4 implementing the linear combination model fitting algorithm5. Spectral regions covering -20 to 1 ppm at 3 Tesla and -20 to 10 ppm at 7 Tesla, respectively, were quantified. The downfield region at 3 Tesla was excluded2. All basis data were numerically calculated with chemical shifts and coupling constants taken from the literature6,7. UDPG was excluded in the basis data of 3 Tesla due to its low sensitivity. The background spectral baseline was modeled as a polynomial. For calculating absolute concentrations, total ATP (sum of α-, β-, and γ-ATP) were used as an internal reference, assumed to be 9 mM8.
Monte Carlo analysis of in vivo spectra Individually fitted metabolites including spectral baseline were derived from linear combination model fitting. Subsequently, two different datasets comprising metabolites only and metabolites + baseline were generated. Lastly, noise with its level derived from the corresponding in vivo spectrum was added. For each spectrum 2000 different noise realizations were used. Each spectrum was then fitted using the linear combination model fitting program described in Data processing and quantification.
Correlation analysis Using concentrations of individual metabolites from Monte Carlo analysis, Pearson’s correlation coefficients were calculated to investigate the effect of field strength and spectral baseline on metabolite-metabolite correlations.
Results
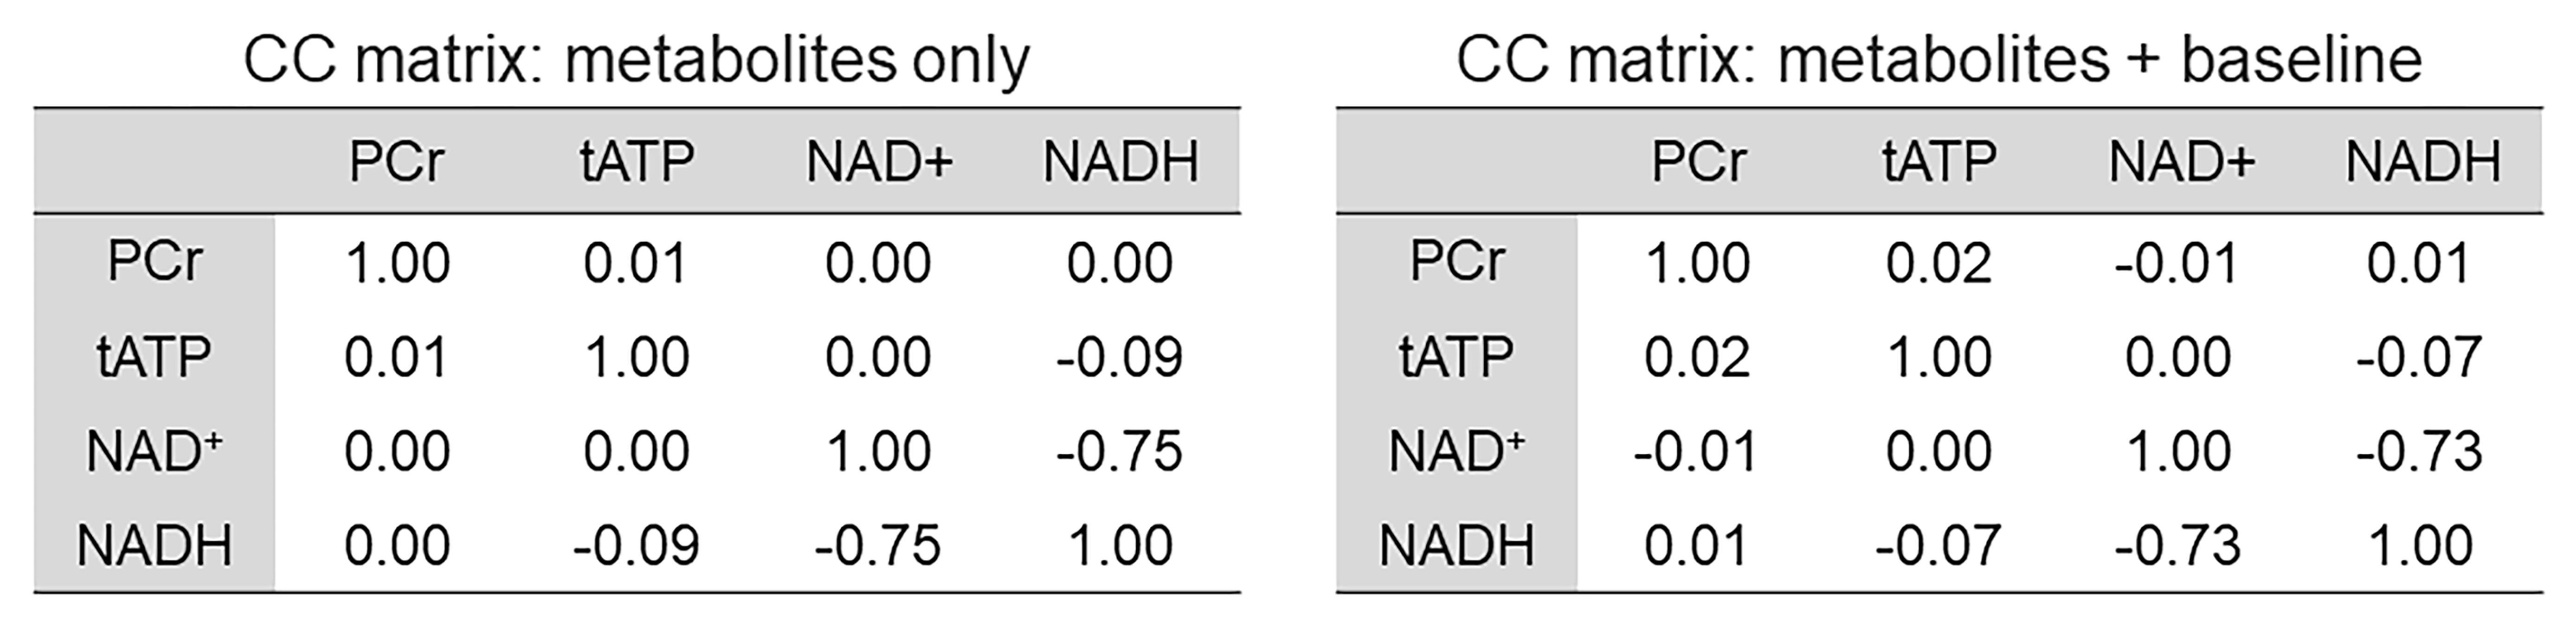
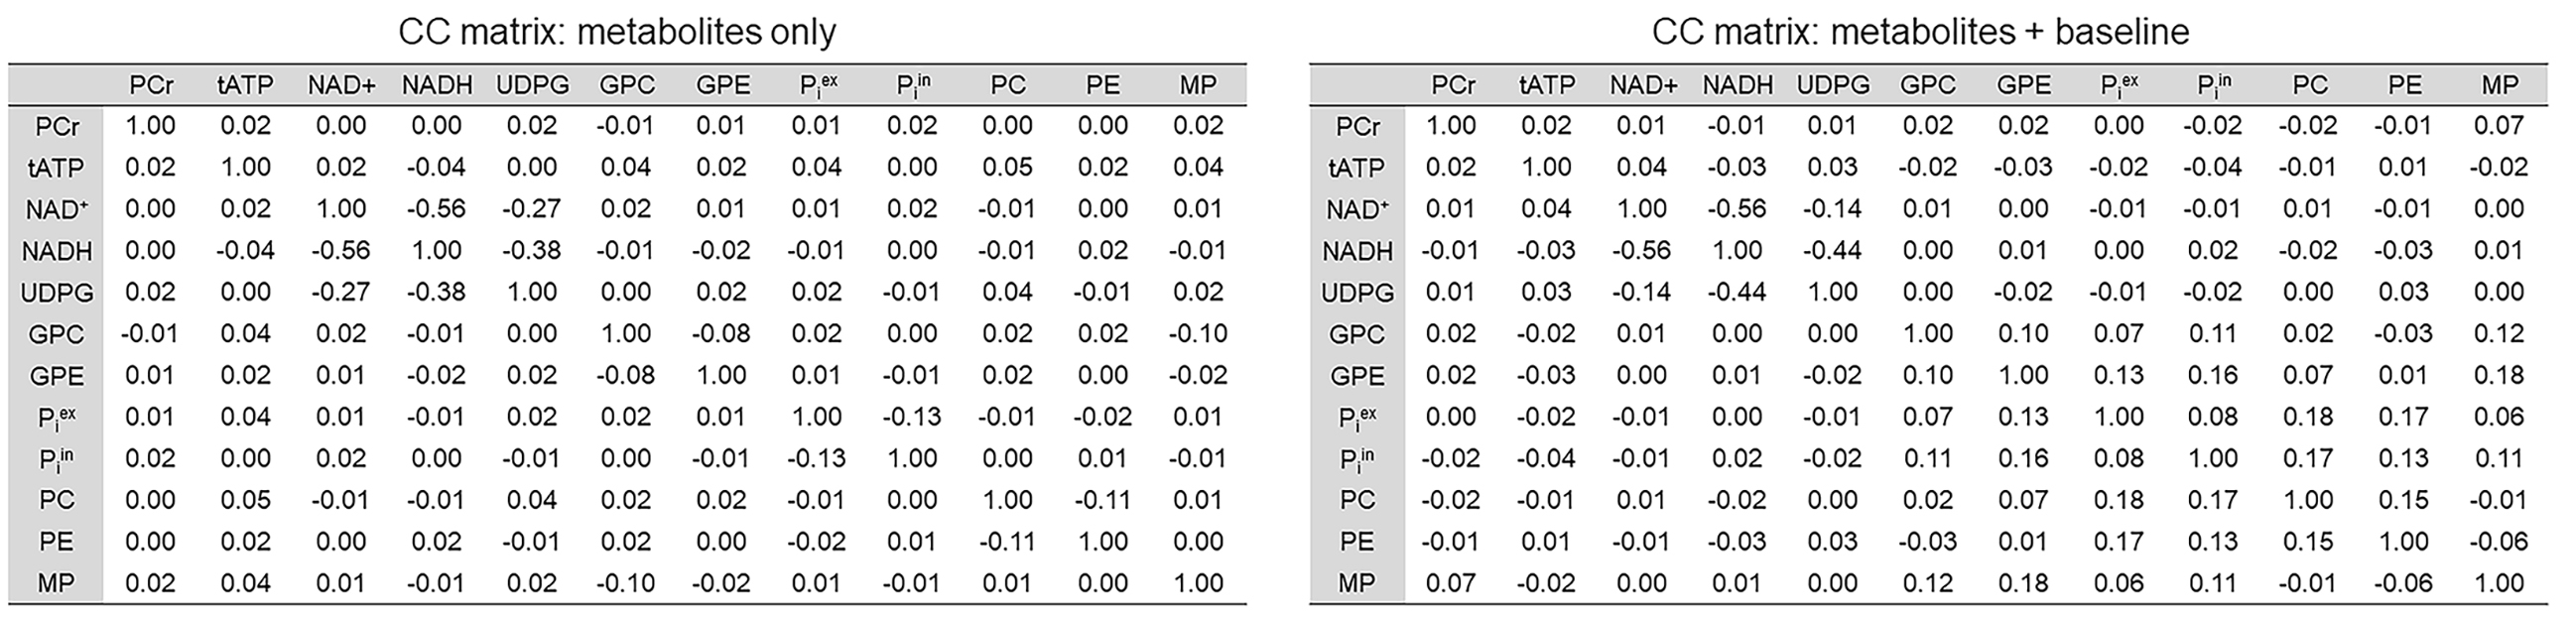
Figure 1 shows representative 3 Tesla (left panel) and 7 Tesla (right panel) in vivo 31P MRS spectra. Means and standard deviations of metabolite concentrations obtained at both field strengths are listed in Table 1. Tables 2 and 3 show the mean Pearson’s correlation coefficient matrices derived from Monte Carlo simulations performed using in vivo 31P MRS data at 3 Tesla (n = 5) and 7 Tesla (n = 5), respectively. Due to the severe spectral overlap between NAD+ and NADH, the Pearson’s correlation coefficient of the NAD+-NADH pair at 3 Tesla is quite large (r = -0.73 ~ -0.75) with and without the baseline. In comparison, the Pearson’s correlation coefficient for the NAD+-NADH pair is markedly reduced at 7 Tesla (r = -0.56). While UDPG is detectable at 7 Tesla it has significant correlations with both NAD+ and NADH. The background spectral baseline was found to have significant influence on certain metabolite-metabolite correlations. For example, the Pearson’s correlation coefficient of the PC-PE pair changed from -0.11 without the baseline to +0.15 with the baseline at 7 Tesla.Discussion
Compared to the crowded short echo time proton MRS spectra there is generally a wide chemical shift dispersion in 31P MRS spectra. To the best of our knowledge correlations originating from spectral overlap in 31P MRS spectra have not been taken into account when correlating overlapping 31P MRS signals with clinical parameters. However, at magnetic field strength such as 3 Tesla there is significant spectral overlap in the downfield region involving phosphoesters, Pi, and the prominent membrane phosphate signal that is not well understood2. Even at 7 Tesla there is severe spectral overlap involving α-ATP, NAD+, NADH, and UDPG. The results of this study showed that spectral correlations can be significant for 31P MRS data and are affected by both field strength and the background spectral baseline. Therefore, correlations in 31P MRS data due to spectral overlap need to be built into statistical models for clinical analysis.Acknowledgements
No acknowledgement found.References
1. Hong S, An L, Shen J. Monte Carlo study of metabolite correlations originating from spectral overlap. J Magn Reson 2022;341:107257.
2. Li S, van der Veen JW, An L, Stolinski J, Johnson C, Ferraris-Araneta M, Victorino M, Tomar JS, Shen J. Cerebral phosphoester signals measured by 31P magnetic resonance spectroscopy at 3 and 7 Tesla. PLoS One 2021;16(3):e0248632.
3. Stanley JA, Pettegrew JW. Postprocessing method to segregate and quantify the broad components underlying the phosphodiester spectral region of in vivo 31P brain spectra. Magn Reson Med 2001;45(3):390-396.
4. de Graaf RA, Chowdhury GM, Behar KL. Quantification of high-resolution 1H NMR spectra from rat brain extracts. Anal Chem 2011;83(1):216-224.
5. Provencher SW. Estimation of metabolite concentrations from localized in vivo proton NMR spectra. Magn Reson Med 1993;30(6):672-679.
6. Deelchand DK, Nguyen TM, Zhu XH, Mochel F, Henry PG. Quantification of in vivo 31P NMR brain spectra using LCModel. NMR Biomed 2015;28(6):633-641.
7. Xin L, Ipek O, Beaumont M, Shevlyakova M, Christinat N, Masoodi M, Greenberg N, Gruetter R, Cuenoud B. Nutritional Ketosis Increases NAD+/NADH Ratio in Healthy Human Brain: An in Vivo Study by 31P-MRS. Front Nutr 2018;5:62.
8. Ren J, Sherry AD, Malloy CR. 31P-MRS of healthy human brain: ATP synthesis, metabolite concentrations, pH, and T1 relaxation times. NMR Biomed 2015;28(11):1455-1462.
Figures