3945
Improved reproducibility of GABA measurement in short-TE 1H MRS by linewidth-matched basis sets1Animal imaging and technology, CIBM, EPFL, Lausanne, Switzerland, 2Laboratory for Functional and Metabolic Imaging (LIFMET), EPFL, Lausanne, Switzerland
Synopsis
Keywords: Data Processing, Spectroscopy, LCModel
This study investigated the spectral linewidth effect on GABA quantification, as well as its correction approach in LCModel with both simulated and in vivo acquired 1H MR spectra. Using the same basis set to fit spectra with different linewidths results in elevated variations between measurements. An effective method to reduce the variability caused by the linewidth difference effect and more accurately quantify GABA is to use spectral-linewidth-matched basis sets. This study shows the validity of this approach for most of the Voigt-type spectra.
Introduction
γ-Aminobutyric acid (GABA) is an important inhibitory neurotransmitter that is widely distributed in the human brain and vital to brain functioning1. The use of short-TE MRS is challenging in reliable and reproducible quantification of GABA due to its low concentration and the overlapping resonances of other metabolites as well as the background macromolecular components2,3. Previous studies have shown that the linewidths and lineshapes of spectra have significant impacts on quantification bias in short-TE MR spectra using LCModel4,5. Therefore, we propose that the linewidth and lineshape variability within a group dataset should be considered and corrected during quantification to improve the reproducibility of GABA measurement; and hypothesized that spectral linewidth- and lineshape-matched basis set may improve quantification precision of GABA, especially for datasets with large variability in spectral quality. In this study, we first evaluated the quantification bias of GABA by matched and non-matched basis sets with simulated spectral data. A set of test-retest in vivo motor cortex data was then used to validate that the linewidth-matched basis sets can improve measurement reproducibility and reduce interscan variability.Methods
MR spectroscopyAll MR measurements of the human brain were performed on a 7-Tesla/68 cm MRI scanner (Siemens Medical Solutions, Erlangen, Germany). The optimization of the magnetic field inhomogeneities was performed with FASTMAP6. The spectra in the motor cortex (M1) (5 subjects, two repeated scans per subject) were measured using sSPECIAL (TR/TE = 4000/16ms, 128 averages, bandwidth = 4 kHz, voxel size = 30×20×20 mm3, data points = 2048) combined with VAPOR water suppression and OVS using a single-channel quadrature transmitter and a 32-channel receiver coil (Nova Medical Inc., MA, USA)7.
Simulations
20 metabolite basis spectra8 were simulated in MATLAB R2022a. The full width at half maximum (FWHM) of simulated spectra was set from 7 Hz to 12 Hz with a step of 0.5 Hz corresponding to measured FWHMs at 7T with various Voigt shapes. Since the Voigt can be decomposed into the Lorentzian and the Gaussian components9, the Gaussian proportion of a Voigt was defined as FWHMGauss/FWHMVoigt×100% in the frequency domain. No random noise was added to the simulated spectra.
Spectral processing and quantitative analysis
The raw data were processed by FID-A10. The spectral linewidth and lineshape were estimated from the unsuppressed water spectra by Voigt fitting in the frequency domain. Linewidth-matched basis sets (Figure 1) were prepared using the Lorentzian line broadening with a FWHM that is 1Hz narrower than that of in vivo spectra.
All spectra were fitted with LCModel Version 6.3-1R with water-scaling. For in vivo human brain spectra, tissue correction and T2 relaxation correction were applied for absolute quantification11. The estimated errors (EEs) of the simulation were computed by (Cmeasured-Cground truth)/Cground truth×100%. To evaluate the reproducibility of the GABA measurement, coefficients of variation (CV) were calculated by the ratio of the difference and the mean of measured concentrations of two repeated scans.
Results
According to the Voigt fitting of 10 unsuppressed water spectra and the singlets of creatine at 3.03ppm (5 subjects, two scans per subject) acquired from the human motor cortex, the water linewidths of in vivo spectra varied from 12.4 Hz to 14.9 Hz, the linewidth of the methyl group of creatine varied from 9.5 Hz to 12.5 Hz, and the Gaussian proportions were all within 50% to 70%.Figure 2(a) demonstrated that using one basis set for all the datasets (with various linewidths and lineshapes) may lead to larger measurement deviations. And using a spectral-linewidth-matched basis set for each spectrum is a valid approach to partially correct the linewidth difference in most of the Voigt spectra (Gaussian proportion < 80%) and somewhat offset the underestimation. Thus, the CV of GABA can be effectively reduced, for example, from 23% to 7% relative to the use of the same 2 Hz basis set for two measurements (Gaussian proportion = 50%, and a linewidth of 7 Hz and 12 Hz, respectively). In vivo data also validated the CV decrements relying on the difference in linewidth between the two repeated scans (Figure 3), reducing the estimation errors caused by the linewidth differences.
Discussion and Conclusion
In this study, we demonstrated that spectral linewidth and lineshape estimates are required to improve reproducible GABA quantification. GABA concentrations are in general underestimated in spectra with Lorentzian- or Voigt-type shapes, as shown in the simulation study. The degree of underestimation was affected by the linewidth difference between the spectra and the basis set, whereas using a linewidth-matched basis set reduced estimation errors. The variance of GABA quantification can be reduced, particularly in datasets where linewidth and lineshape vary greatly. This approach can improve the reproducibility of GABA quantification, which facilitates the detection of small changes in longitudinal studies. This method can also be applied to MRSI datasets to reduce the bias, where B0 inhomogeneity may result in different linewidths and lineshapes in different voxels. The incorporation of a matched lineshape in the basis set may further improve the accuracy of the GABA quantification, which will be investigated in the future. In conclusion, the choice of the spectral linewidth-matched basis set can partially correct the quantification bias resulting from the spectral linewidth and improve the reproducibility of GABA measurements.Acknowledgements
This work was supported by the Swiss National Science Foundation (grants n° 320030_189064). We acknowledge access to the facilities and expertise of the CIBM Center for Biomedical Imaging, a Swiss research center of excellence funded and supported by Lausanne University Hospital (CHUV), University of Lausanne (UNIL), Ecole Polytechnique Fédérale de Lausanne (EPFL), University of Geneva (UNIGE) and Geneva University Hospitals (HUG).
References
1. Siucinska, Ewa. (2019). "Γ-Aminobutyric acid in adult brain: an update." Behavioural Brain Research 376, 112224.
2. Mescher, M., et al. (1998). "Simultaneous in vivo spectral editing and water suppression." NMR in Biomedicine: An International Journal Devoted to the Development and Application of Magnetic Resonance In Vivo 11.6, 266-272.
3. Near, J., Andersson, J., Maron, E., Mekle, R., Gruetter, R., Cowen, P. and Jezzard, P. (2013). Unedited in vivo detection and quantification of γ‐aminobutyric acid in the occipital cortex using short‐TE MRS at 3 T. NMR in Biomedicine, 26(11), pp.1353-1362.
4. Ying, X., Ivan, T., and Lijing, X., “Investigating the influences of spectral lineshape and linewidth in LCModel basis-sets on 1H MRS quantification at 7T”; ISMRM 2022
5. Marjańska, Małgorzata, et al. "Results and interpretation of a fitting challenge for MR spectroscopy set up by the MRS study group of ISMRM." Magnetic resonance in medicine 87.1 (2022): 11-32.
6. Gruetter, R., & Tkáč, I. (2000). Field mapping without reference scan using asymmetric echo‐planar techniques. Magnetic Resonance in Medicine: An Official Journal of the International Society for Magnetic Resonance in Medicine, 43(2), 319-323.
7. Lim, S. I., & Xin, L. (2022). γ‐aminobutyric acid measurement in the human brain at 7 T: Short echo‐time or Mescher–Garwood editing. NMR in Biomedicine, e4706.
8. Govindaraju, V., Young, K. and Maudsley, A.A. (2000). Proton NMR chemical shifts and coupling constants for brain metabolites. NMR in Biomedicine: An International Journal Devoted to the Development and Application of Magnetic Resonance In Vivo, 13(3), pp.129-153.
9. Olivero, J.J. and Longbothum, R.L. (1977). Empirical fits to the Voigt line width: A brief review. Journal of Quantitative Spectroscopy and Radiative Transfer, 17(2), pp.233-236.
10. Simpson, R., Devenyi, G. A., Jezzard, P., Hennessy, T. J., & Near, J. (2017). Advanced processing and simulation of MRS data using the FID appliance (FID‐A)—an open source, MATLAB‐based toolkit. Magnetic resonance in medicine, 77(1), 23-33.
11. Dhamala, E., Abdelkefi, I., Nguyen, M., Hennessy, T. J., Nadeau, H., & Near, J. (2019). Validation of in vivo MRS measures of metabolite concentrations in the human brain. NMR in Biomedicine, 32(3), e4058.
Figures
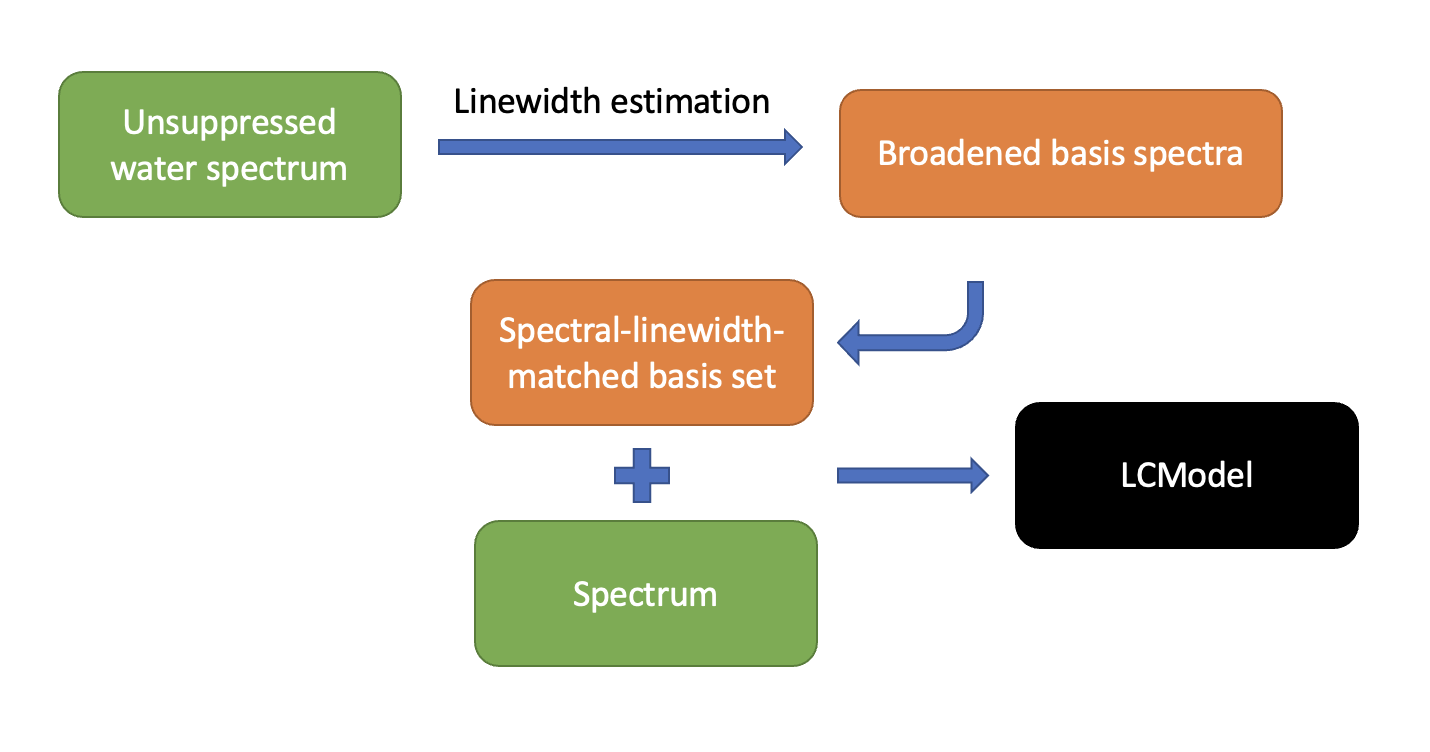
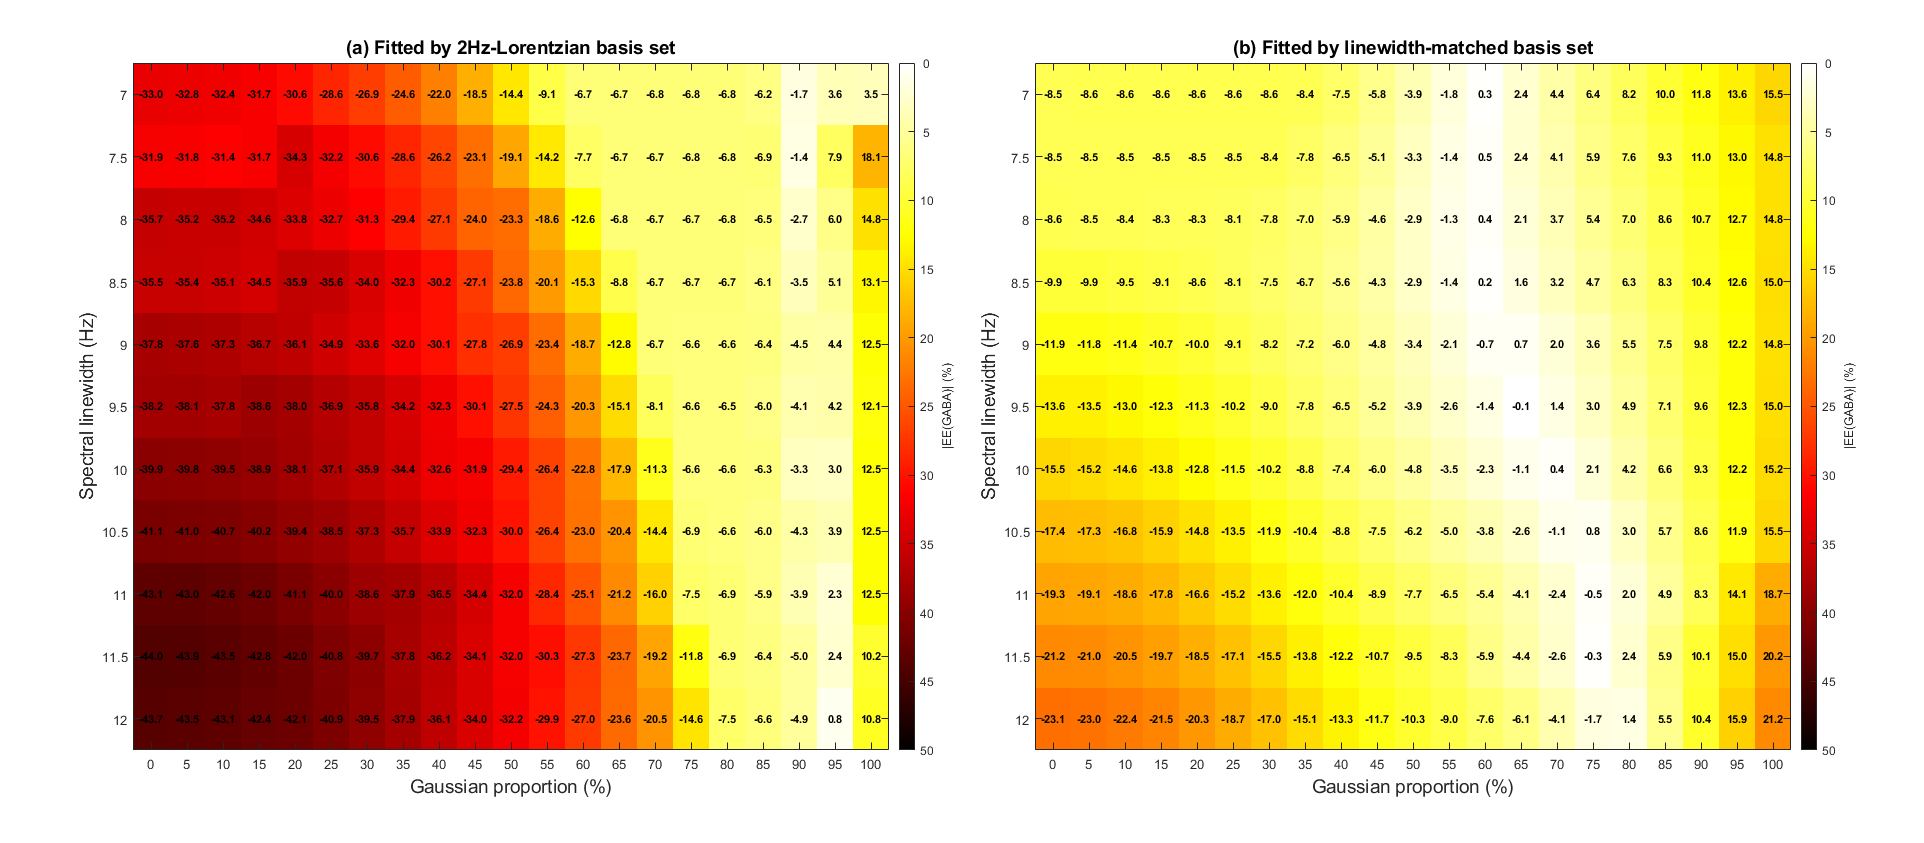
Figure 2: The EEs of GABA using simulated 1H MR spectra with various Voigt lineshapes and linewidths. The synthesized spectra contain the following: ascorbate, alanine, aspartate, creatine, phosphocreatine, glucose, glutamine, glutamate, glutathione, glycerolphosphorylcholine, phosphorylcholine, myo-inositol, lactate, N-acetylaspartate, N-acetylaspartylglutamate, phosphorylethanolamine, scyllo-inositol, taurine, γ-Aminobutyric acid, glycine, and macromolecules. (a) Fitted by a 2Hz-Lorentzian basis set. (b) Fitted by the linewidth-matched basis sets.
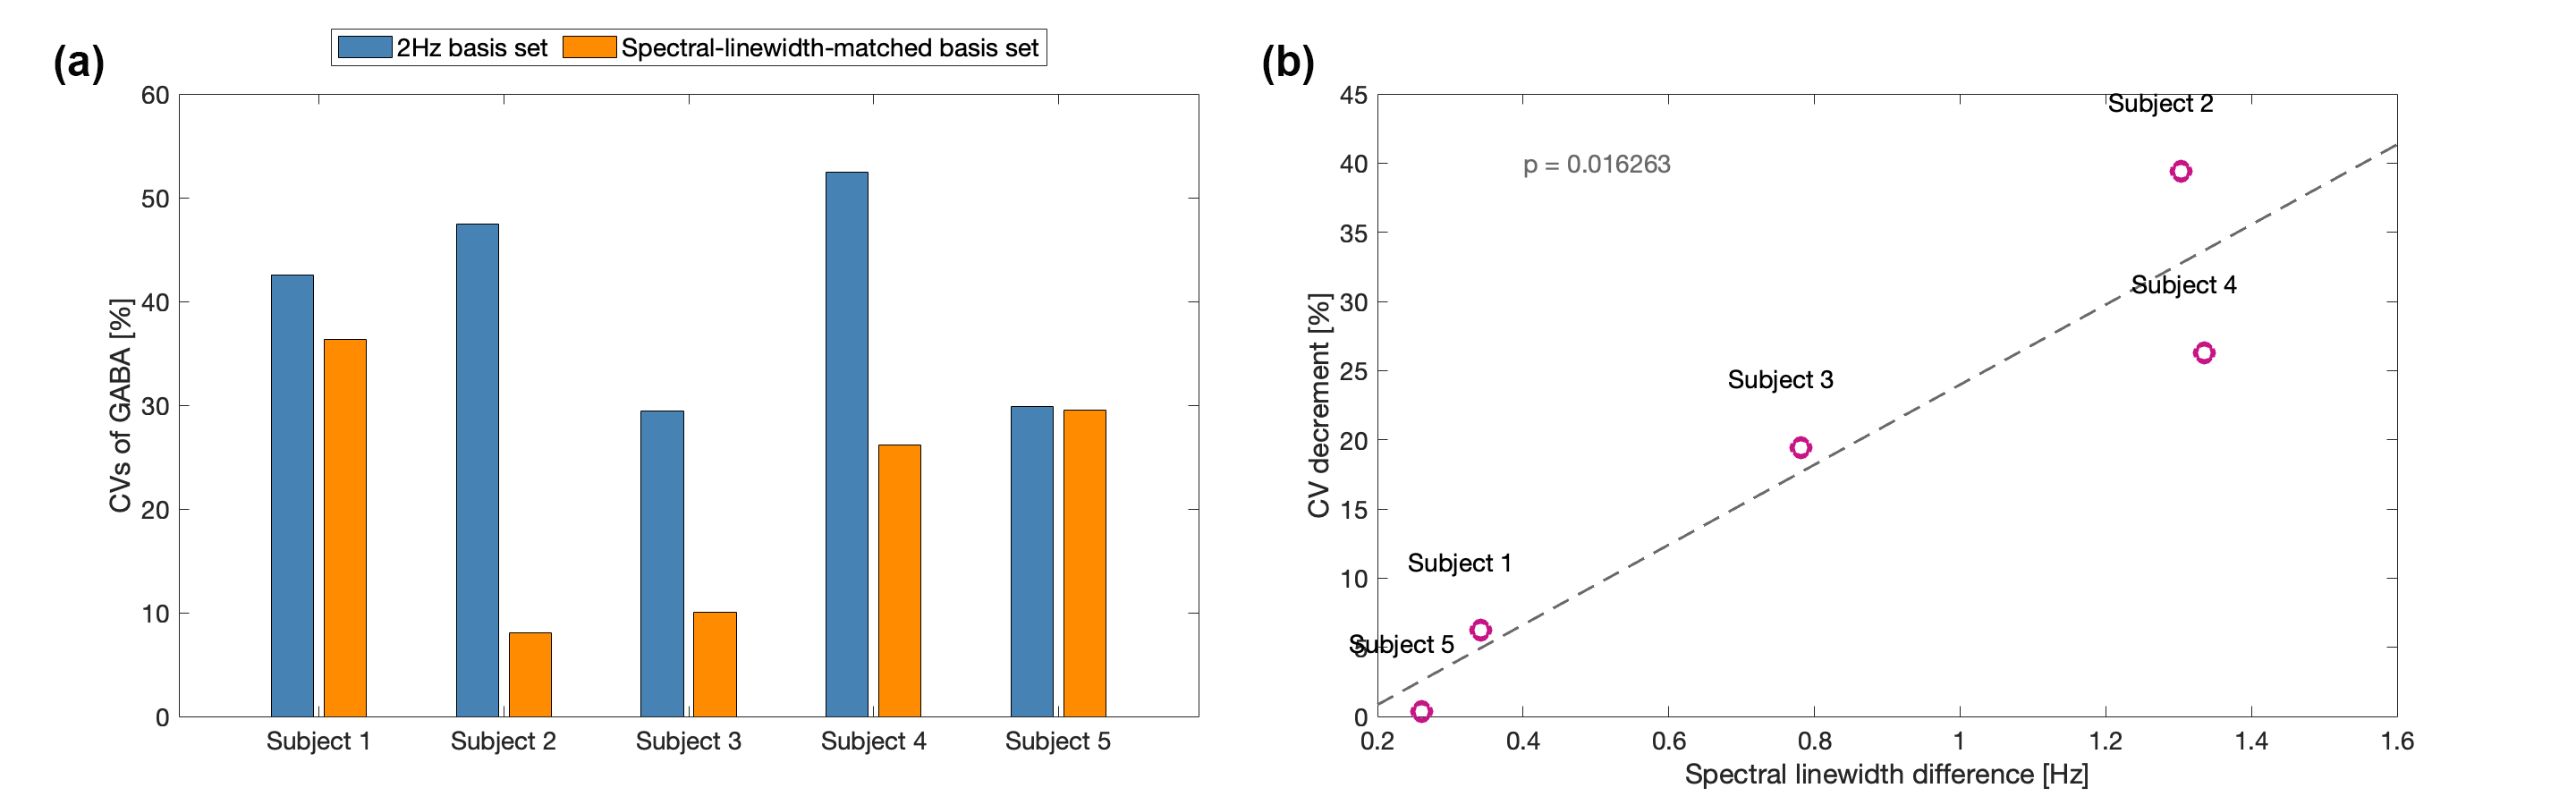
Figure 3: Reproducibility of GABA quantification from in vivo short-TE 1H spectra. (a) the CVs of two measurements for each subject when using a basis set with 2Hz linewidth and a basis set with matched linewidth. The Lorentzian shape was used for both basis sets. (b) the decrement of CVs versus the linewidth difference of two scans when using the spectral-linewidth-matched basis sets compared with the 2Hz-Lorentzian basis set. The use of linewidth-matched basis sets reduced the CVs resulting from the difference in spectral linewidth.