3944
Comparison of FAST(EST)MAP and BOLERO shimming for single voxel spectroscopy at 7T1Radiology, University of Missouri Columbia, columbia, MO, United States, 2Resonance Research Inc., Billerica, MA, United States
Synopsis
Keywords: Data Acquisition, Spectroscopy, shimming
Because of the small volumes (2 to 15cc) used in single voxel spectroscopy (SVS), field inhomogeneities over such voxels are thought to be well managed by low order shim methods, e.g., FAST(EST)MAP using 1st-2nd spherical harmonic shim terms. In this report performed at 7T (Siemens Terra) we evaluate SVS from a key region of interest (prefrontal cortex PFC) with FAST(EST)MAP in comparison with Bolero shimming, a method that specifically manages high order shim terms. High accuracy field maps and LCModel analysis of STEAM spectroscopy are evaluated.Introduction
FAST(EST)MAP is a well established shim method1,2 for single voxel (SV) shimming that acquires susceptibility encoded bars across the voxel to determine its 1st and 2nd order spherical harmonic inhomogeneities. Given that the complexity of the field variation in small voxels is thought to be correctable by up to 2nd order spherical harmonic geometries, FAST(EST)MAP is commonly used for spectroscopic studies. However while the field variation can be low in the central parietal, occipital brain regions, it is very complex for other regions e.g., the inferior anterior frontal lobe where susceptibility effects. We previously developed a high accuracy field mapping strategy based on a multi-echo susceptibility encoding which models the shim corrections with high order spherical harmonic terms3,4 (Bolero analysis). Implemented with a very high order shim (VHOS, Resonance Research Inc.) insert, this method has been used to reliably shim large volumes at 3T and 7T (whole brain and spectroscopic imaging slabs5,6).In this comparison, we hypothesize that even within a SV 20x20x20mm3 voxel size, sizable field complexity is present, particularly in regions such as the prefrontal cortex PFC. FAST(EST)MAP and Bolero strategies are compared using high accuracy field maps4 to measure and shim the field for SV spectroscopy in two key brain regions, the PFC and hippocampus HC. SV spectra are acquired and curve fit with LCModel7,8 for comparison.
Methods
Studies were performed with a Siemens 7T Terra in pTx mode with a 8x2 transceiver array, RF shimming performed over the whole brain. Both FAST(EST)MAP and Bolero shimming were initiated with the same whole brain starting position. FAST(EST)MAP was implemented using 5 iterations (1x linear, 3x linear 6 and 1x full 6). To match the shim hardware, the multi-echo Bolero was also performed with 1st-2nd order shimming using two field map acquisitions (i.e., one iteration). Equivalent data were also acquired but with 1st-4th order shimming using a very high order shim VHOS insert in a separate group of subjects. The amount of time needed for both FAST(EST)MAP and Bolero shimming was each ~4min. For all shim conditions, additional verification B0 maps were acquired.Fig. 1A shows the typical location for study. SV STEAM acquisitions were used to assess spectral performance, acquired at TR/TE/TM of 6sec/8ms/32ms, TA 3m39s. With the transceiver’s B1+ homogeneity at 10-15% over the entire brain9, no additional RF optimization was used for the STEAM acquisition. The duration of the hsinc excitation pulse was 2.2msec and the applied bandwidth of water suppression 190Hz. Data were analyzed with LCModel using the basis sets and parameters as described8.
Results
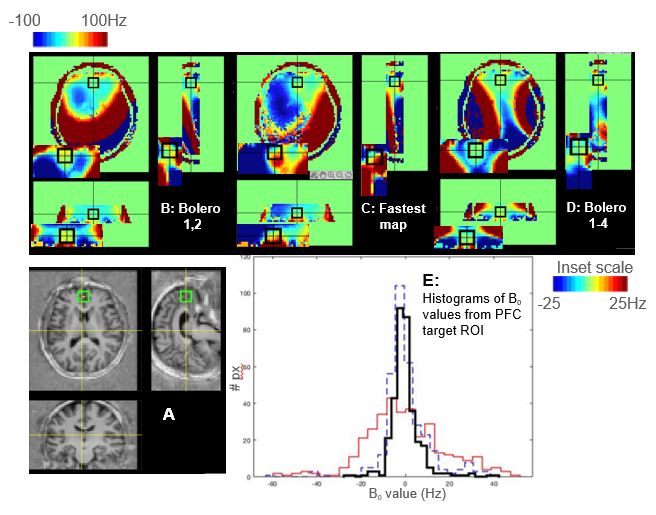
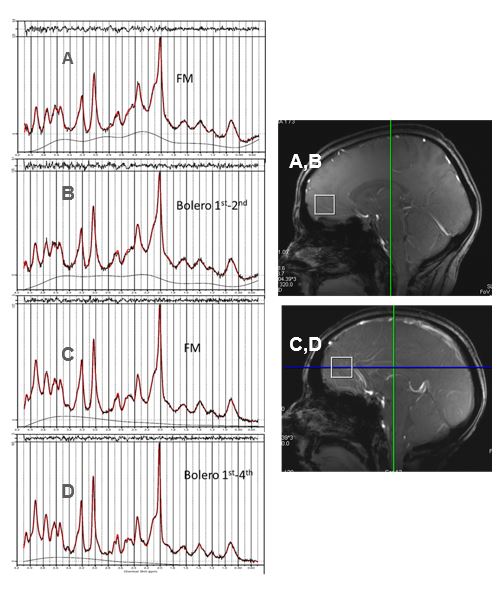
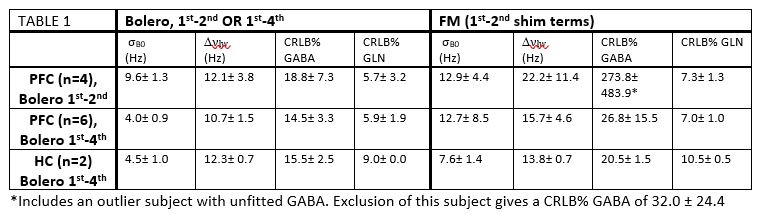
Fig. 1B-E show map data from the PFC voxel from a control subject. Not surprisingly, the field maps after Bolero (1st–2nd; 1st–4th order Fig. 1B,D) and FAST(EST)MAP (Fig. 1C) shimming show large field distortion over the non-targeted regions. Closer examination of the field within the targeted region after shimming shows there remains high order field variation, which is more evident after 1st-2nd shimming, either Bolero or FASTESTMAP (Fig. 1E) compared to the 1st-4th order shimmed maps. Histograms of the residual field values show the substantially wider distribution remaining after shimming with FAST(EST)MAP and Bolero 1st-2nd compared with Bolero 1st-4th.Fig. 2A-D show the curve-fitted PFC spectra; the results are summarized in Table 1 with σB0 and ΔνLW, CRLB values for GABA and Glutamine GLN. Even with these small group sizes, the GLN CRLB is significantly smaller (p<0.05) for Bolero 1st-4th group compared with the FAST(EST)MAP group. These data show that the PFC is very challenging for shimming and appears to benefit from the advanced shimming with Bolero mapping with or without high order shims.
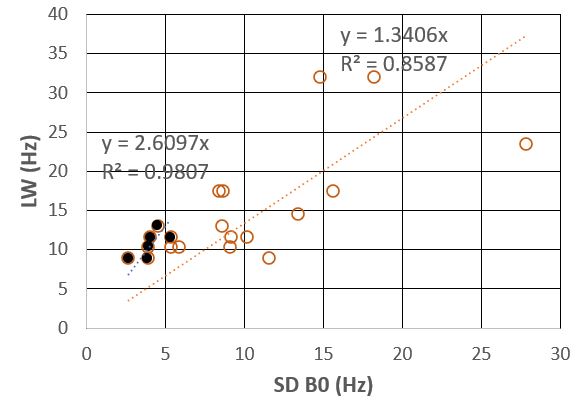
An additional observation from these data is seen in the relationship between the σB0 and ΔνLW. There is a a significant regression between these parameters, which is not surprising (combining all data from the PFC, R2 = 0.50, p<0.001, Fig. 3). It is known that the linewidth Dνlw is a result of integration and fit of signal over the entire voxel, which reflects the distribution of field inhomogeneity σB0. With the residual inhomogeneity commonly modeled a gaussian distribution with σB0, the fitted linewidth as defined by the FWHM of the gaussian modeled field is ΔνLW = 2.35*σB0. In these data, the proportionality is seen more clearly in the Bolero 1st-4th order shimmed case (Fig. 3). The basis for this observation can be seen from a histogram plot (Fig. 2E) where the field distribution is much better described by a single gaussian in the 1st-4th order shimmed data.
Discussion/Conclusions
Comparison of FASTESTMAP with Bolero shim strategies shows improvements for ΔνLW and CRLB values in the PFC. For Bolero, this shim analysis was performed with a single iteration (predominantly for linear terms), with good agreement between predicted and achieved σB0. Finally, it is recognized that the optimization in Bolero is based on a single valued least squares minimization. As such, with the optimization of the high degree shim fields, the remaining field in the PFC appears to be describable as a single gaussian thus allowing the curve fitting to proceed with a single lineshape which should be of importance for analysis and spectral quality.Acknowledgements
This work supported by NIH R01 EB024408References
1. Gruetter R. Automatic, localized in vivo adjustment of all first- and second-order shim coils. Magn Reson Med. 1993 Jun;29(6):804-11. doi: 10.1002/mrm.1910290613. PMID: 8350724.
2. Juchem C, Cudalbu C, de Graaf RA, Gruetter R, Henning A, Hetherington HP, Boer VO. B0 shimming for in vivo magnetic resonance spectroscopy: Experts' consensus recommendations. NMR Biomed. 2021 May;34(5):e4350. doi: 10.1002/nbm.4350. Epub 2020 Jun 28. PMID: 32596978.
3. Pan JW, Lo KM, Hetherington HP. Role of very high order and degree B0 shimming for spectroscopic imaging of the human brain at 7 tesla. Magn Reson Med. 2012 Oct;68(4):1007-17. doi: 10.1002/mrm.24122. Epub 2011 Dec 28. PMID: 22213108; PMCID: PMC3323711.
4. Hetherington HP, Chu WJ, Gonen O, Pan JW. Robust fully automated shimming of the human brain for high-field 1H spectroscopic imaging. Magn Reson Med. 2006 Jul;56(1):26-33. doi: 10.1002/mrm.20941. PMID: 16767750.
5. Tal A, Zhao T, Schirda C, Hetherington HP, Pan JW, Gonen O. Fast, regional three-dimensional hybrid (1D-Hadamard 2D-rosette) proton MR spectroscopic imaging in the human temporal lobes. NMR Biomed. 2021 Jun;34(6):e4507. doi: 10.1002/nbm.4507. Epub 2021 Mar 23. PMID: 33754420; PMCID: PMC8122085.
6. Pan JW, Duckrow RB, Gerrard J, Ong C, Hirsch LJ, Resor SR Jr, Zhang Y, Petroff O, Spencer S, Hetherington HP, Spencer DD. 7T MR spectroscopic imaging in the localization of surgical epilepsy. Epilepsia. 2013 Sep;54(9):1668-78. doi: 10.1111/epi.12322. Epub 2013 Jul 29. PMID: 23895497; PMCID: PMC3938332.
7. Provencher SW. Automatic quantitation of localized in vivo 1H spectra with LCModel. NMR Biomed. 2001 Jun;14(4):260-4. doi: 10.1002/nbm.698. PMID: 11410943.
8. Marjańska M, McCarten JR, Hodges J, Hemmy LS, Grant A, Deelchand DK, Terpstra M. Region-specific aging of the human brain as evidenced by neurochemical profiles measured noninvasively in the posterior cingulate cortex and the occipital lobe using 1H magnetic resonance spectroscopy at 7 T. Neuroscience. 2017 Jun 23;354:168-177. doi: 10.1016/j.neuroscience.2017.04.035. Epub 2017 May 3. PMID: 28476320; PMCID: PMC5516630.
9. Li X, Pan JW, Avdievich NI, Hetherington HP, Rispoli JV. Electromagnetic simulation of a 16-channel head transceiver at 7 T using circuit-spatial optimization. Magn Reson Med. 2021 Jun;85(6):3463-3478. doi: 10.1002/mrm.28672. Epub 2021 Feb 3. PMID: 33533500; PMCID: PMC8124020.
Figures