3940
A Case Study Analysis on Monte Carlo-Simulated Uncertainty Propagation in Absolute Quantification for in vivo 1H-MRS of the Human Brain1Biomedical Engineering, Columbia University, New York, NY, United States, 2Radiology, Columbia University, New York, NY, United States
Synopsis
Keywords: Data Analysis, Spectroscopy, Brain, 1H-MRS, Quantification
The effect of uncertainty propagation for absolute quantification performed on individual single-voxel in vivo 1H-MRS experiments has yet to be examined. In this case study, we conduct an uncertainty analysis using Monte Carlo simulations on two previously published studies with reported absolute concentrations of metabolites and macromolecules, each employing different field strengths, relative linewidths and internal references (e.g. total creatine, tissue-specific water). The uncertainty from 8 in vivo spectra is simulated and compared to CRLBs from Linear Combination Modeling. A multifold uncertainty increase is observed in both metabolites and macromolecules across datasets, demonstrating that the CRLB systematically overestimates quantification precision.Introduction
In vivo proton magnetic resonance spectroscopy (1H-MRS) is a versatile technique for non-invasively measuring the metabolic content of a localized region of the brain. Absolute quantification is the standard method to translate signal amplitudes from arbitrary to absolute units using an internal reference of known (or assumed) concentration, such as water or creatine (tCr)1. The Cramér Rao Lower Bound (CRLB) is commonly reported as a proxy for standard deviation2. Our previous study demonstrated that concentration precision is systematically overestimated if correction factor uncertainties are ignored3. However, the analytical framework of Gaussian error propagation provides no information on the output distribution, and the impact of parameter uncertainty on quantification has yet to be demonstrated in individual in vivo 1H-MRS experiments, which may employ different reference signals, sequences, voxel sizes or subject populations. In this study, we perform an uncertainty analysis using Monte Carlo simulations4–6, and subsequently use this technique to determine the extent to which this effect is observed in two previously published 1H-MRS studies.Methodology
The uncertainty of metabolite or macromolecule concentration $$$C_m$$$ is measured from a distribution of simulated absolute concentrations. A total of N=106 normally distributed random values are generated for each quantification parameter, where the reported value and uncertainty are set as the distribution’s mean and standard deviation, respectively. Absolute quantification is then performed, and the coefficient of variation (CV) of the output distribution is used to estimate the propagated uncertainty.This method is used in multiple scenarios. First, to establish hypothetical bounds of the added effect of parameter uncertainties by metabolite, using previously aggregated literature values3. Second, to calculate and compare the uncertainty to the CRLB from a representative subset of spectra from two studies: a case-control study by Swanberg et al. in 2021 on multiple sclerosis at 7T7, and a 2020 study by Landheer et al. measuring the concentration of macromolecules at 3T8. Both experiments utilized absolute quantification, although each used different internal references. Landheer et al. used a tissue-specific water reference to calculate macromolecule concentration $$$C_{m,water}$$$,
$$C_{m,water}=\frac{A_m}{S_w(1-f_{CSF})}\cdot\frac{e^{\frac{TE}{T_{2,m}}}}{D(T_{1,m})}\cdot \sum_{i=1}^{3}\frac{f_i\cdot{D(T_{1w,i})}}{{e^{\frac{TE}{T_{2w,i}}}}}\cdot{C_{w,i}},[1]$$
where $$$A_m$$$ is the estimated amplitude scaling factor evaluated at $$$TE=0$$$ for macromolecules, $$$S_w$$$ is the signal water reference, $$$C_{w,i},f_i$$$ are the absolute water concentration and fractional estimates of grey matter, white matter and CSF, respectively, and $$$T_{1w,i}$$$, $$$T_{2w,i}$$$ are the tissue-specific relaxation rates of water. Partial longitudinal relaxation correction $$$D(T_{1,m})$$$ was included for metabolites and excluded for quantification of macromolecules. The Swanberg study used a 10mM tissue-specific tCr reference to estimate metabolite concentration $$$C_{m,tCr}$$$, although in this analysis, quantification was performed assuming homogenous tissue composition,
$$C_{m,tCr}=\frac{A_m}{S_{tCr}}\cdot\frac{D(T_{1,Cr})}{D(T_{1,m})}\cdot\frac{ e^{-\frac{TE}{T_{2,Cr}}}}{ e^{-\frac{TE}{T_{2,m}}}}\cdot{C_{tCr}},[2]$$
where $$$S_{tCr}$$$ is the signal tCr reference, $$$D(T_{1,Cr}),D(T_{1,m})$$$ are correction factors for partial longitudinal relaxation, and $$$C_{tCr}$$$=10mM.
Spectral quantification is performed in INSPECTOR9,10 on 6 subjects and 2 healthy volunteers of varying spectral quality from the Swanberg and Landheer studies, respectively. The original basis sets from both experiments were used for Linear Combination Modeling (LCM), and the resulting fits and CRLBs served as inputs for subsequent Monte Carlo simulations. The uncertainty is calculated for two metabolites and macromolecules: Glutamate (Glu), tNAA (NAA+NAAG), M0.92, and M2.04.
Results and Discussion
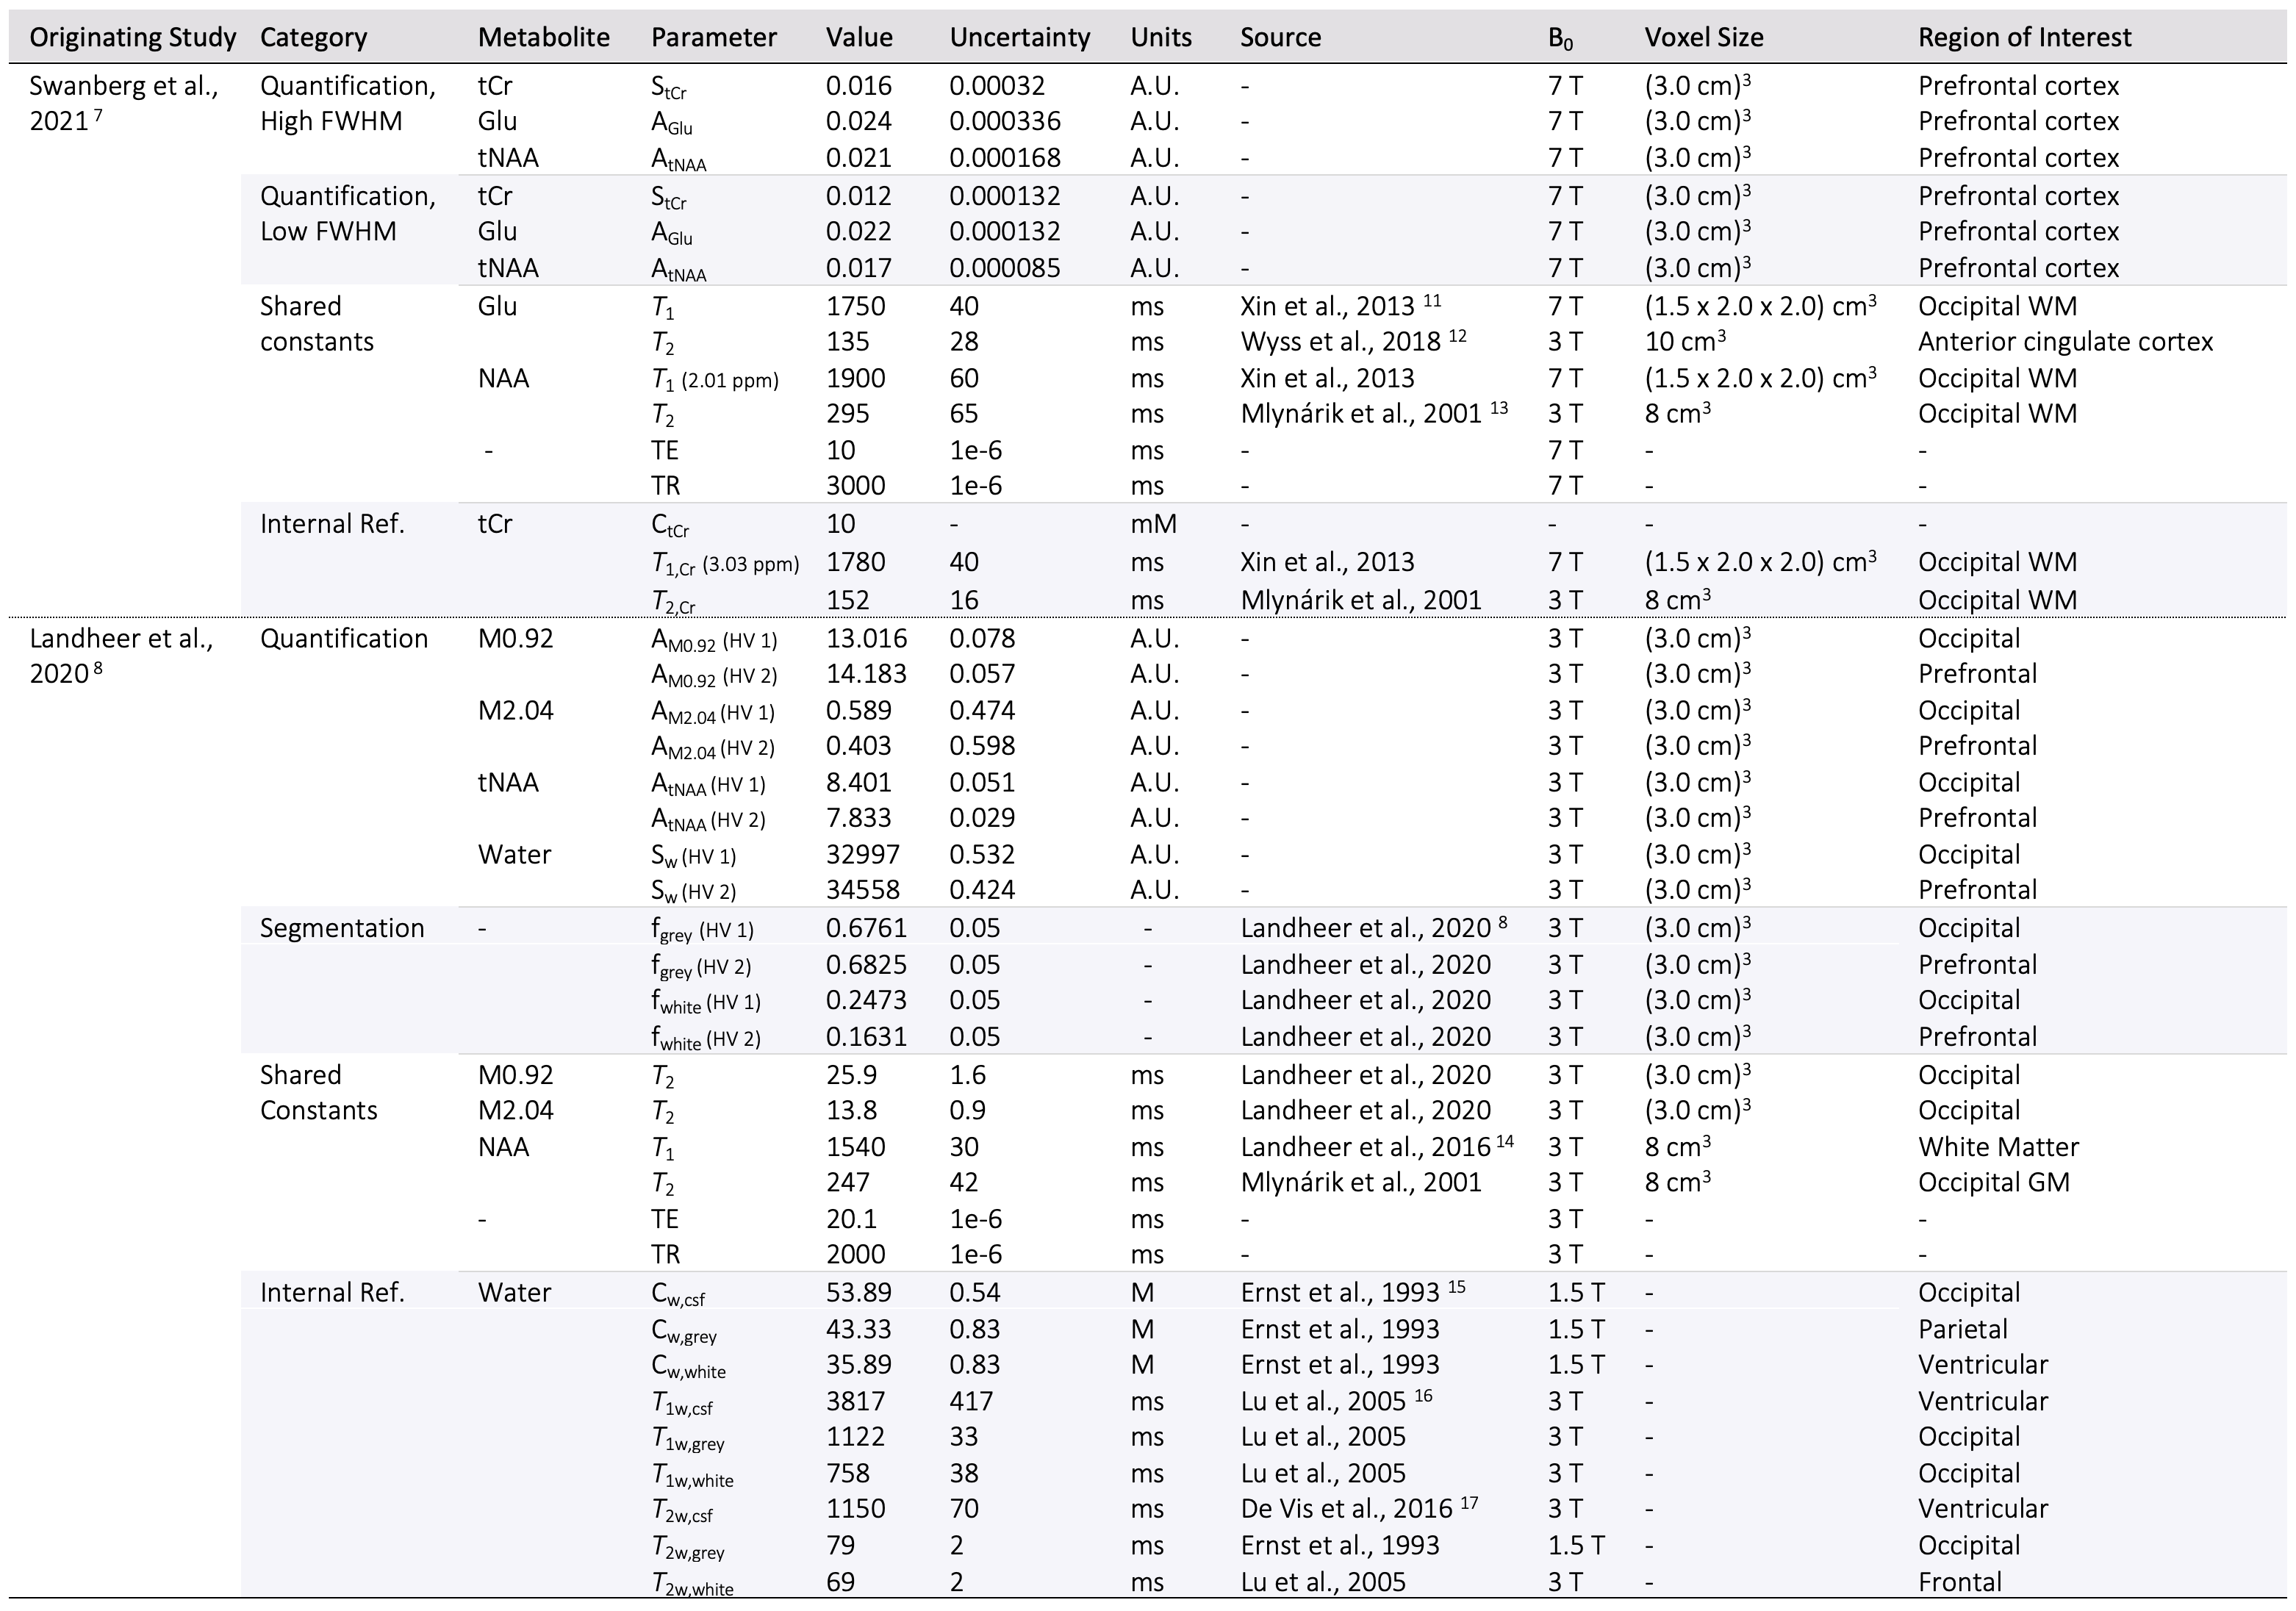
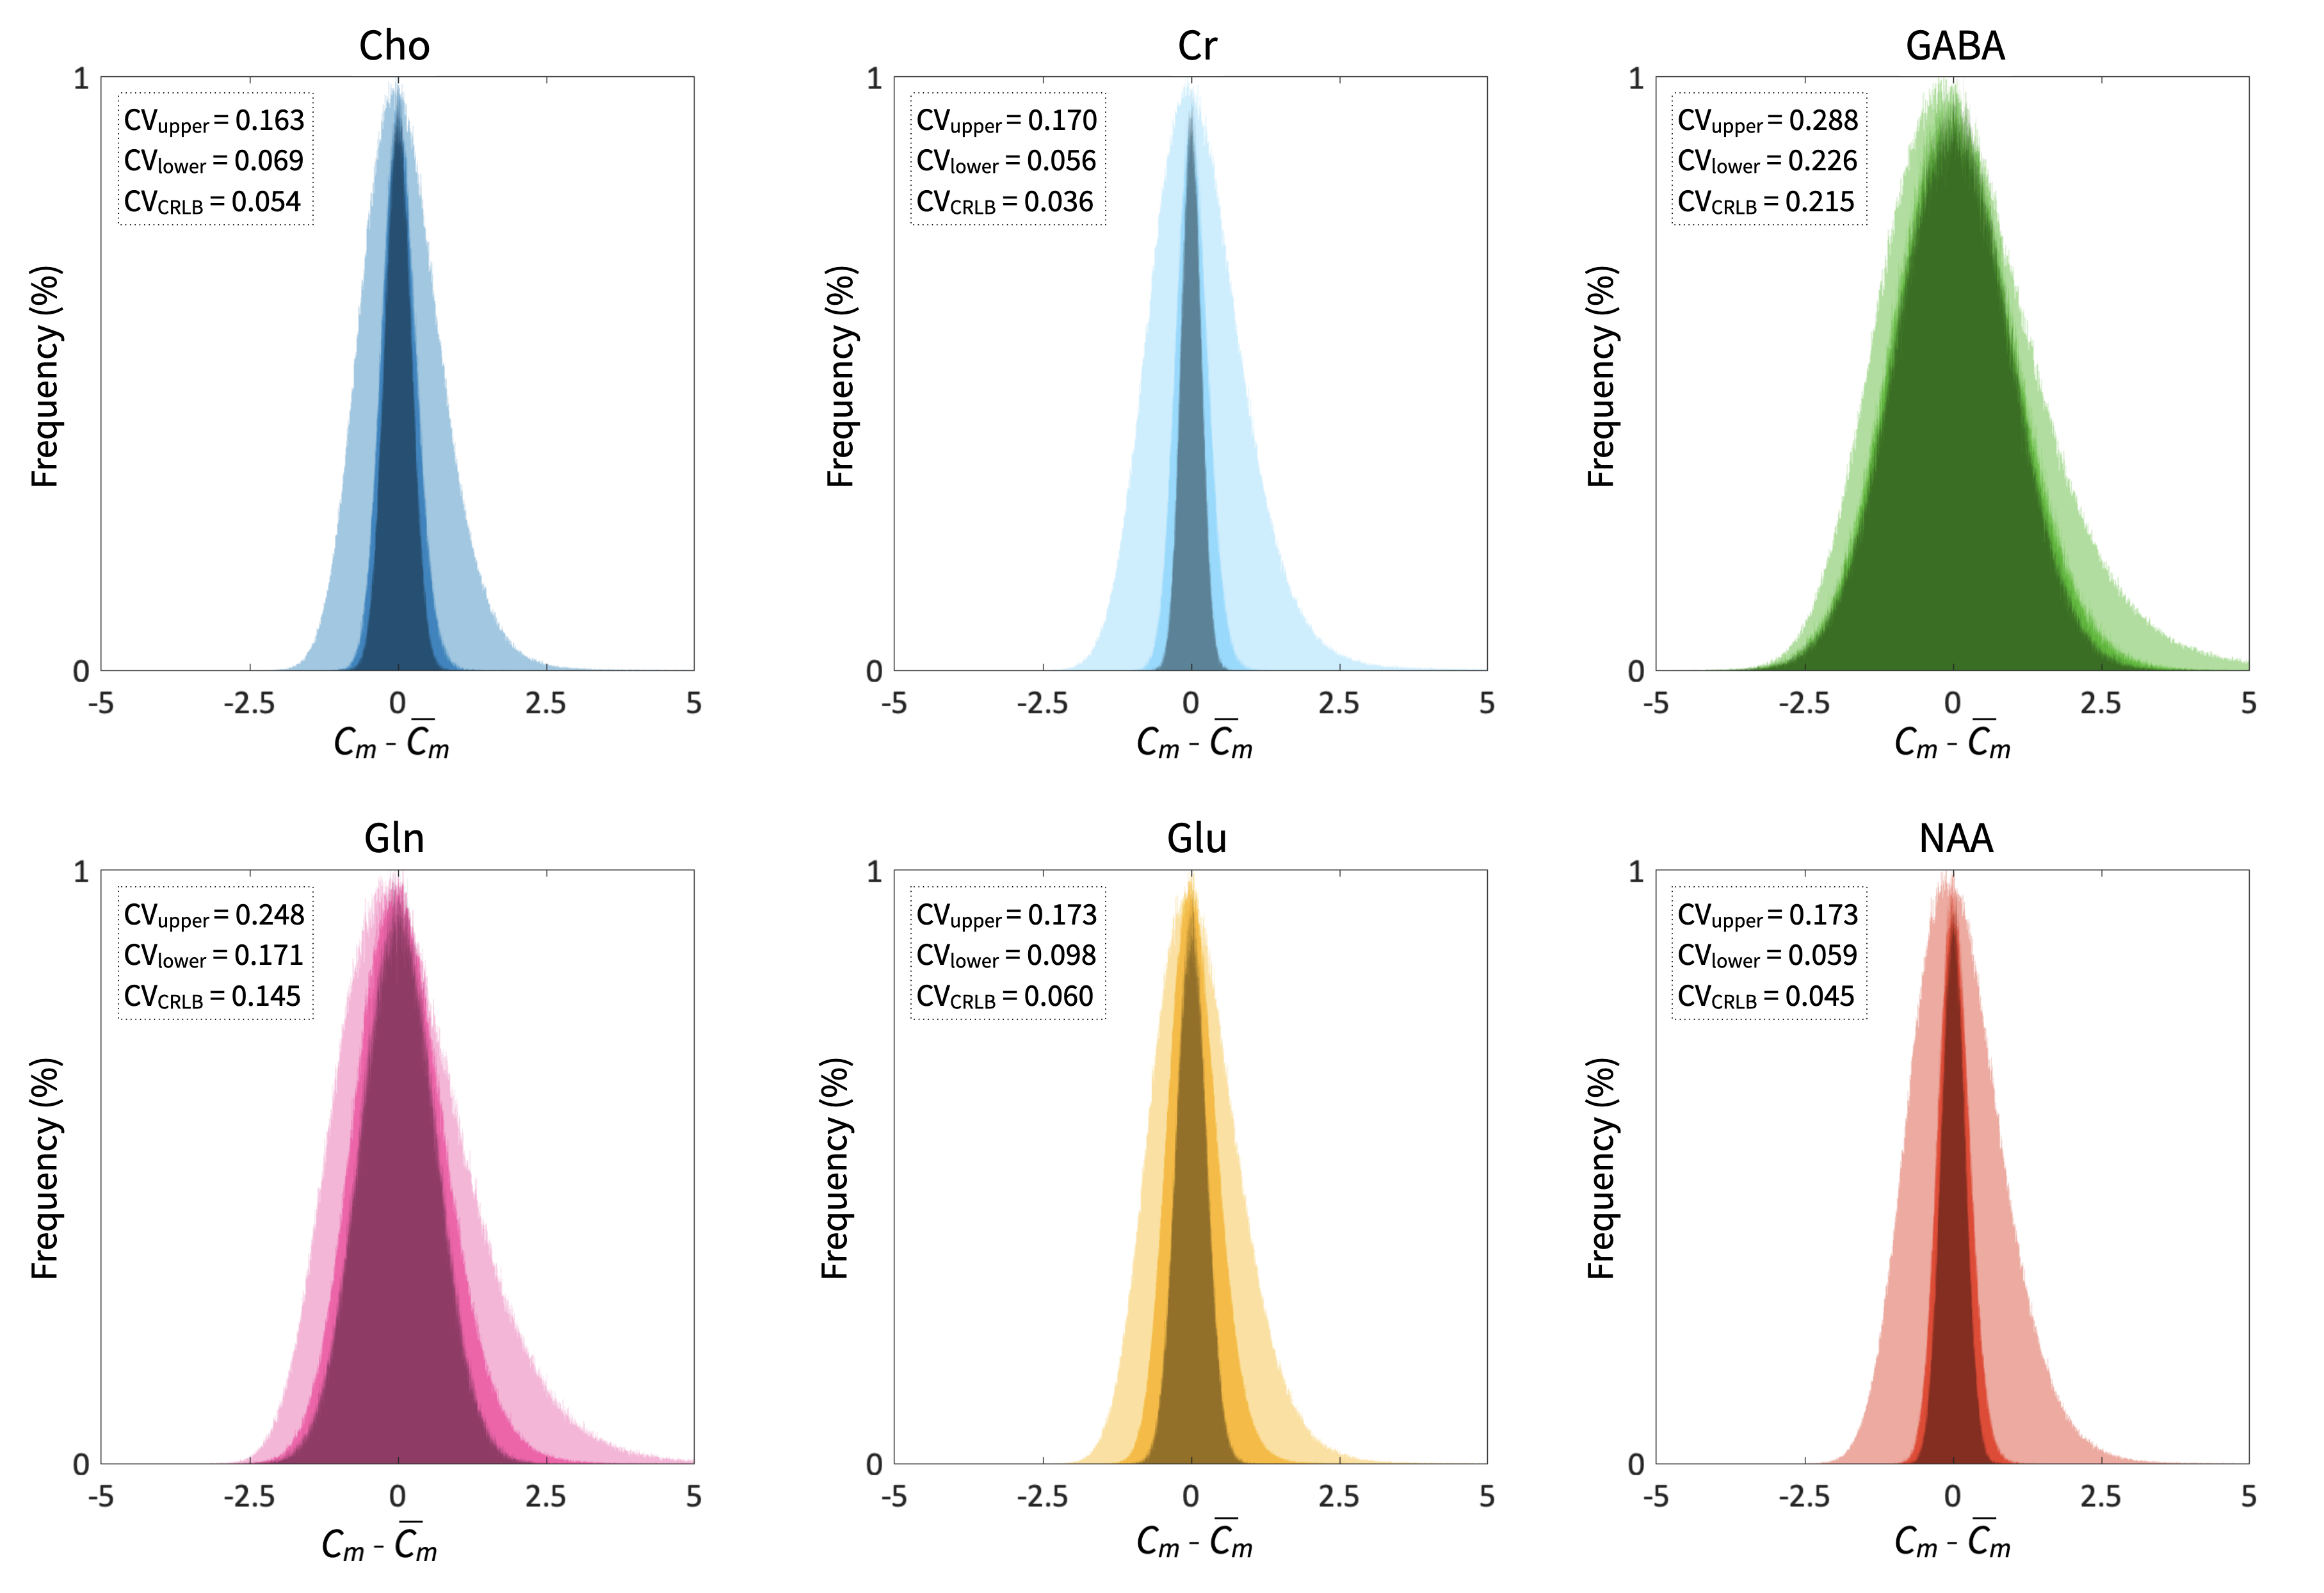
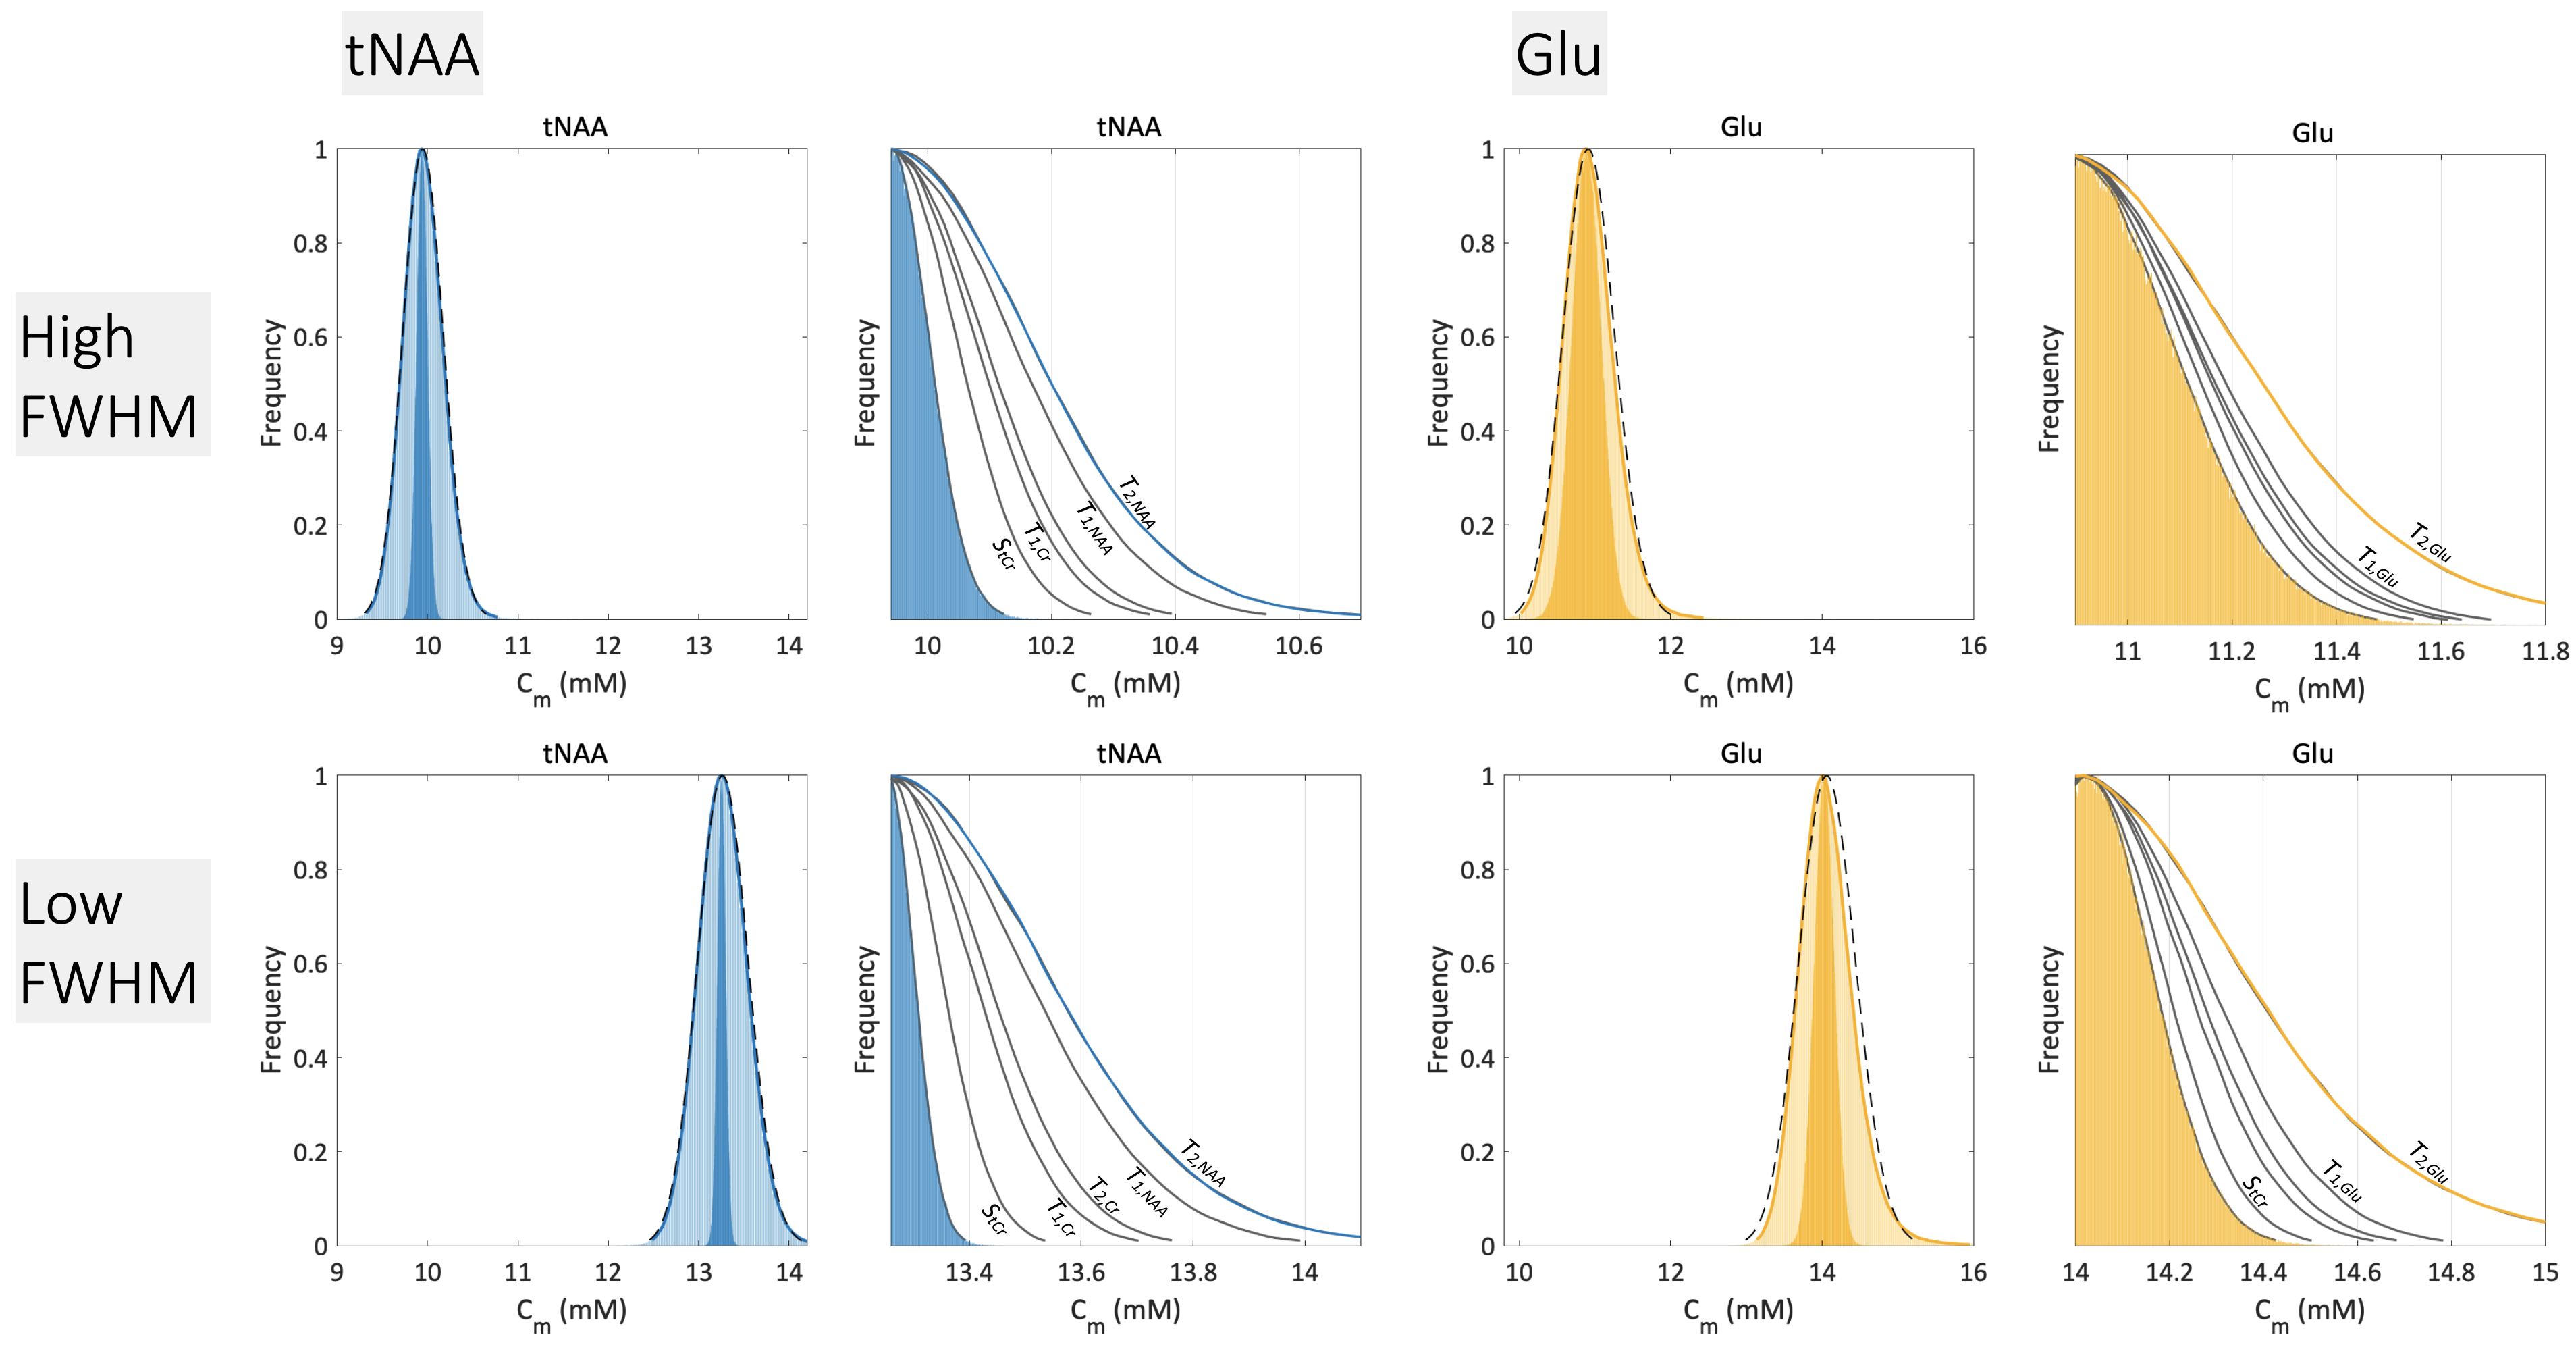
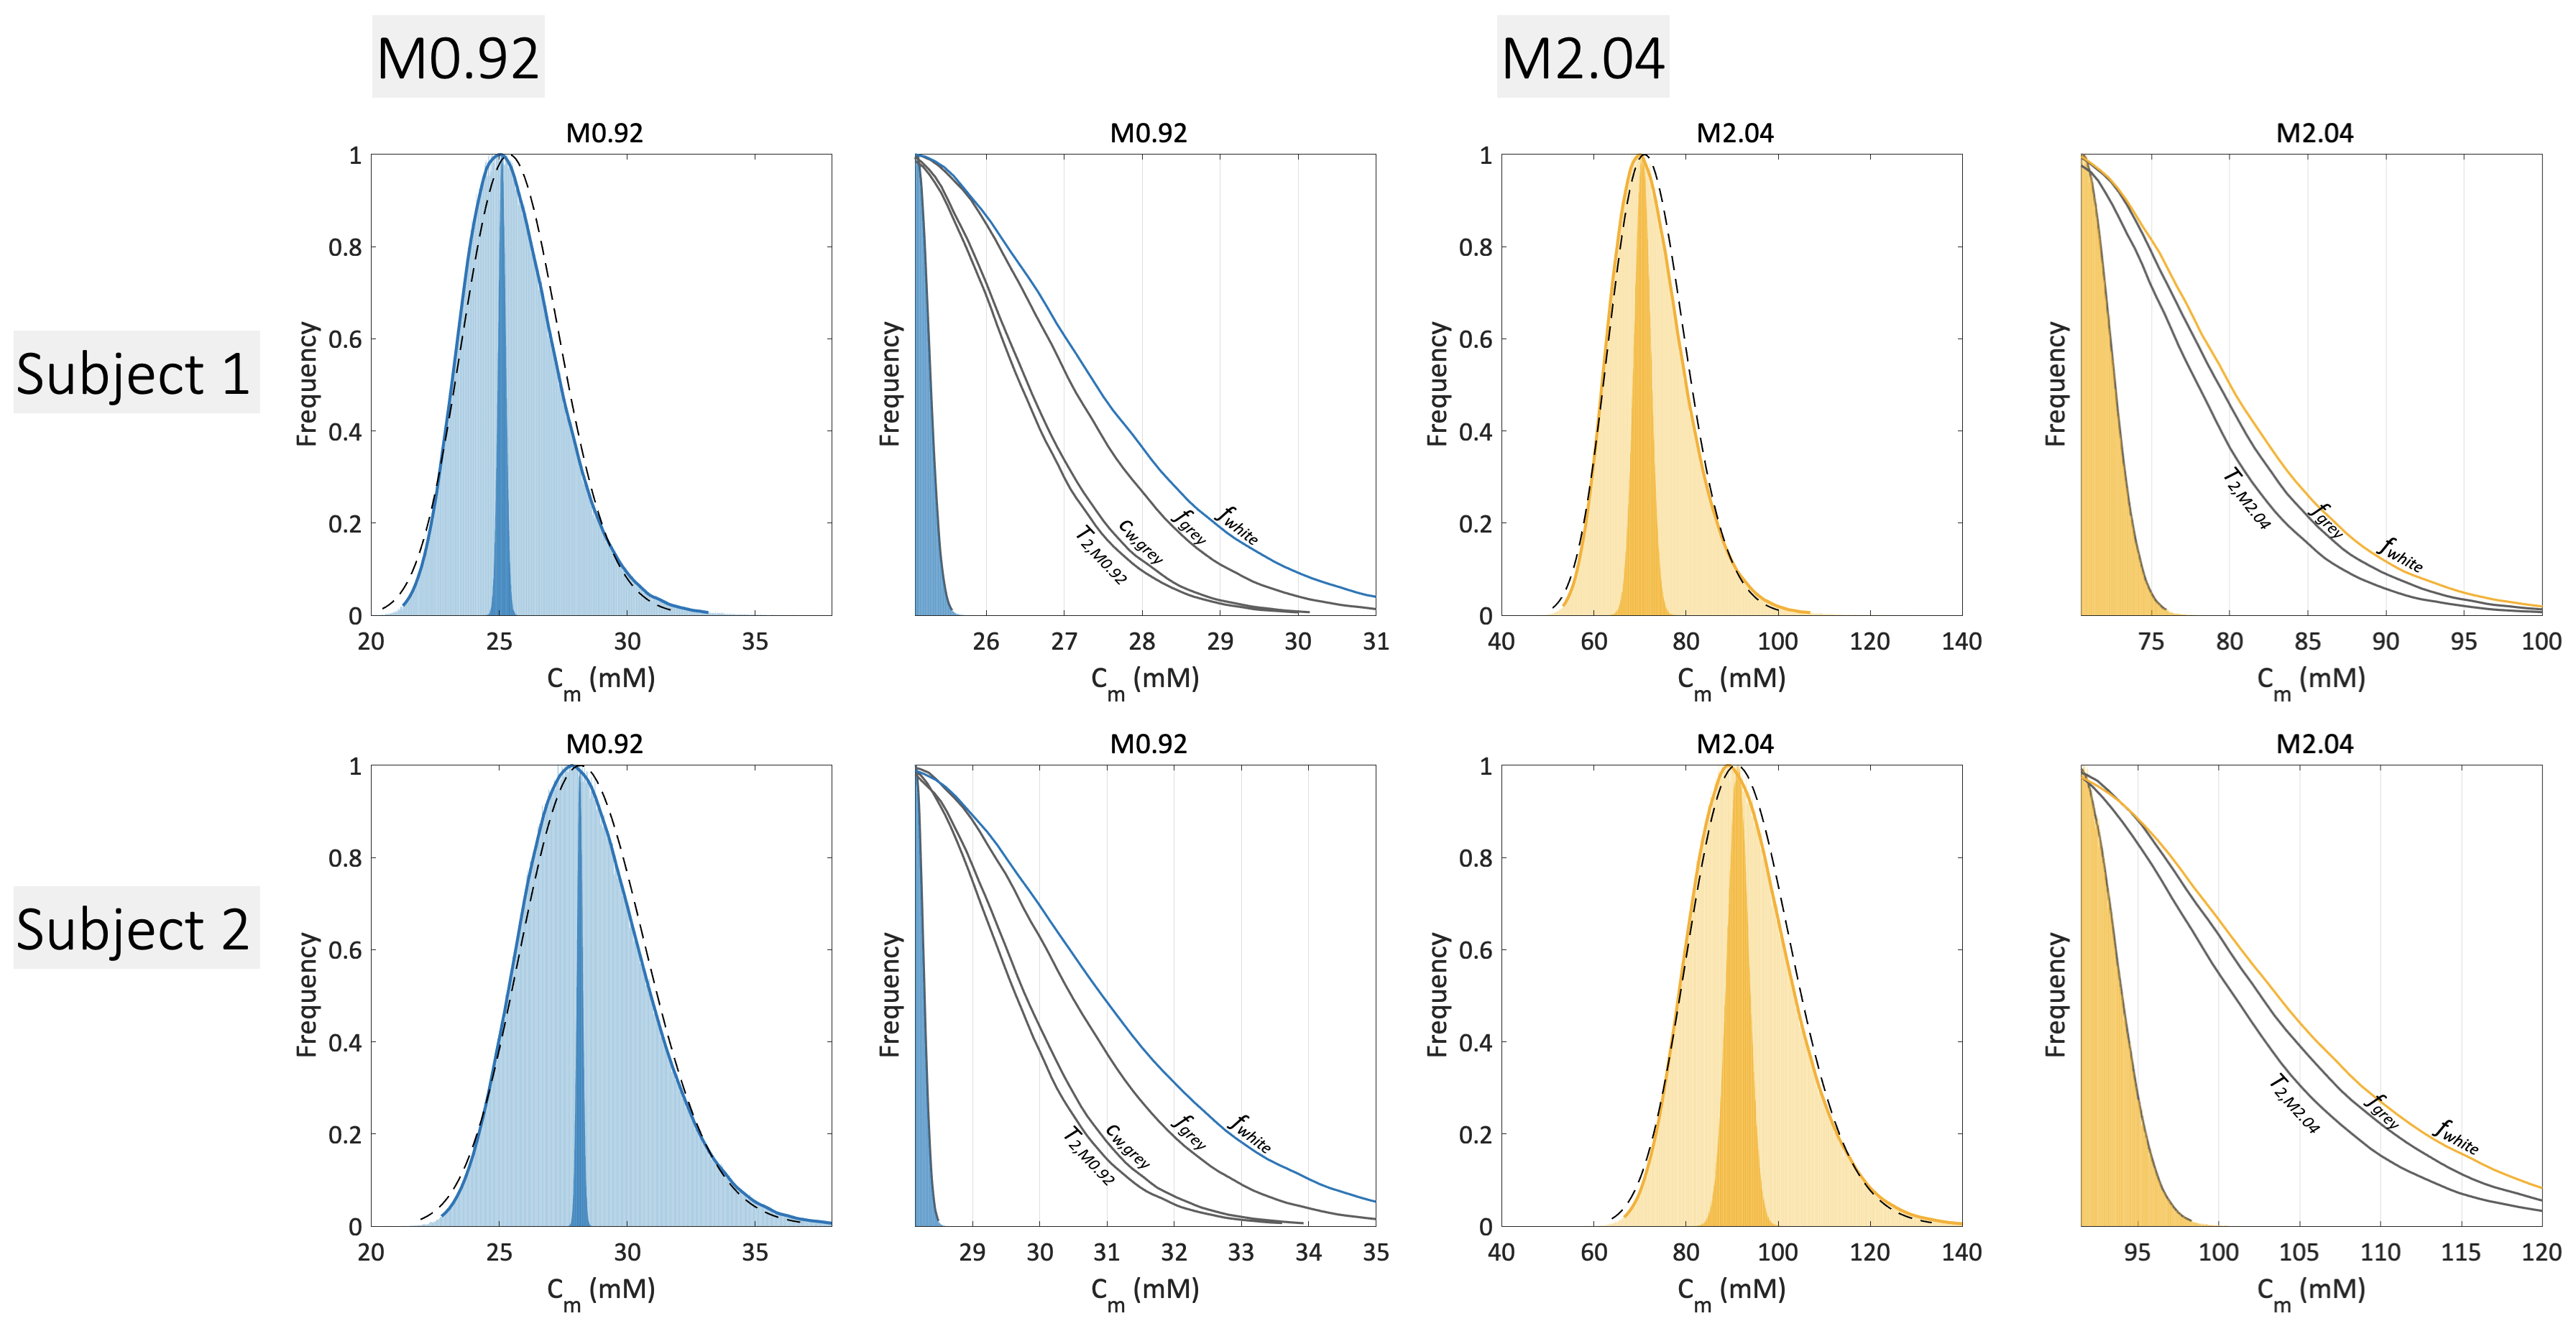
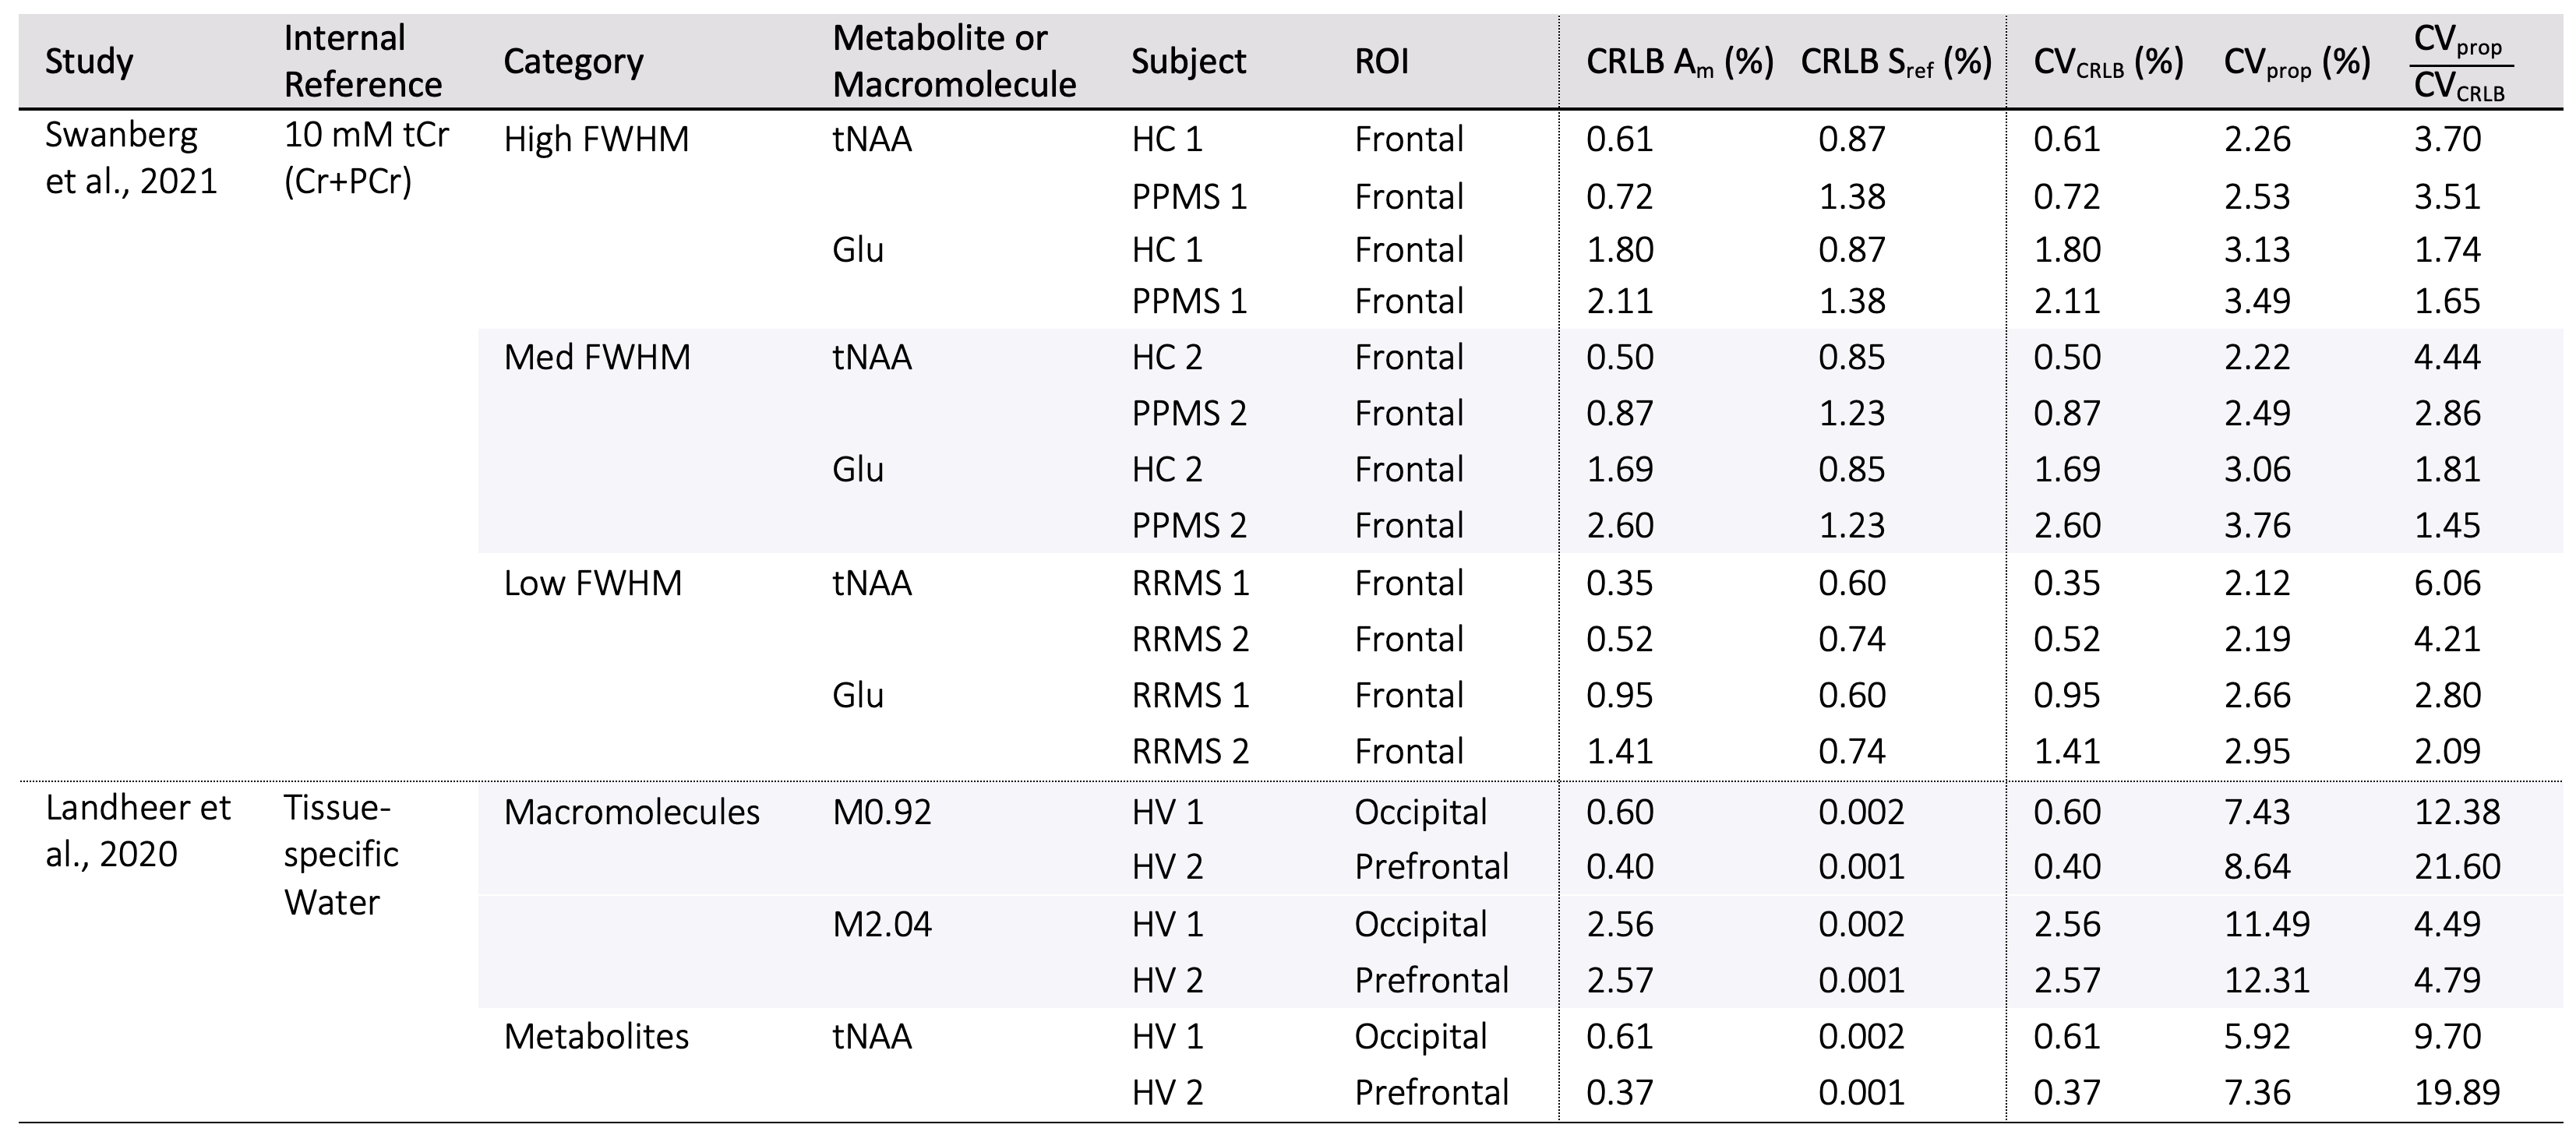
A summary of simulation parameters, including LCM fits, CRLBs, tissue-composition, and correction factor constants is tabulated in Figure 1.7,8,11–17 Constants were chosen from literature, while uncertainties of sequence-specific parameters (TE,TR) and $$$f_i$$$ are conservatively set to 1ns and 5%18, respectively. A hypothetical range of distributions simulated using equation [1] is plotted in Figure 2. Distributions from a single reported metabolite CRLB, and from sets of low and high metabolite-specific uncertainties are superimposed for comparison, with overall uncertainties as high 28.8% for GABA, and more than a threefold increase for NAA and Cr.Simulated distributions of tNAA and Glu from two subjects in the MS study are shown in Figure 3. For a single subject with high relative linewidth, tNAA and Glu uncertainties increase multifold from 0.61% to 2.26%, and 1.8% to 3.13% after propagation, while the low linewidth case increases from 0.35% to 2.12% and 0.95% to 2.66%, respectively. Similar distributions from volunteers in the macromolecule study are shown in Figure 4, with M0.92 and M2.04 uncertainties rising from 0.6% to 7.43% and 2.56% to 11.49% for subject 1, and 0.4% to 8.64% and 2.57% to 12.31% for subject 2, respectively. A summary of the analysis results, including CRLBs of the target and reference signals and resulting CVs, is provided in Figure 5.
The case study results underscore the importance of comprehensive uncertainty reporting in 1H-MRS; notably, that while the relative contribution of parameter uncertainties is lower at higher CRLBs, a non-negligible overestimation of concentration precision is observed even in cases with low spectral linewidths or at higher field strengths. Whether this type of analysis could affect population-level conclusions, especially among experiments that depend on relative CRLBs for quality assurance metrics, is not yet considered.
Conclusion
The precision of concentrations calculated using absolute spectral quantification is shown to be systematically overestimated in two in vivo 1H-MRS datasets using Monte Carlo simulations, demonstrating that metabolite CRLBs only partially contribute to the true overall quantification error. This effect is observed in both metabolites and macromolecules, and is independent of the selected internal reference signal.Acknowledgements
This work was supported by grant R01MH126133 and TL1 predoctoral training fellowship TL1TR001875 by the National Institutes of Health. A special thanks is given to Kelley Swanberg, Ph.D. for curating data for the multiple sclerosis case study, and to Karl Landheer, Ph.D. for providing helpful feedback on data from the macromolecule case study.References
1. Kreis R, Ernst T, Ross BD. Absolute Quantitation of Water and Metabolites in the Human Brain. II. Metabolite Concentrations. J Magn Reson B. 1993;102(1):9-19. doi:10.1006/jmrb.1993.1056
2. Cavassila S, Deval S, Huegen C, van Ormondt D, Graveron-Demilly D. Cramér-Rao bounds: an evaluation tool for quantitation. NMR Biomed. 2001;14(4):278-283. doi:10.1002/nbm.701
3. Instrella R, Juchem C. Error Propagation in Absolute Metabolite Quantification for MR Spectroscopy of the Human Brain. In: Proc Int Soc Magn Reson Med 2022, 5042.4.
4. Joint Committee for Guides in Metrology. Evaluation of measurement data — Supplement 1 to the “Guide to the expression of uncertainty in measurement” — Propagation of distributions using a Monte Carlo method. Published online 2008.
5. Ogilvie JF. A monte-carlo approach to error propagation. Comput Chem. 1984;8(3):205-207. doi:10.1016/0097-8485(84)80007-8
6. Lafarge T, Possolo A. The NIST Uncertainty Machine. NCSLI Meas. 2015;10(3):20-27. doi:10.1080/19315775.2015.11721732
7. Swanberg KM, Prinsen H, DeStefano K, et al. In vivo evidence of differential frontal cortex metabolic abnormalities in progressive and relapsing‐remitting multiple sclerosis. NMR Biomed. 2021;34(11). doi:10.1002/nbm.4590
8. Landheer K, Gajdošík M, Treacy M, Juchem C. Concentration and effective T2 relaxation times of macromolecules at 3T. Magn Reson Med. 2020;84(5):2327-2337. doi:10.1002/mrm.28282
9. Gajdošík M, Landheer K, Swanberg KM, Juchem C. INSPECTOR: free software for magnetic resonance spectroscopy data inspection, processing, simulation and analysis. Sci Rep. 2021;11(1):2094. doi:10.1038/s41598-021-81193-9
10. Columbia Technology Ventures, INSPECTOR. http://innovation.columbia.edu/technologies/cu17130_inspector
11. Xin L, Schaller B, Mlynarik V, Lu H, Gruetter R. Proton T1 relaxation times of metabolites in human occipital white and gray matter at 7 T. Magn Reson Med. 2013;69(4):931-936. doi:10.1002/mrm.24352
12. Wyss PO, Bianchini C, Scheidegger M, et al. In vivo estimation of transverse relaxation time constant (T2) of 17 human brain metabolites at 3T. Magn Reson Med. 2018;80(2):452-461. doi:10.1002/mrm.27067
13. Mlynárik V, Gruber S, Moser E. Proton T1 and T2 relaxation times of human brain metabolites at 3 Tesla. NMR Biomed. 2001;14(5):325-331. doi:10.1002/nbm.713
14. Landheer K, Sahgal A, Myrehaug S, Chen AP, Cunningham CH, Graham SJ. A rapid inversion technique for the measurement of longitudinal relaxation times of brain metabolites: application to lactate in high-grade gliomas at 3 T. NMR Biomed. 2016;29(10):1381-1390. doi:10.1002/nbm.3580
15. Ernst T, Kreis R, Ross BD. Absolute Quantitation of Water and Metabolites in the Human Brain. I. Compartments and Water. J Magn Reson B. 1993;102(1):1-8. doi:10.1006/jmrb.1993.1055
16. Lu H, Nagae-Poetscher LM, Golay X, Lin D, Pomper M, van Zijl PCM. Routine clinical brain MRI sequences for use at 3.0 Tesla. J Magn Reson Imaging. 2005;22(1):13-22. doi:10.1002/jmri.20356
17. De Vis JB, Zwanenburg JJ, van der Kleij LA, et al. Cerebrospinal fluid volumetric MRI mapping as a simple measurement for evaluating brain atrophy. Eur Radiol. 2016;26(5):1254-1262. doi:10.1007/s00330-015-3932-8
18. Chen HM, Chen HC, Chen CCC, et al. Comparison of Multispectral Image-Processing Methods for Brain Tissue Classification in BrainWeb Synthetic Data and Real MR Images. Bunevicius A, ed. BioMed Res Int. 2021;2021:1-12. doi:10.1155/2021/9820145
Figures