3933
Correlation Tensor Imaging Enhances Histological Differences Between Mouse Glioblastoma Subtypes1Champalimaud Research, Champalimaud Foundation, Lisbon, Portugal, 2Institute for Research & Innovation in Health (i3S), University of Porto, Porto, Portugal, 3Institute for Systems and Robotics, Department of Bioengineering, Instituto Superior Técnico, Universidade de Lisboa, Lisboa, Portugal, 4Center of Functionally Integrative Neuroscience (CFIN) and MINDLab, Department of Clinical Medicine, Aarhus University, Aarhus, Denmark, 5Department of Physics and Astronomy, Aarhus University, Aarhus, Denmark
Synopsis
Keywords: Diffusion/other diffusion imaging techniques, Diffusion/other diffusion imaging techniques
Correlation Tensor Imaging (CTI) has been recently proposed as a novel methodology for resolving kurtosis sources without relying on strong multi-gaussian component assumptions. Here, CTI is harnessed to decipher kurtosis sources in two different mouse glioblastoma subtypes. Our results reveal that CTI’s kurtosis source separation resolves the underlying microstructural differences between the glioblastoma subtypes and faithfully represents their specific histopathological features. In comparison to previous diffusion MRI approaches, CTI kurtosis maps present enhanced sensitivity towards tumor differences. These first results show the potential of CTI in providing more sensitive and specific future biomarkers for monitoring tumor progression and therapy outcome.Introduction
Diffusional Kurtosis Imaging (DKI)1 promises great potential for discriminating tumor grades2,3, but its specificity is inherently limited since multiple sources of non-gaussian diffusion contribute to the measured total diffusional kurtosis. To overcome this, advanced diffusion-weighted encoding methods have been developed for resolving two of the potential sources of diffusional kurtosis, arising from different types of diffusion variance4,5 – namely, anisotropic kurtosis (Kaniso) and isotropic kurtosis (Kiso), which are related to the microscopic anisotropy and trace variance of the diffusion tensor distributions, respectively. However, the tensor-valued approaches rely on the multiple gaussian component (MGC) assumption, which implies no diffusion time dependence or microscopic kurtosis (µK) sources. Recently, a more general framework based on double diffusion encoding (DDE)6-10 was proposed to resolve all kurtosis sources based on the information captured by Displacement Correlation Tensors11,12. The ensuing Correlation Tensor Imaging (CTI)13 quantifies not only Kaniso and Kiso, but also microscopic kurtosis (µK) effects from restricted diffusion and/or exchange, and shows great potential for characterising healthy14,15 and diseased16 tissues. Here, we apply CTI to characterize two mouse glioblastoma subtypes exhibiting different underlying microstructures.Methods
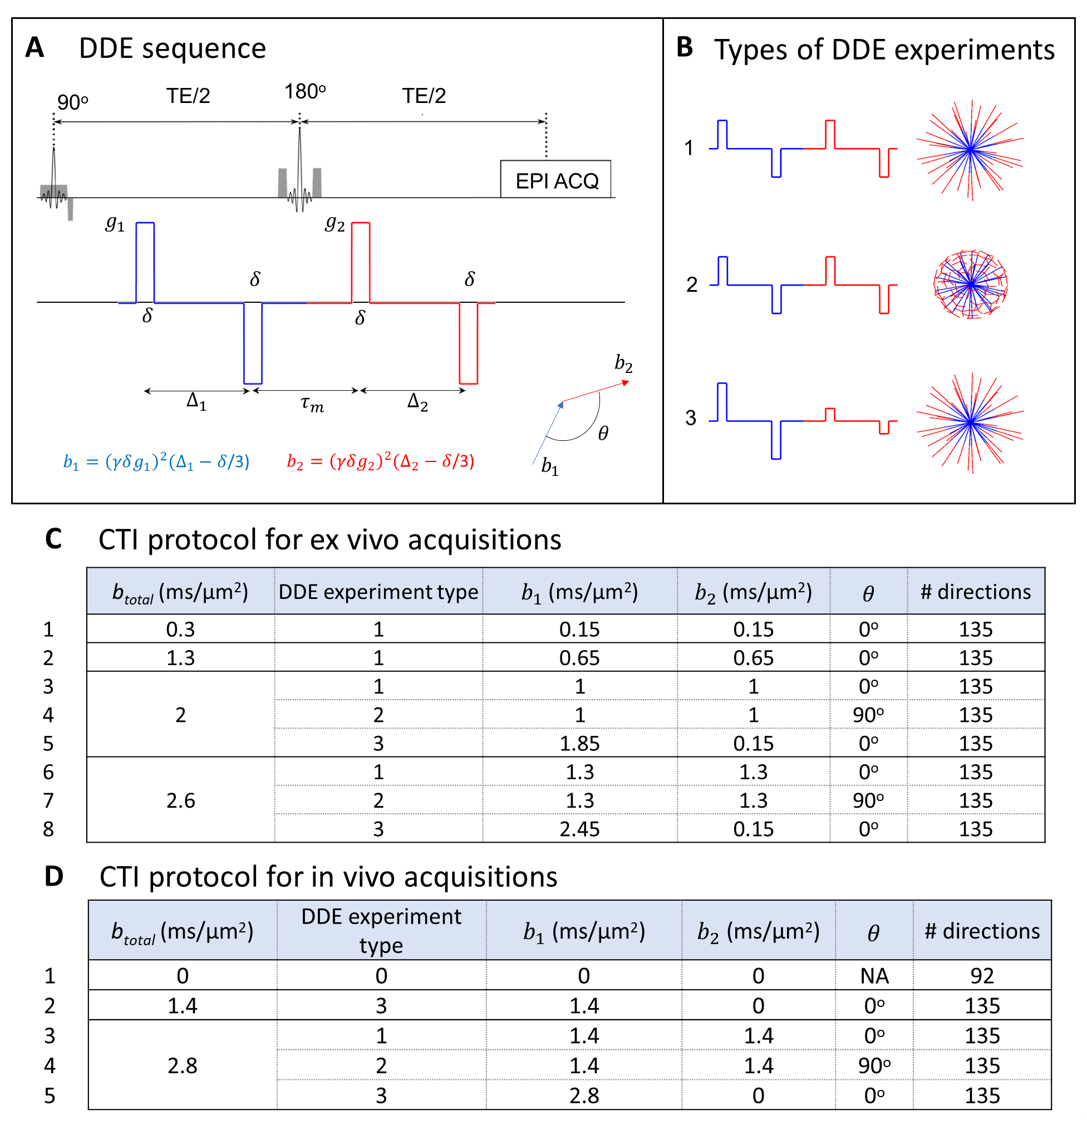
Animals and cell lines: Animal experiments were pre-approved by the competent institutional and national authorities (European Directive 2010/63). Gliomas were induced in C57BL/6j mice by intracranial stereotactic injection of GL261 or CT2A cells in the caudate nucleus17,18.Ex vivo experiments: After 2-3 weeks post-inoculation, brains (N=3 for each glioma subtype) were extracted following transcardial perfusion with 4% Paraformaldehyde and placed in 10 mm NMR tubes. Ex vivo acquisitions were performed on a 16.4T Aeon Ascend Bruker scanner equipped with a unique cryogenic coil. Samples were maintained at 37oC during acquisitions. To probe information of different kurtosis sources14, data was acquired for three different types of DDE experiments and different total b-values (Fig. 1). Additional acquisition parameters were: Δ1=Δ2=12ms, τm=20ms, δ=2ms, TR/TE=3000/51ms, in-plane resolution = 150×150μm2, slice thickness = 300μm. To explore the full potential of CTI on high quality SNR data, these acquisitions were acquired with 10 averages.
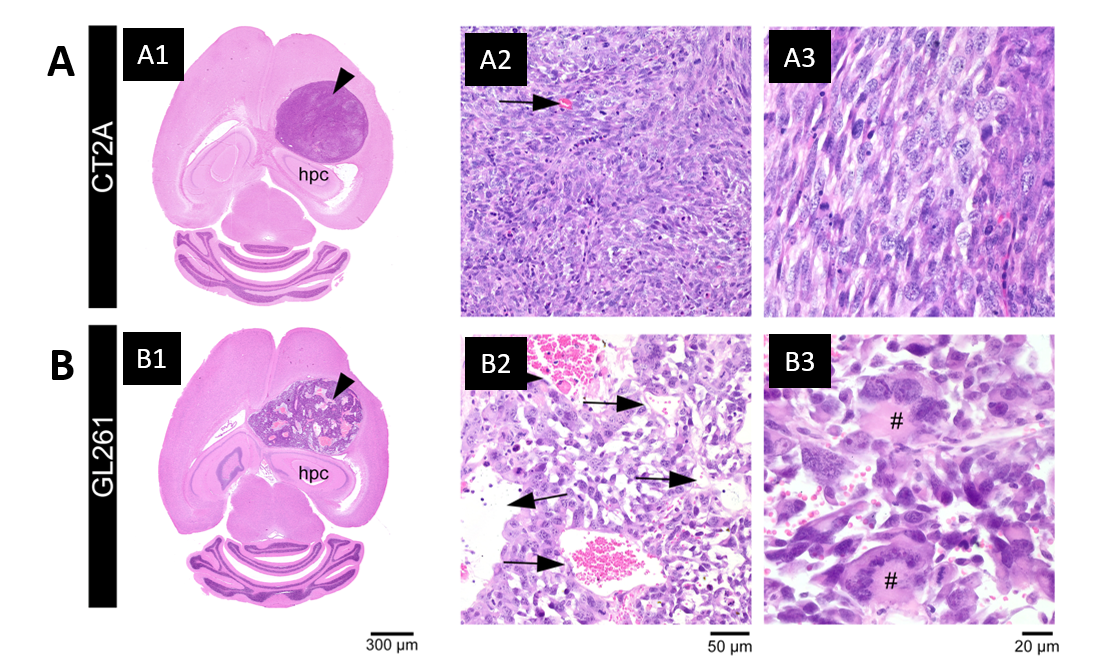
Histopathological analysis: After ex vivo MRI acquisitions, brain was formalin-fixed, paraffin-embedded, sectioned at 4 µm from striatum to caudal hippocampus, and stained with hematoxylin and eosin. Slides were examined in an Axioscope 5 microscope coupled to an Axiocam 108 camera (Zeiss).
In vivo experiments: To assess the potential CTI to characterize tumors in vivo, data was also acquired in two anesthetized mice (under ~2% isoflurane), 2 weeks post-injection of GL261 cells, using a 9.4 T Bruker Biospec scanner equipped a 4-element array cryocoil. Data was acquired according to the minimal DDE experiments required for CTI14 (Fig. 1D). Additional acquisition parameters were: Δ1=Δ2=τm=10ms, δ=4ms, TR/TE=3000/58ms, in-plane resolution = 180×180 µm2, slice thickness = 850µm, Number of averages =2.
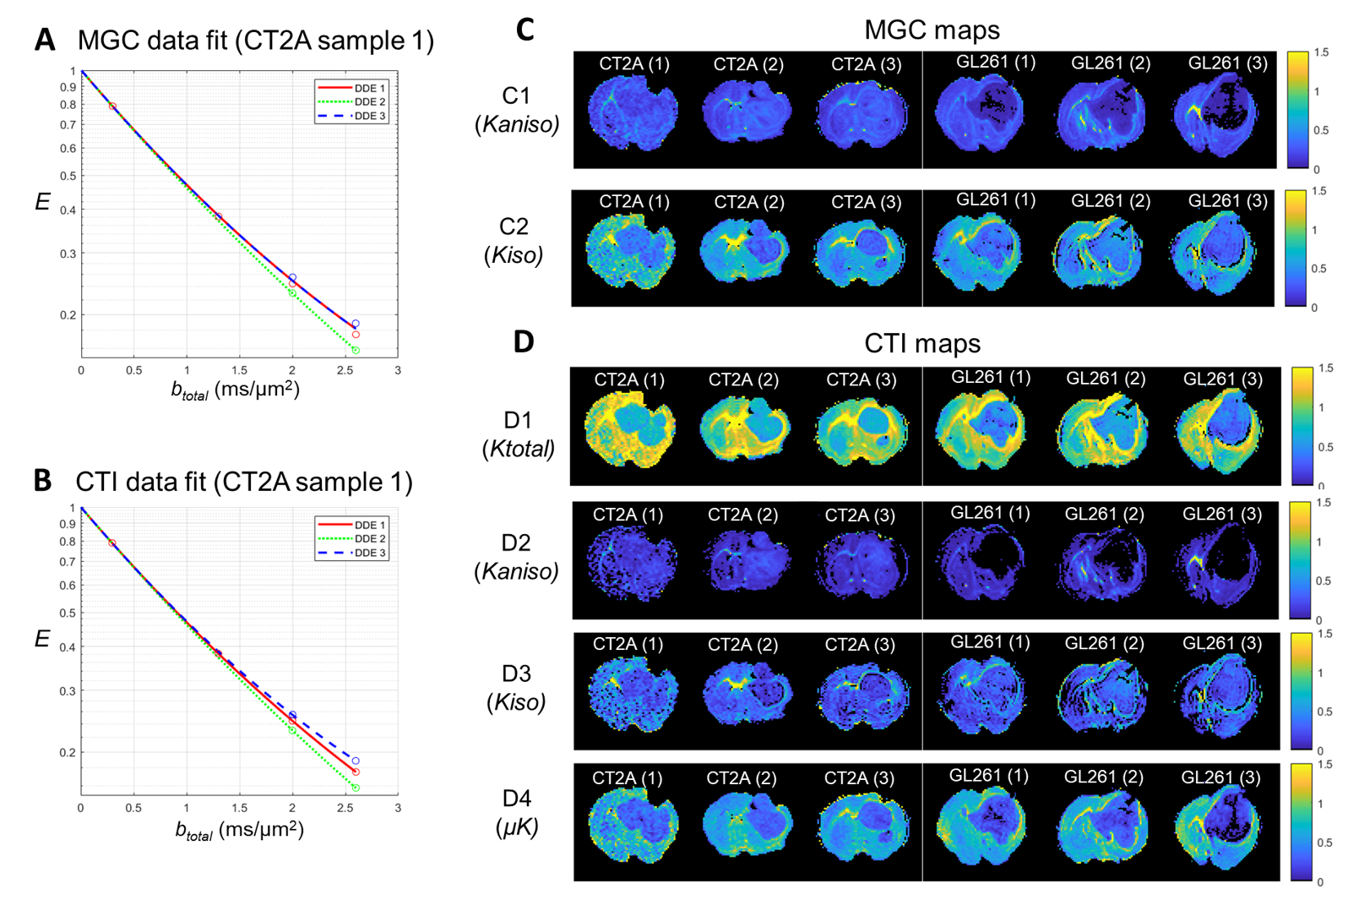
Data processing: CTI was fitted after correction for image drifts / head motion using sub-pixel registration14,19. For comparison, Kaniso and Kiso maps are also extracted using the tensor-valued information of DDE acquisitions and ignoring µK under the MGC assumption.
Results
Each tumor model displays distinct microstructural features in histology: CT2A tumors are composed of dense, cohesive, and homogenous tumor cell populations (Fig. 2A); while GL261 tumors have marked heterogeneity, poorly cohesive areas, and marked intercellular edema intercalated with large and dilated vessels (Fig. 2B).Representative MGC/CTI curves fitted to the powder-averaged data of all tumor voxels of one brain sample are shown in Fig. 3A-B. MGC and CTI kurtosis maps for all samples are shown in Fig. 3C-D. For a better inspection of the differences between CT2A and GL261 tumors, boxplots of concatenated kurtosis values for each tumor type are shown in Fig. 4. CTI reveals lower values of Kaniso than MGC (specifically for GL261 tumors) and enhances the Kiso differences among glioblastoma subtypes. μK is non-vanishing in tumors and captures the regional differences of GL261 tumors (Fig. 3D4), previously entangled on MGC Kaniso maps (Fig. 3C1). Consistently to the ex vivo results, in vivo CTI maps reveals non-vanishing μK and lower Kaniso and Kiso values than measured by MGC counterparts (Fig. 5).
Discussion
CTI’s contrasts clearly differentiated between tumor subtypes and the kurtosis sources are consistent with their respective histological features. Specifically, higher Kaniso in CT2A tumors are in line with the higher density of elongated tumoral cells, whereas higher Kiso in GL261 tumors likely reflects the heterogeneity of cell sizes, as well as the presence of intercellular edema and larger vessels. While the potential of advanced diffusion encodings to distinguish different tumor types has already been shown in previous studies4-5, CTI allows a more complete tissue characterization by accounting for µK effects, which can (a) be useful as an independent contrast but (b) also unbiases the isotropic/anisotropic kurtosis estimates, which are here shown to be more sensitive to the differences between mouse glioma subtypes. In vivo CTI maps of GL261 tumors show consistent results than the ex vivo maps, demonstrating the applicability of CTI for characterizing tumors in living animals.Conclusion
CTI enhances microstructural differences between two mouse glioblastoma subtypes, which are consistent with their specific histopathological features. In future studies, we expect that CTI-based kurtosis sources can provide useful biomarkers for monitoring critical features of glioma progression, including treatment response.Acknowledgements
RNH was supported by the Scientific Employment Stimulus 4th Edition from Fundação para a Ciência e Tecnologia, Portugal, ref 2021.02777.CEECIND. RSV was supported by H2020-MSCA-IF-2018, ref 844776. We thank Dr. Thomas Seyfried for the access to the CT2A cell line and Ms Beatriz Cardoso for the assistance on sample preparation.References
1. Jensen JH, Helpern JA, Ramani A, et al. Magn. Reson. Med. 2005; 53: 1432-1440.
2. Raab P, Hattingen E, Franz K, et al. Radiology 2010; 254(3): 876-881.
3. Falk Delgado A, Nilsson M, van Westen D, Falk Delgado A. Radiology 2018; 287(1): 119-127.
4. Szczepankiewicz F, van Westen D, Englund E, et al. Neuroimage 2016; 142: 522-532.
5. Nilsson M, Szczepankiewicz F, Brabec J, et al., Magn. Reson. Med. 2020; 83: 608-620.
6. Cory DG, Garroway AN, Miller JB. Polymer Prepr. 1990; 31:149.
7. Callaghan PT, Furo I. J Chem Phys 2004;120: 4032–4038.
8. Komlosh ME, Lizak MJ, Horkay F, et al. Magn. Reson. Med. 2008; 59: 803-809.
9. Koch MA, Finsterbusch J. Magn. Reson. Med. 2009; 62: 247-254.
10. Shemesh N, Cohen Y. Magn. Reson. Med. 2011; 65: 1216-1227.
11. Jespersen SN, Buhl NJ. Magn. Reson. 2011; 208: 34-43.
12. Jespersen SN, Lundell H, Sønderby CK, Dyrby TB. NMR Biomed. 2013; 26: 1647-1662.
13. Henriques RN, Jespersen SN, Shemesh N. Neuroimage 2020; 211: 116605.
14. Henriques RN, Jespersen SN, Shemesh N. Magn. Reson. Med. 2021; 83: 608-620.
15. Novello L, Henriques RN, Ianuş A, et al., Neuroimage 2022; 254: 119137.
16. Alves R, Henriques RN, Kerkelä L, et al. Neuroimage 2022; 247: 118833.
17. Simões RV, Serganova, IS, Kruchevsky N, et al., Neoplasia 2008; 17(8): 617-684.
18. Simões RV, Henriques RN, Cardoso BM, et al. Neuroimage: Clinical 2022; 33: 102932.
19. Guizar-Sicairos M, Thurman ST, Fienup, JR. Opt Lett. 2008; 33: 156-158.
Figures