3932
Bias-Reduced LCModel Quantification of 1H Brain MRS with Baseline-and-MM Removal: Application in a Circulatory Arrest Study using Neonatal Pigs
Meng Gu1, Ralph Hurd1, and Daniel Spielman1
1Radiology, Stanford University, Stanford, CA, United States
1Radiology, Stanford University, Stanford, CA, United States
Synopsis
Keywords: Data Processing, Spectroscopy, Accurate Quantification
Quantification of in-vivo short-TE MRS using LCModel suffers from biases due to varying baseline and macro-molecule components, especially for metabolites with coupled resonances. This problem exacerbates at low SNR as the baseline estimated becomes less accurate. To improve quantification, baseline and macro-molecule components were estimated from a high SNR line-broadened spectrum and then subtracted from the original spectrum. Using the baseline and macro-molecule removed spectrum, significantly reduced biases for Gln/tCr and GABA/tCr were achieved at different SNRs. Using this method, LCModel quantification revealed a more prominent trend of increasing Gln/tCr and increased GABA/tCr during circulatory arrest in neonatal pig brain.INTRODUCTION
At 3T, short-TE 1H MRS offers the advantage of acquiring signals from a rich set of metabolites with minimal signal loss from T2 relaxation. However, the short-TE MRS spectrum contains significant macro molecule (MM) components with less stable baseline. All contribute biases to LCModel quantification, especially for metabolites with coupled resonances. This problem exacerbates with noise as the baseline estimated using LCModel becomes less accurate at lower signal-to-noise ratio (SNR). To improve quantification, SNR-insensitive baseline and MM components were estimated from a line-broadened spectrum with high SNR and then subtracted from the original spectrum to obtain a baseline-and-MM removed spectrum. Compared with quantification using the original spectrum, quantified Glutamine (Gln) to total Creatine (tCr) ratio, Gln/tCr, and Gamma-Aminobutyric Acid (GABA) to total Creatine ratio, GABA/tCr, using the baseline-and-MM removed spectrum significantly reduced biases at different SNRs. Using this method, LCModel quantification showed a more prominent trend of increasing Gln/tCr and increased GABA/tCr during circulatory arrest in neonatal pig brain.METHODS
Two-week old piglets were put on a cardiopulmonary bypass pump and placed in a GE MR750 3T scanner (GE Healthcare, Waukesha, WI) with an 16-channel knee coil to study brain metabolism during circulatory arrest at 28°C. Single-voxel MRS data were acquired from a 12 x 12 x 15 mm3 right midbrain voxel continuously for approximately three hours using sLASER with TE/TR=30ms/2s, 5000Hz bandwidth, 4096 data points and 64 averages for each acquisition.1,2 The brain temperature was measured as soon as each acquisition completed using the chemical shift difference between the water and the 2-ppm NAA resonances and used as a reference to keep the brain temperature at 28°C. After the brain temperature equilibrated at 28°C, pump was turned off for 45 minutes of circulatory arrest. The pump was then restarted and heating initiated until the brain temperature reached 37°C for a 1.5-hour recovery period.Original spectra were reconstructed with eddy-current correction, zero-order phasing, coil combination and pure water spectrum subtraction.3 The original spectrum was line-broadened to 7Hz for increased SNR and quantified using the LCModel with 23 phantom-measured metabolite basis. Using this quantification, a metabolite-only spectrum was constructed with the same line-broadening. This metabolite-only spectrum was subtracted from the line-broadened in-vivo spectrum to obtain the baseline-and-MM spectrum. The baseline-and-MM spectrum was then subtracted from the original non-line broadened in-vivo spectrum to obtain the baseline-and-MM removed spectrum and quantified using the LCModel.
To study the baseline-and-MM removal effects on the Gln and GABA quantification, a baseline-and-MM spectrum obtained from an in-vivo spectrum was added to a simulated spectrum with known concentrations and physiological line-width. LCModel quantification was performed on the simulated spectrum with and without baseline-and-MM removal ten times each at SNRs of 15, 20, 25, 30, 35, 40. Quantification of Gln and GABA was also investigated in a titration study using simulated specta with Gln/tCr and GABA/tCr of 0, 0.1, 0.2, 0.3, 0.4, 0.5 respectively and other metabolites at physiological levels. LCModel quantification was performed on each titration step ten times at an SNR of 25. Piglet brain MRS data from the 28°C circulatory arrest study were then quantified with and without baseline-and-MM removal.
RESULTS
A simulated spectrum with known concentrations, Gln/tCr=0.2 and GABA/tCr=0.2, and a baseline-and-MM spectra are shown in Figure 1(a). Figure 1(b) shows the LCModel fit of the combined spectrum at SNR of 21. LCModel fit of the line-broadened spectrum and the baseline-and-MM removed spectrum are shown in Figure 1(c) and Figure 1(d). The statistics of the quantified Gln/tCr and GABA/tCr at different SNRs with and without baseline-and-MM removal are shown in Figure 2. Gln/tCr and GABA/tCr quantified with and without baseline-and-MM removal in the titration study are shown in Figure 3. LCModel fits of representative in-vivo original, line-broadened and baseline-and-MM removed spectra are shown in Figure 4. The dynamics of the brain temperature, quantified Gln/tCr and GABA/tCr with and without baseline-and-MM removal are shown in Figure 5.DISCUSSIONS
Baseline estimated using the line-broadened spectrum, Figure 1c, is closer to the baseline-and-MM added to the simulation than that using the original spectrum. This is because line-broadening increased the SNR from 21, Figure 1(b), to 110, Figure 1(c) and thus made the baseline estimation insensitive to the SNR at which clinical MRS operates. With baseline-and-MM removal, the bias of the quantified Gln/tCr and GABA/tCr were significantly reduced at various SNRs as demonstrated in Figure 2. Quantified Gln/tCr and GABA/tCr in the titration study also demonstrated reduced biases in Figure 3 at each titration level at a typical clinical SNR of 25. This method achieved diminished estimated baseline for in-vivo spectra as shown in Figure 4, enabling improved investigation of brain metabolism with reduced biases. As shown in Figure 5, LCModel quantification with baseline-and-MM removal showed a more prominent trend of increasing Gln/tCr and increased GABA/tCr during circulatory arrest at 28° compared with quantification of the original spectra.CONCLUSIONS
An SNR insensitive baseline-and-MM removal processing has been developed and validated in simulated titration studies for reduced biases in LCModel quantification. Compared with quantification of the original spectra, it showed a more prominent trend of increasing Gln/tCr and increased GABA/tCr during circulatory arrest at 28°.Acknowledgements
NIH grant R01HL152757, the Lucas Foundation, and GE Health Care.References
1. Hanley, F.L., et al., Comparison of dynamic brain metabolism during antegrade cerebral perfusion versus deep hypothermic circulatory arrest using proton magnetic resonance spectroscopy. J Thorac Cardiovasc Surg, 2020. 160(4): p. e225-e227.
2. DM Spielman, M Gu, RE Hurd, RK Riemer, K Okamura, FL Hanley. Proton magnetic resonance spectroscopy assessment of neonatal brain metabolism during cardiopulmonary bypass surgery. NMR Biomed 2022;35:e4752.
3. Gu, M., et al., Reliable Quantification of Phosphocreatine and total Creatine during Deep Hypothermic Circulatory Arrest in Neonatal Pig Brain using LCModel. ISMRM annual conference, 2022.
Figures
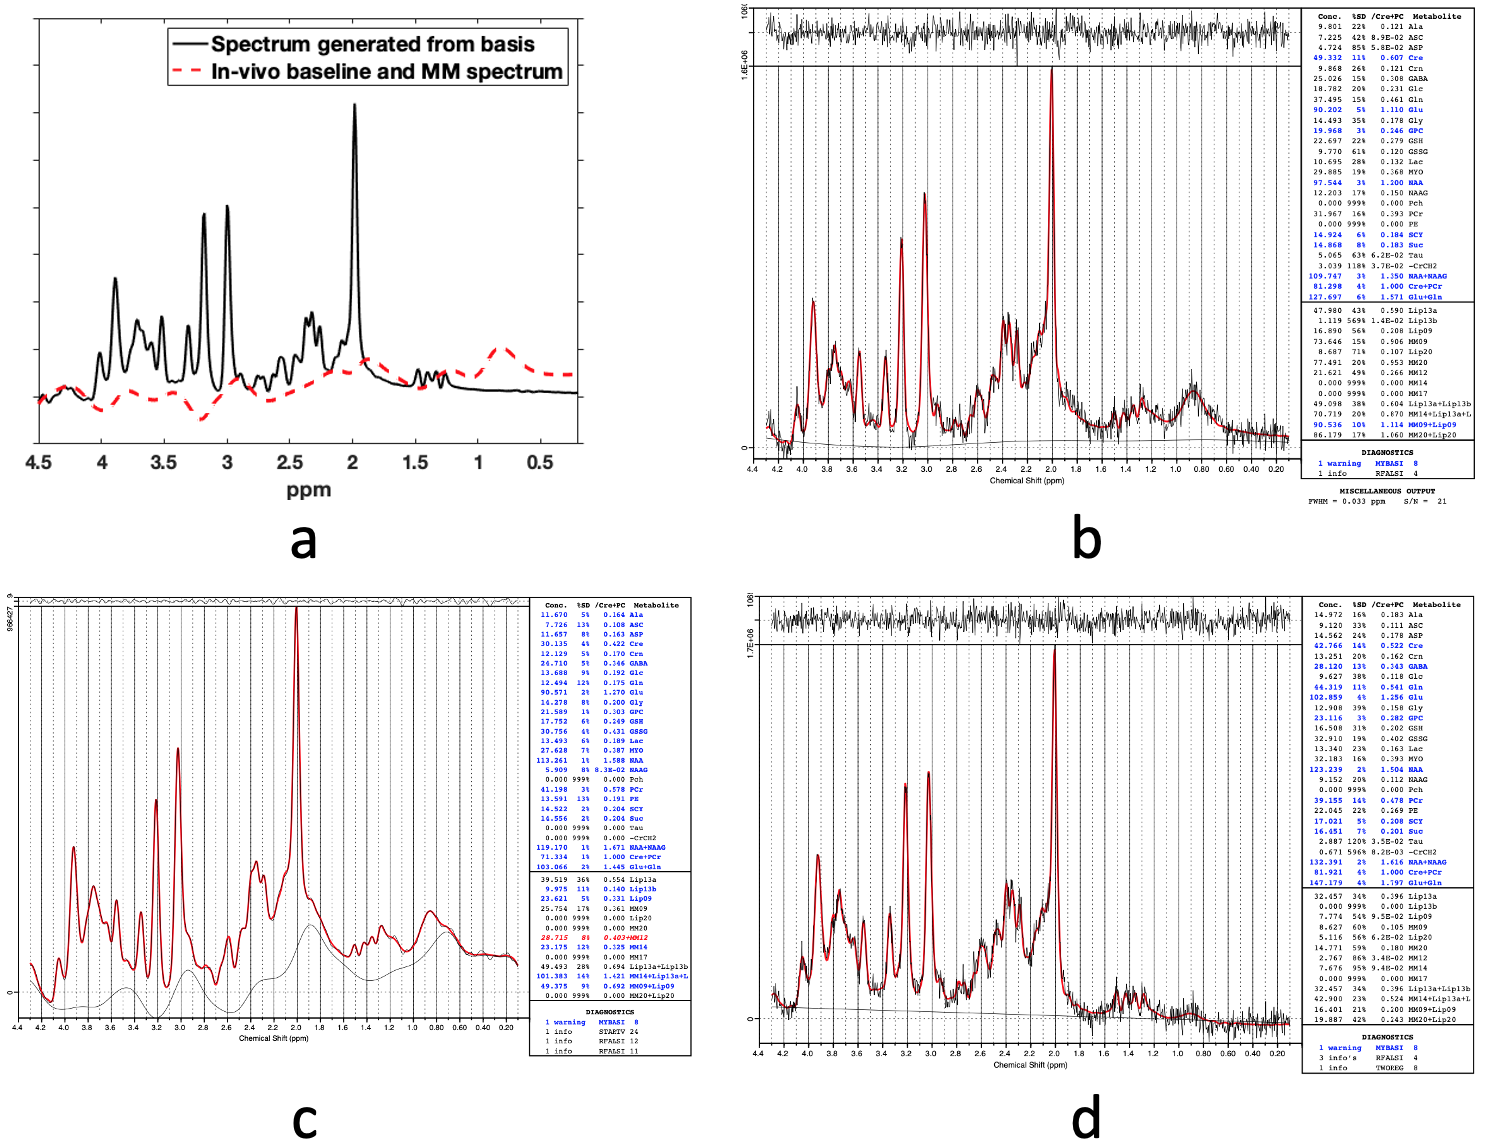
Figure 1. A simulated spectrum with known physiological concentrations and a baseline-and-MM spectra obtained from one in-vivo spectrum (a). LCModel fit of the combined spectrum (b). LCModel fit of the line-broadened spectrum (c). LCModel fit of the baseline-and-MM removed spectrum (d).
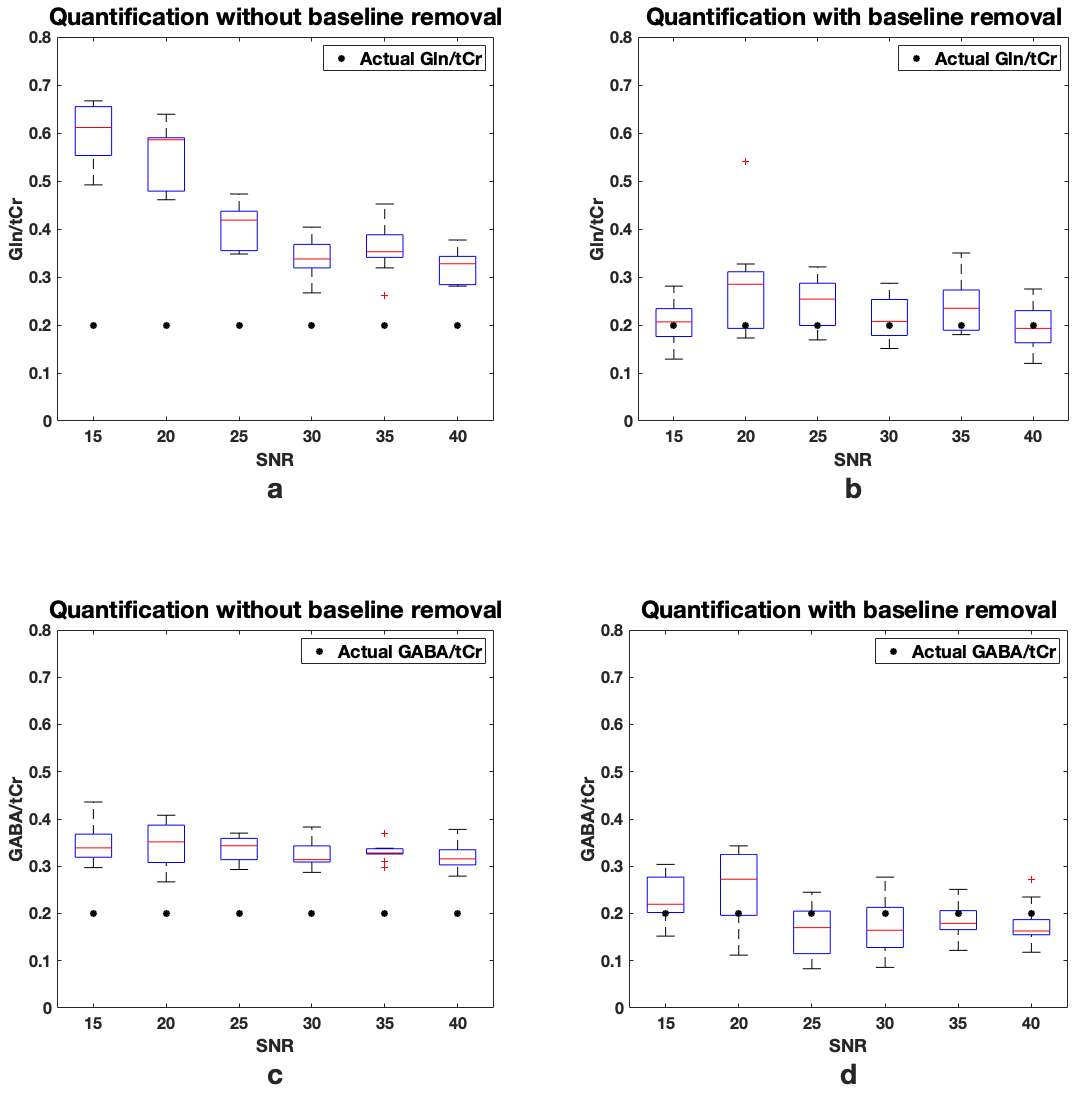
Figure 2. Box plot of the LCModel quantified Gln/tCr (a,b) and GABA/tCr (c,d) with and without baseline-and-MM removal at different SNRs. LCModel quantification was performed ten times at each SNR.
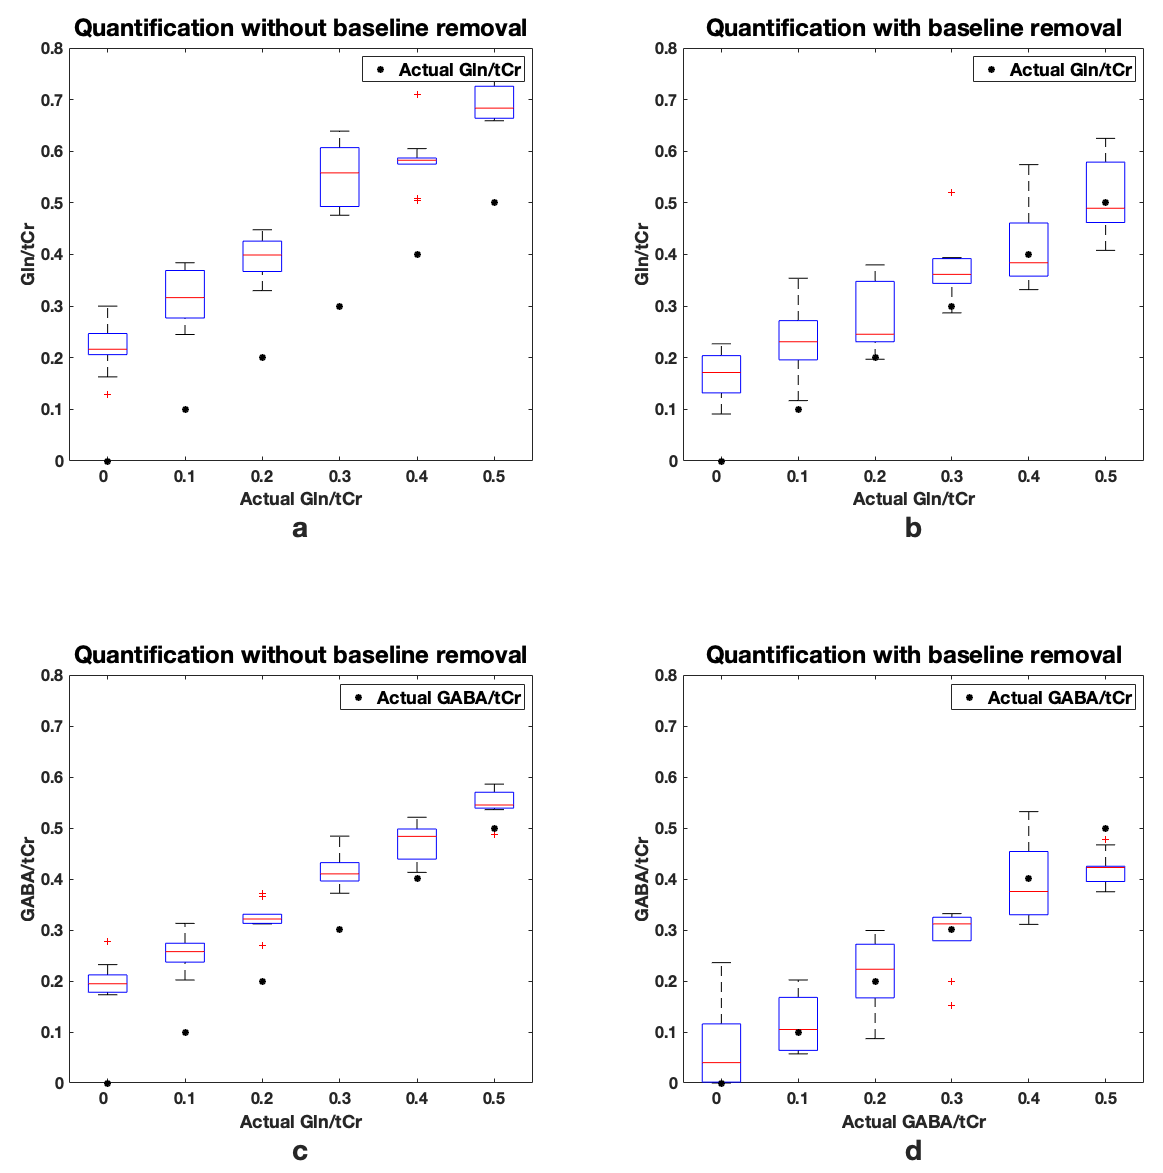
Figure 3. Box plot of the LCModel quantified Gln/tCr (a,b) and GABA/tCr (c,d) with and without baseline-and-MM removal in a simulated titration study (Gln/tCr=0, 0.1, 0.2, 0.3 0.4, 0.5 and GABA/tCr=0, 0.1, 0.2, 0.3 0.4, 0.5). LCModel quantification was performed on each titration step ten times at an SNR of 25.
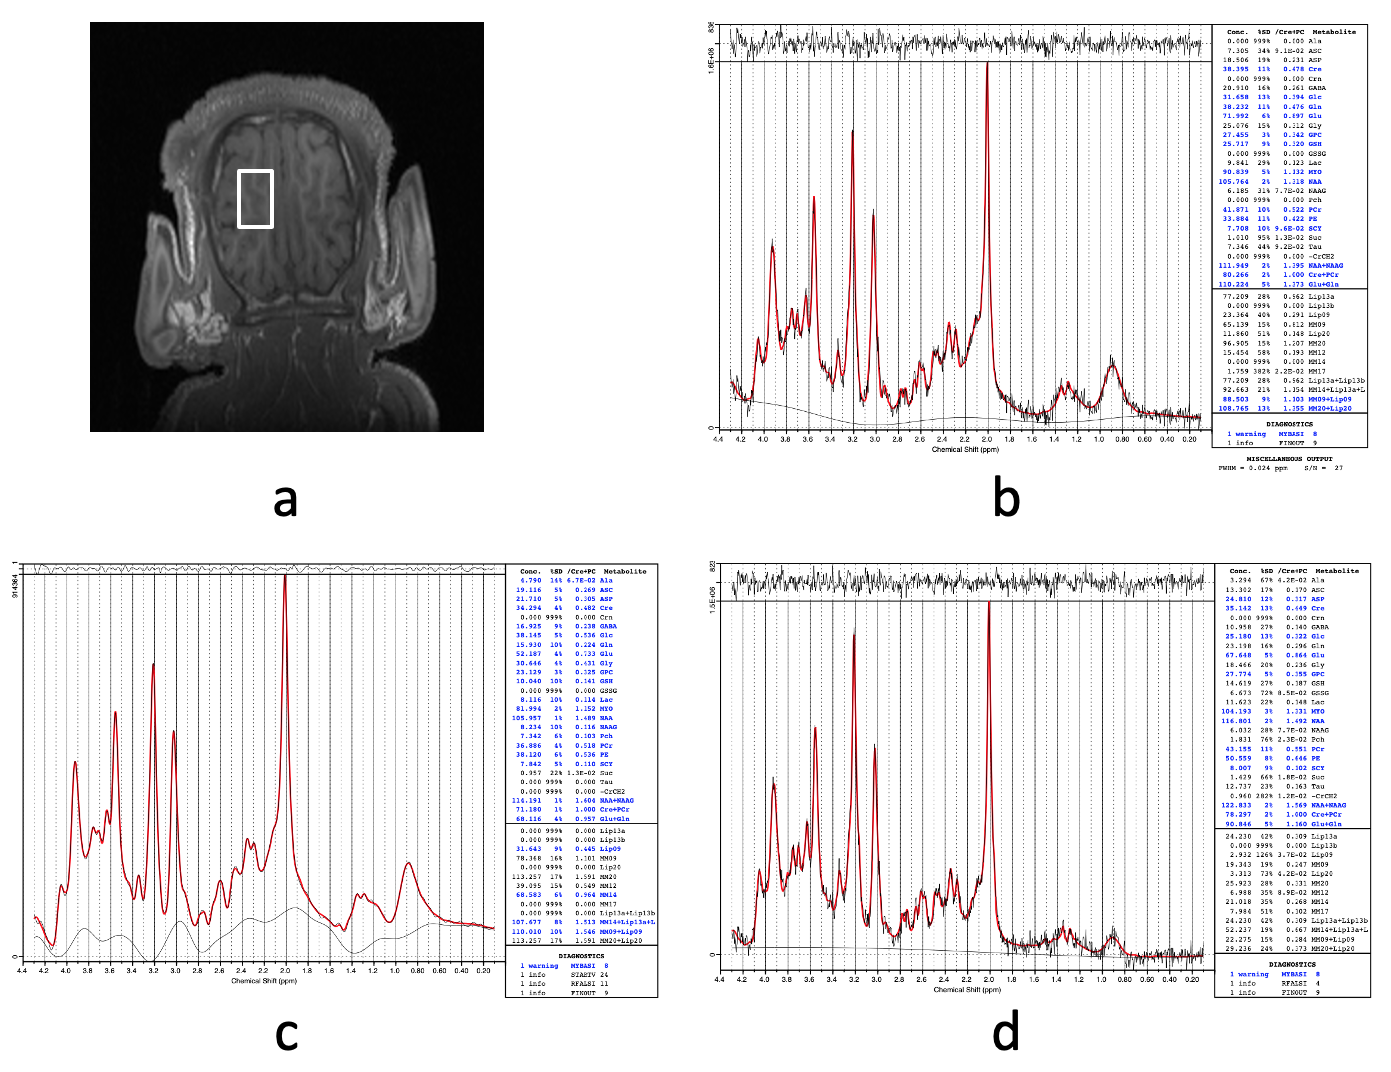
Figure 4. MRS acquired from a neonatal pig brain before circulatory arrest at 28°C (a). LCModel fit of the original spectrum (b). LCModel fit of the line-broadened spectrum (c). LCModel fit of the baseline-and-MM removed spectrum (d).
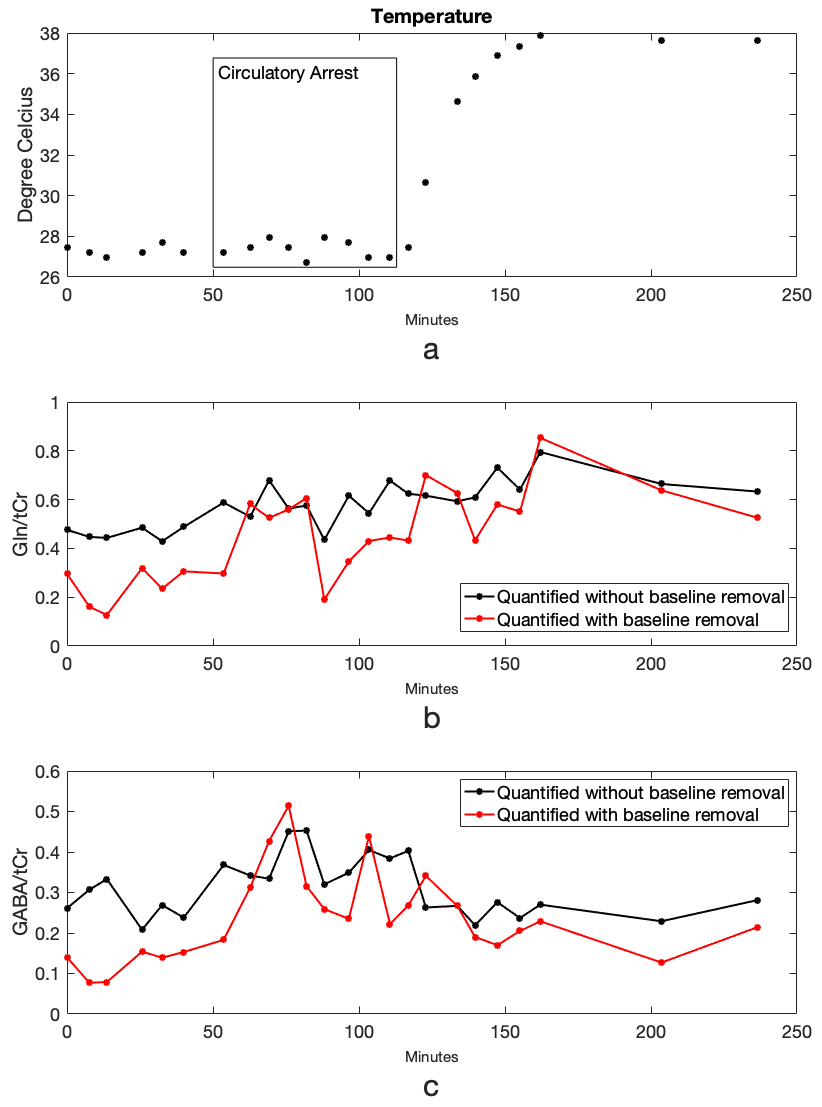
Figure 5. Brain temperature measured using the MRS data throughout the circulatory arrest study (a). LCModel quantified Gln/tCr (b) and GABA/tCr (c) with and without baseline-and-MM removal.
DOI: https://doi.org/10.58530/2023/3932