3930
A water-exchange dynamic contrast-enhanced MRI protocol optimized for AQP4 measurement in glioma1Key Laboratory of Biomedical Engineering of Ministry of Education, College of Biomedical Engineering and Instrument Science, Zhejiang University, Hangzhou, China, 2MR Collaboration, Siemens Healthcare, Shanghai, China, 3Zhejiang University School of Medicine, Hangzhou, China, 4College of Biomedical Engineering and Instrument Science, Zhejiang University, Hangzhou, China
Synopsis
Keywords: Contrast Agent, Tumor
A dynamic contrast-enhanced MRI (DCE-MRI) protocol was optimized to measure transmembrane water exchange rate (kio), which was correlated kio with aquaporin-4 (AQP4) immunohistochemistry results in a rodent subcutaneous glioma model. From the acquired results, a significant correlation was demonstrated between the optimized kio and AQP4, indicating that kio measured by DCE-MRI could reveal the expression of AQP4.
Introduction
The membrane-bound channel, namely aquaporin channel 4(AQP4), plays an essential role in glioma pathology1. However, there are still no tools available for the direct imaging of AQP4. The DCE-MRI technique has been widely applied in pre-clinical and clinical studies for glioma diagnosis2. DCE-MRI also shows promise in measuring intracellular water efflux rate (kio)3, which shows potentials in revealing the expression of AQP4 as AQP4 could largely alters kio. However, there still lacks a protocol of DCE-MRI optimized to measure kio and its relation with AQP4 is still unclear. The goal of this work was to optimize the DCE-MRI protocol to maximize its sensitivity to kio and compare kio with the expression of AQP4.Methods
The water dynamics in brain tissue is described as a three-site-two-exchange (3S2X) system4. It considers water molecules in three compartments (blood (b), extracellular extravascular (o), and intracellular (i) space), with two water exchange processes: between the blood and extracellular space(kbo) and between the extracellular and intracellular space(kio), more detailed provided in ref 4. Based on 3S2X system, optimization of acquisition parameters and contrast agent injection paradigm were performed for better estimation of kio.Optimization of the DCE-MRI acquisition parameters
To optimize the scanning parameters in DCE-MRI, Monto Carlo simulations of DCE-MRI signals based on the 3S2X model were performed. Combined with scanning parameter and physiological parameter, MR signal was generated from 3S2X model. Random Gaussian noise were added to the MR signal with an SNR=200. The estimation of kio was performed through nonlinear least square(NLLS) fitting. The detailed flow chart of simulation was demonstrated in Fig.1.A. Through the simulation paradigm, any slight modification to scanning parameter could influence the accuracy and precision of kio estimation. Considering the limitation of the DCE-MRI experiment (frame time and the number of slices), the repetition time was fixed at 100ms for a 2D Multi Gradient Echo(MGE) sequence (frame time=6.4s), and compare the influence of different flip angle [0-40º] on estimation of kio. Other physiological parameters are listed as follows: pb=0.05, po=0.2, Ktrans=0.01 min-1, kbo =3s-1, kio = 3s-1. In addition, the contrast agent (CA) concentration in plasma (Cp) was extracted from a patient after polynomial fitting.
Optimization of the contrast agent injection paradigm
Simulations of different injection protocols are compared to select the best injection paradigm. The illustration of the experiment of DCE-MRI was shown in Fig.2.A. We compare the different type of CA injection protocol, including a normal single bolus injection, high-dose single bolus injection, and two-bolus injection. Compared with normal single bolus injection, the high-dose single bolus injection was 1.5 times higher, and the two-bolus injection Cp was associated with two normal Cps (Fig.2.B). In addition, the kio weighted signals were displayed in Figs.2.C.D.E, with a parameter of pb=0.05, po=0.2, Ktrans=0.01 min-1, kbo =3 s-1 and kio =[0,1] s-1.
Animal Experiments
The rat (n=10) MRI experiments on the subcutaneous glioma model were performed at a 7T research system (MAGNETOM 7T, Siemens Healthcare, Erlangen, Germany) equipped with a whole-body gradient, and a surface coil for small animal imaging. Animals were kept in anesthesia with a breathing mask and in a customized chamber to avoid motion artifacts. Before water exchange DCE-MRI, quantitative T1 and B1 field maps were acquired with slice thickness 1.5mm, matrix size 128 × 64, resolution 0.5 × 0.5 mm, and seven slices. T1 parametric map was acquired with an inversion recovery turbo spin echo (IR-TSE) sequence: seven IR delays 60, 100, 300, 700, 900, 1200 and 1500ms, TR = 5000ms, and TE = 8.2ms. B1 field map was estimated with a multi-flip-angle MGE sequence: TR = 101ms, TE = 2.8, 6.2 and 10.2ms, flip angle (FA) = 5°, 7°, 10°, 15°, 20°, 40°, 60°, 70°, 80°, 90°. Water exchange DCE-MRI was performed with an MGE sequence and the same spatial settings as T1 (and B1) mapping. The MGE parameters TR = 101ms, FA = 20°. In this study, 220 frames were acquired with 6.46 s per frame (23.7 min in total). In addition, a two-bolus intravenous injection on the 20th frame (0.25mmol/kg) and 120th frame (0.25mmol/kg) was used to further enhance the sensitivity of water exchange DCE-MRI to kio.
Results and Discussion
The simulation result indicated that best accuracy and precision of kio estimation was observed when flip angle exceeded 10º (Fig.1.B). Hence we fixed flip angle at 20 º in our experiment. By comparing the different CA injection paradigms, it was found that the two-bolus injection protocol performed better than the single bolus in measuring kio (Figs.2.F.G.H) in both accuracy and precision. Figs.3.A.B depict the error analysis3 result of two pixels in Fig.3.C, which shows the performance of the optimized DCE-MRI protocol. Furthermore, by comparing the kio map with the AQP4 immunohistochemistry data (Figs.4.A.B.C), strong correlation between AQP4% and kio was found in the rodent study. (Fig.4.D).Conclusion
An optimization framework for water exchange DCE-MRI was proposed for measuring the transmembrane water exchange rate in DCE-MRI. Particularly, a two-bolus contrast agent injection paradigm was recommended. By comparing the kio with the AQP4 immunohistochemistry data of glioma, it was demonstrated that the transmembrane water exchange rate could reveal the expression of AQP4 in gliomas.Acknowledgements
No acknowledgement found.References
1. Nico, B. et al. Aquaporin-4 contributes to the resolution of peritumoural brain oedema in human glioblastoma multiforme after combined chemotherapy and radiotherapy. Eur. J. Cancer 45, 3315–3325 (2009).
2. Okuchi, S. et al. Diagnostic accuracy of dynamic contrast-enhanced perfusion MRI in stratifying gliomas: A systematic review and meta-analysis. Cancer Med. 8, 5564–5573 (2019).
3. Bai, R. et al. Shutter-Speed DCE-MRI Analyses of Human Glioblastoma Multiforme (GBM) Data. J. Magn. Reson. Imaging 52, 850–863 (2020).
4. Li, X., Rooney, W. D. & Springer, C. S. A unified magnetic resonance imaging pharmacokinetic theory: Intravascular and extracellular contrast reagents. Magn. Reson. Med. 54, 1351–1359 (2005).
Figures
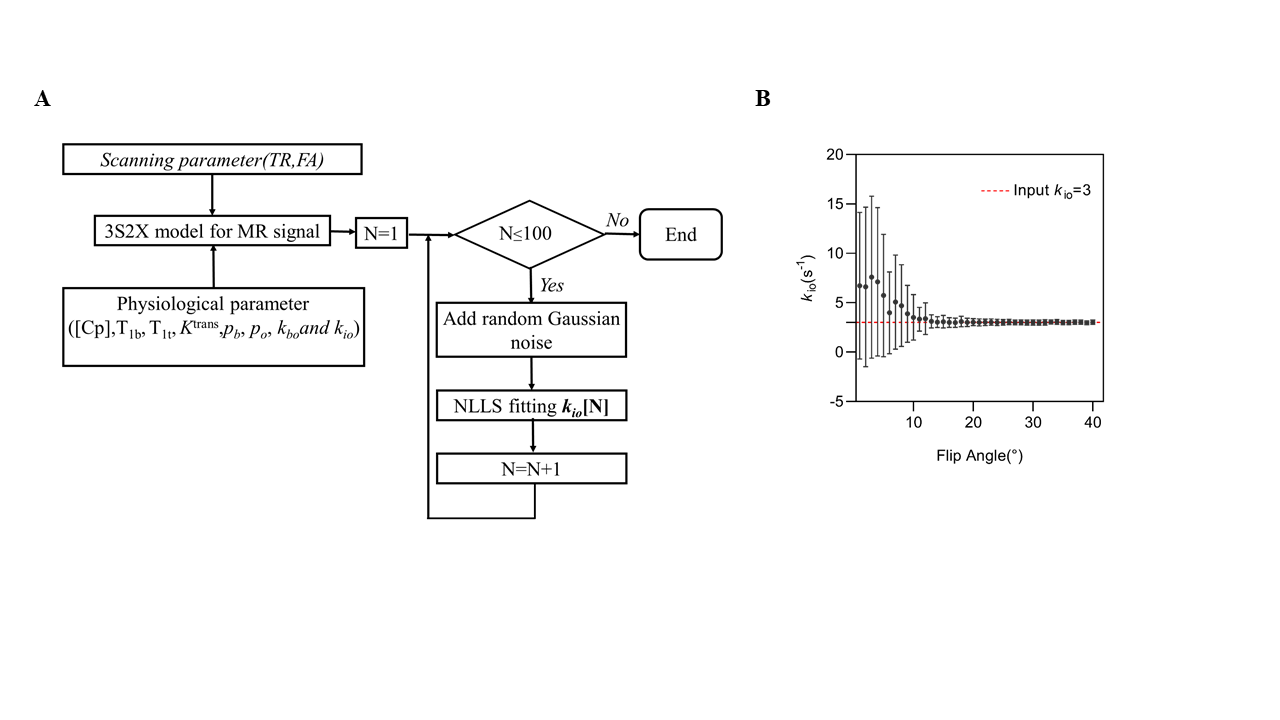
Figure 1. Simulation diagram and flip angle influence on kio estimation. A. The flow chart of Monto Carlo simulation. B. the estimation of kio through different flip angle in TR 100ms with input kio =3. The dashed lines denote the input kio =3 s-1(ground truth). The points and error bars represent the averages and standard deviations of the estimated kio, n = 100.
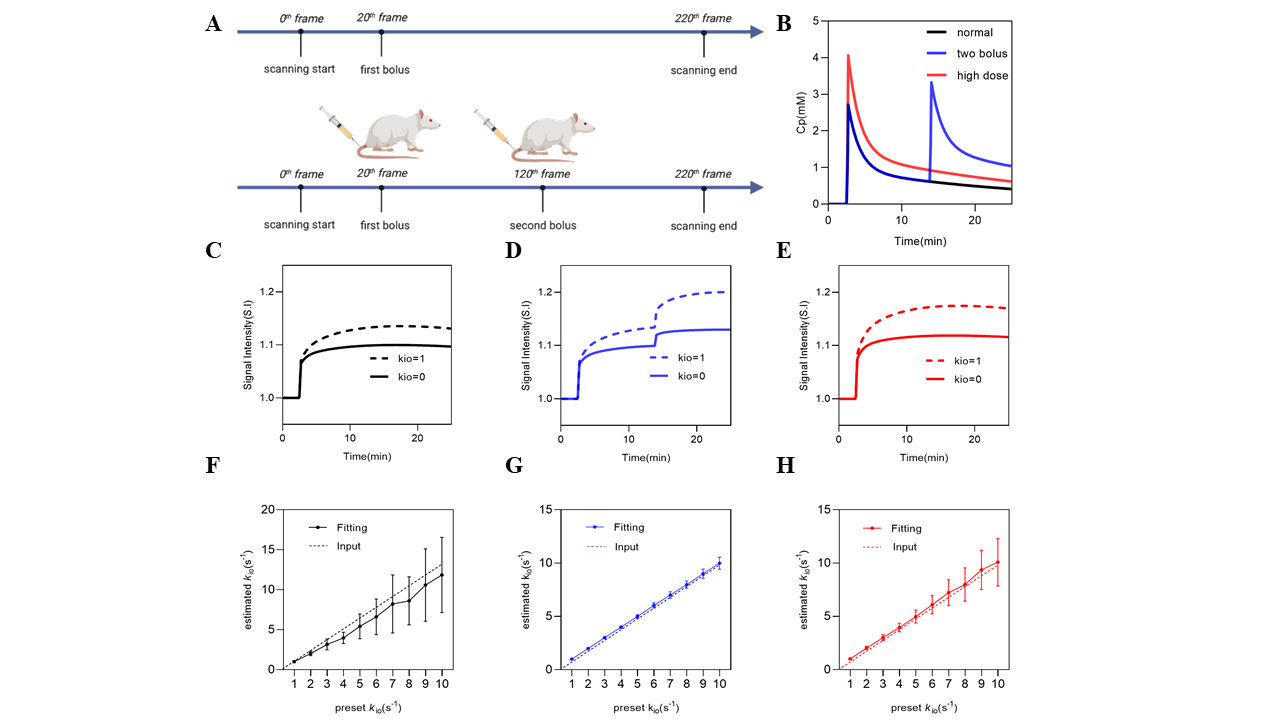
Figure 2. Simulation result of three injection protocols. A. The illustration of DCE-MRI experiments: one-bolus in the first line and two-bolus in the second. B. The demonstration of three different types of injection protocol. C, D and E shows the MR signal influenced by different types of Cp and kio. F, G and H shows the simulation result from three injection protocols respectively. The dashed lines denote the input kio (ground truth). The points and error bars represent the averages and standard deviations of the estimated kio, n = 100.
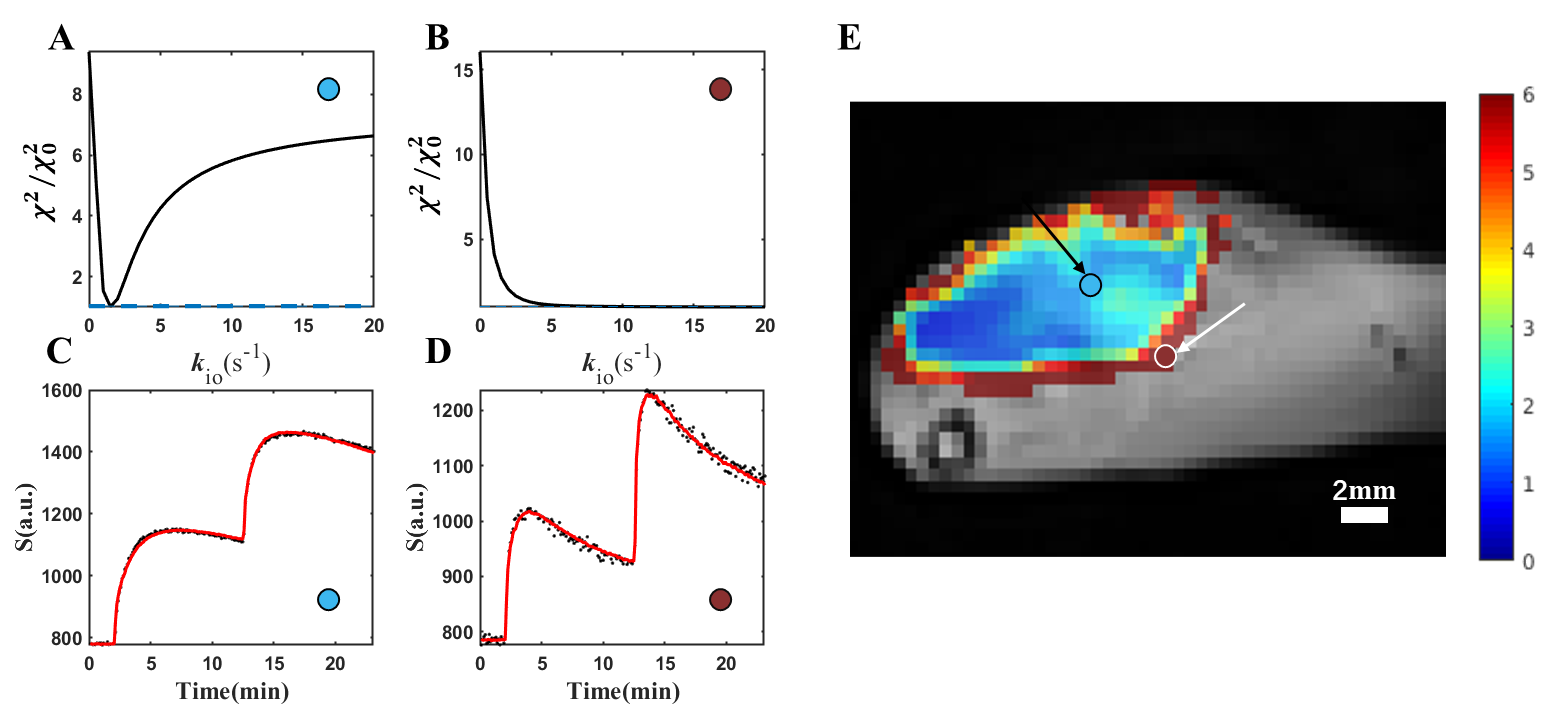
Figure 3. Error analysis and SSM model performance. A and B show the error analysis result, the reduced chi-square value χ2 was used to assess the goodness of fit. C and D show the model performance by fitting raw data. These two pixels (pixels in the black or white circle, labeled with an arrow) are sampled from a kio map E. Figure A shows that the χ2/χ02 has a minimum point, demonstrating that our model fitting is sensitive to kio. In Figure D shows no minimum point, where kio is quite large.
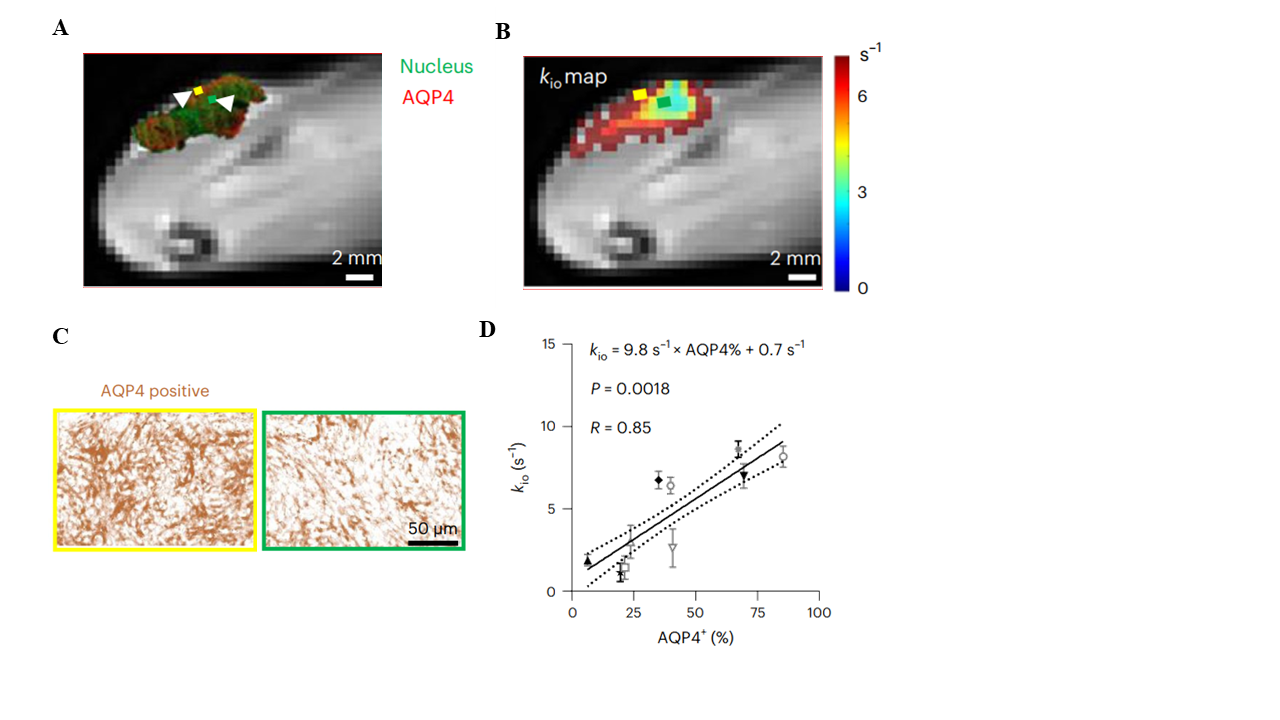
Figure 4. kio map obtained from water-exchange DCE-MRI can reveal AQP4 expression in vivo. A IHC results overlaid on T2-weighted images, with AQP4 and cell nuclei were labelled as red and green, respectively. B The kio map overlaid on the same slice of A on T2-weighted images. C Zoomed IHC results from two pixels illustrated in A and B. D A linear correlation is observed between the whole tumour-averaged kio and the AQP4-positive fraction (n = 10). The solid line reflects the linear regression and the area between two dashed curves reflects 95% confidence interval.