3929
Mapping the effect of oxytocin on the mouse brain using Q2TIPS arterial spin labelling and BOLD fMRI at 9.4T1Department of Neuroimaging, King's College London, London, United Kingdom, 2Department of Forensic and Neurodevelopmental Sciences, King's College London, London, United Kingdom
Synopsis
Keywords: Brain Connectivity, Arterial spin labelling, pharmacological MRI
Currently, standard Bruker protocols for arterial spin labelling (ASL) in mice are limited to single-slice methods. Here, we implemented multi-slice Q2TIPS ASL on a Bruker 9.4T scanner for whole-brain mapping of cerebral blood flow (CBF) in mice. There was good agreement between Q2TIPS and the standard Bruker FAIR ASL. Pharmacological MRI using Q2TIPS ASL and BOLD fMRI revealed that systemic administration of a behaviorally relevant dose of oxytocin caused a global decrease in CBF and increase in functional connectivity in healthy, wildtype mice. These opposing effects corroborate a recent concept of mutual exclusivity between neuronal activity and functional connectivity.
Introduction
Arterial spin labelling (ASL) measures cerebral blood flow (CBF) and is an important tool for pharmacological MRI (phMRI) studies. Currently, Bruker, the leading preclinical MRI vendor, only offers single-slice methods for ASL in mice: continuous ASL and a pulsed ASL (PASL) method using flow-sensitive alternating inversion recovery (FAIR)1. Our aims were to 1) implement multi-slice Q2TIPS PASL2 using Bruker’s FAIR labelling scheme; 2) validate the Q2TIPS method against Bruker’s standard FAIR method; and 3) apply Q2TIPS in a phMRI study investigating the effects of oxytocin (OXT) in healthy, wildtype mice.Methods
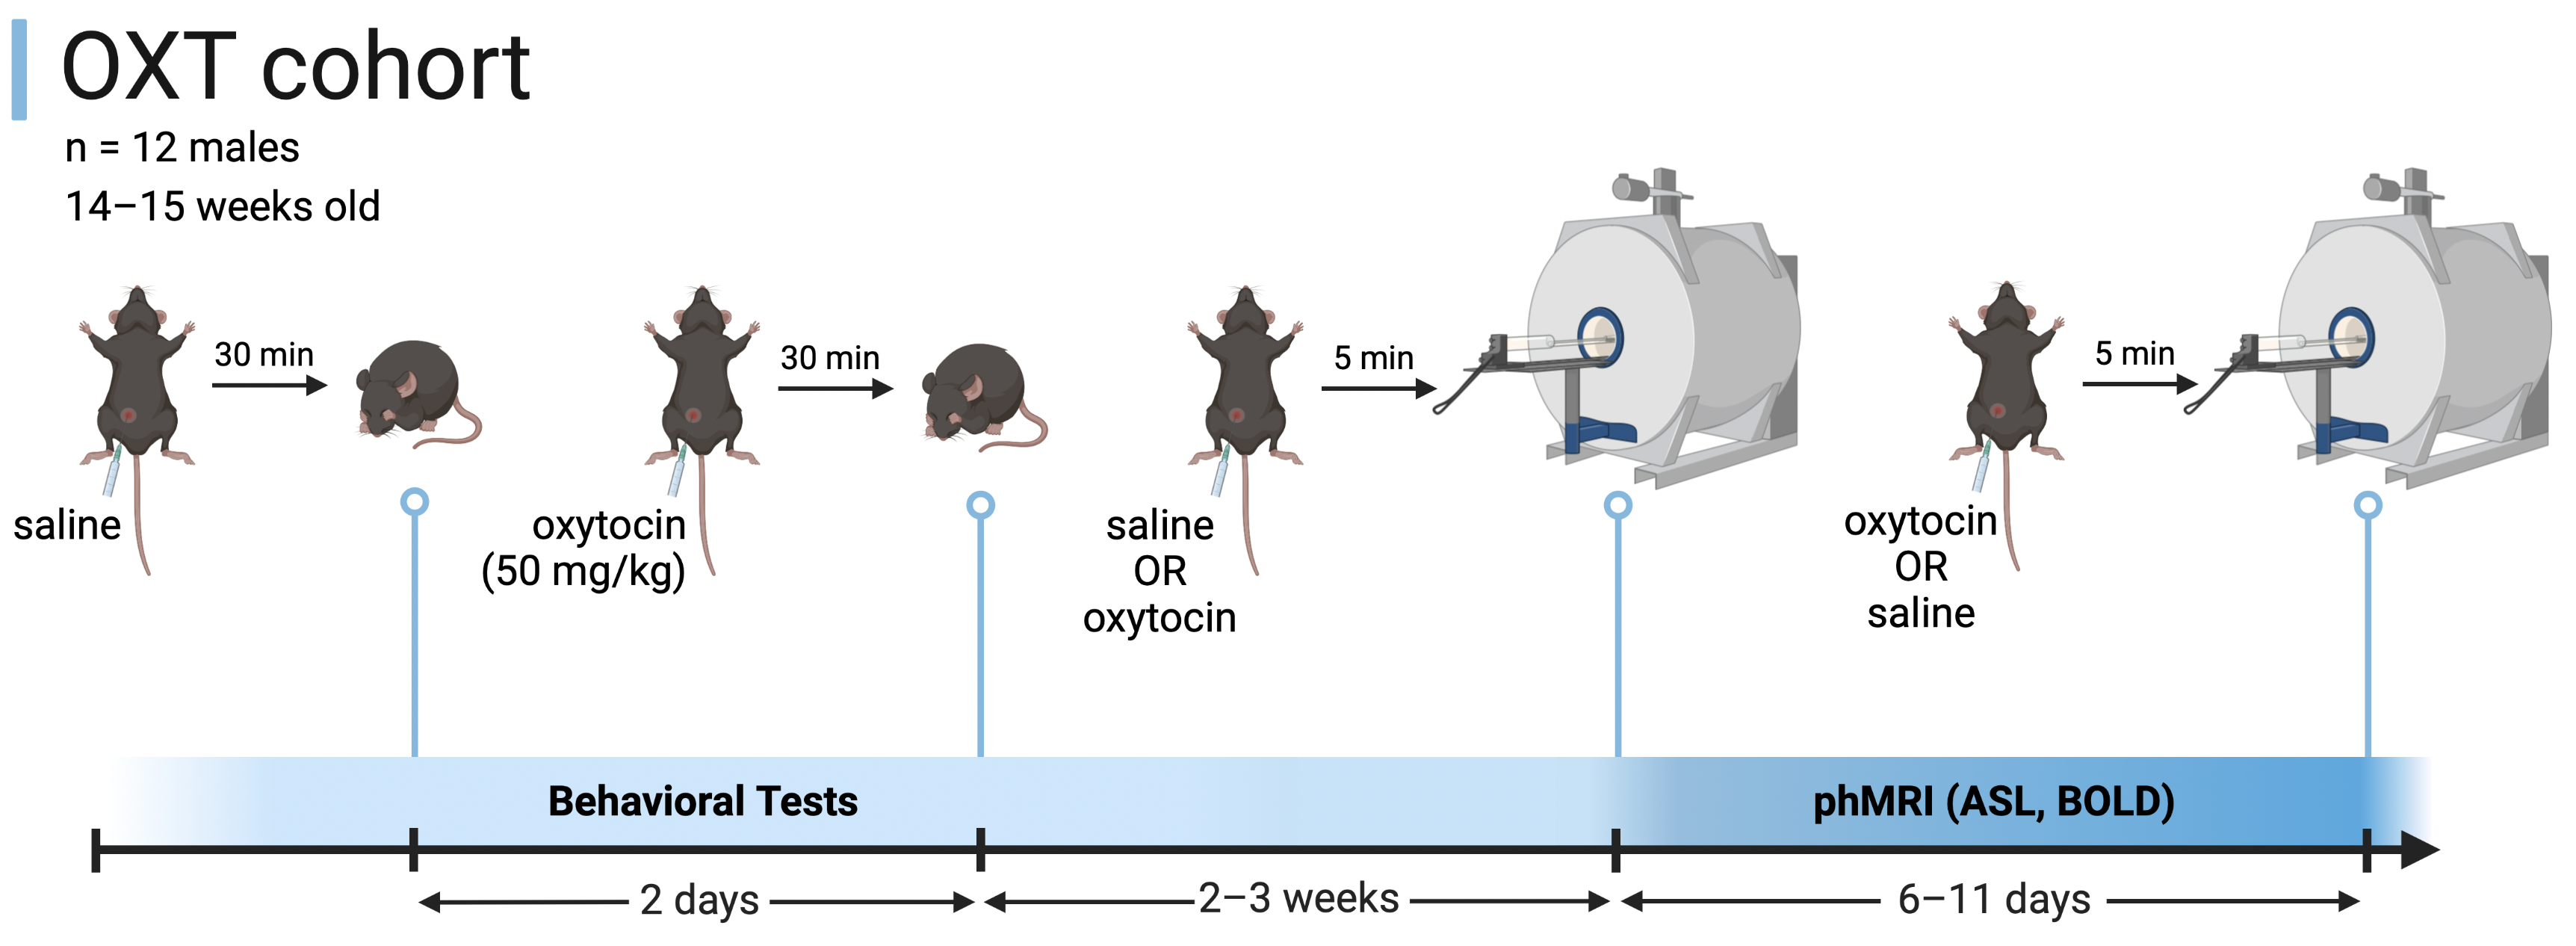
Two cohorts of wildtype mice with a C57Bl6/J background were used: 1) the FAIR cohort (4 males, 4 females) was used to compare the Q2TIPS and standard FAIR methods, and 2) the OXT cohort (12 males) to investigate the effects of OXT on CBF and functional connectivity. The OXT cohort was tested for OXT-relevant behaviors after i.p. administration of saline or OXT (50 mg/kg). After 2–3 weeks, they were scanned twice (6–11 days apart) after receiving the same dose of OXT or saline (Figure 1).All mice were scanned under an anesthetic regimen of medetomidine (0.05 mg/kg s.c. bolus followed by 0.1 mg/kg/h infusion) and isoflurane (0.3–1%, adjusted to maintain the respiration rate at 130–150 breaths/min). The body temperature was maintained at 36.5± 0.5°C with a warm water circulation system.
For all mice, the following images were acquired with a 9.4T Bruker BioSpec using an 86-mm transmit volume coil and a mouse brain 2×2 surface array receiver coil:
- Structural image (T2w RARE).
- ASL M0 image (IR-SE-EPI): two images with opposite phase-encoding polarity were acquired.
- Q2TIPS ASL (FAIR-SE-EPI): periodic saturation with 70 SLR pulses (2.5 ms pulse length, 5 ms interval, 4-mm slice thickness).
For the FAIR cohort, standard FAIR ASL was performed by modifying the default Bruker Perfusion_FAIR_EPI protocol to have 16 TIs (30 to 2300 ms) and the same readout as the Q2TIPS sequence.
For the OXT cohort, BOLD fMRI was performed using a GE-EPI sequence. A pair of SE-EPI images with opposite phase-encoding polarity and the same geometry and EPI readout as the BOLD fMRI scan were also acquired.
See Table 1 for further pulse sequence parameters.
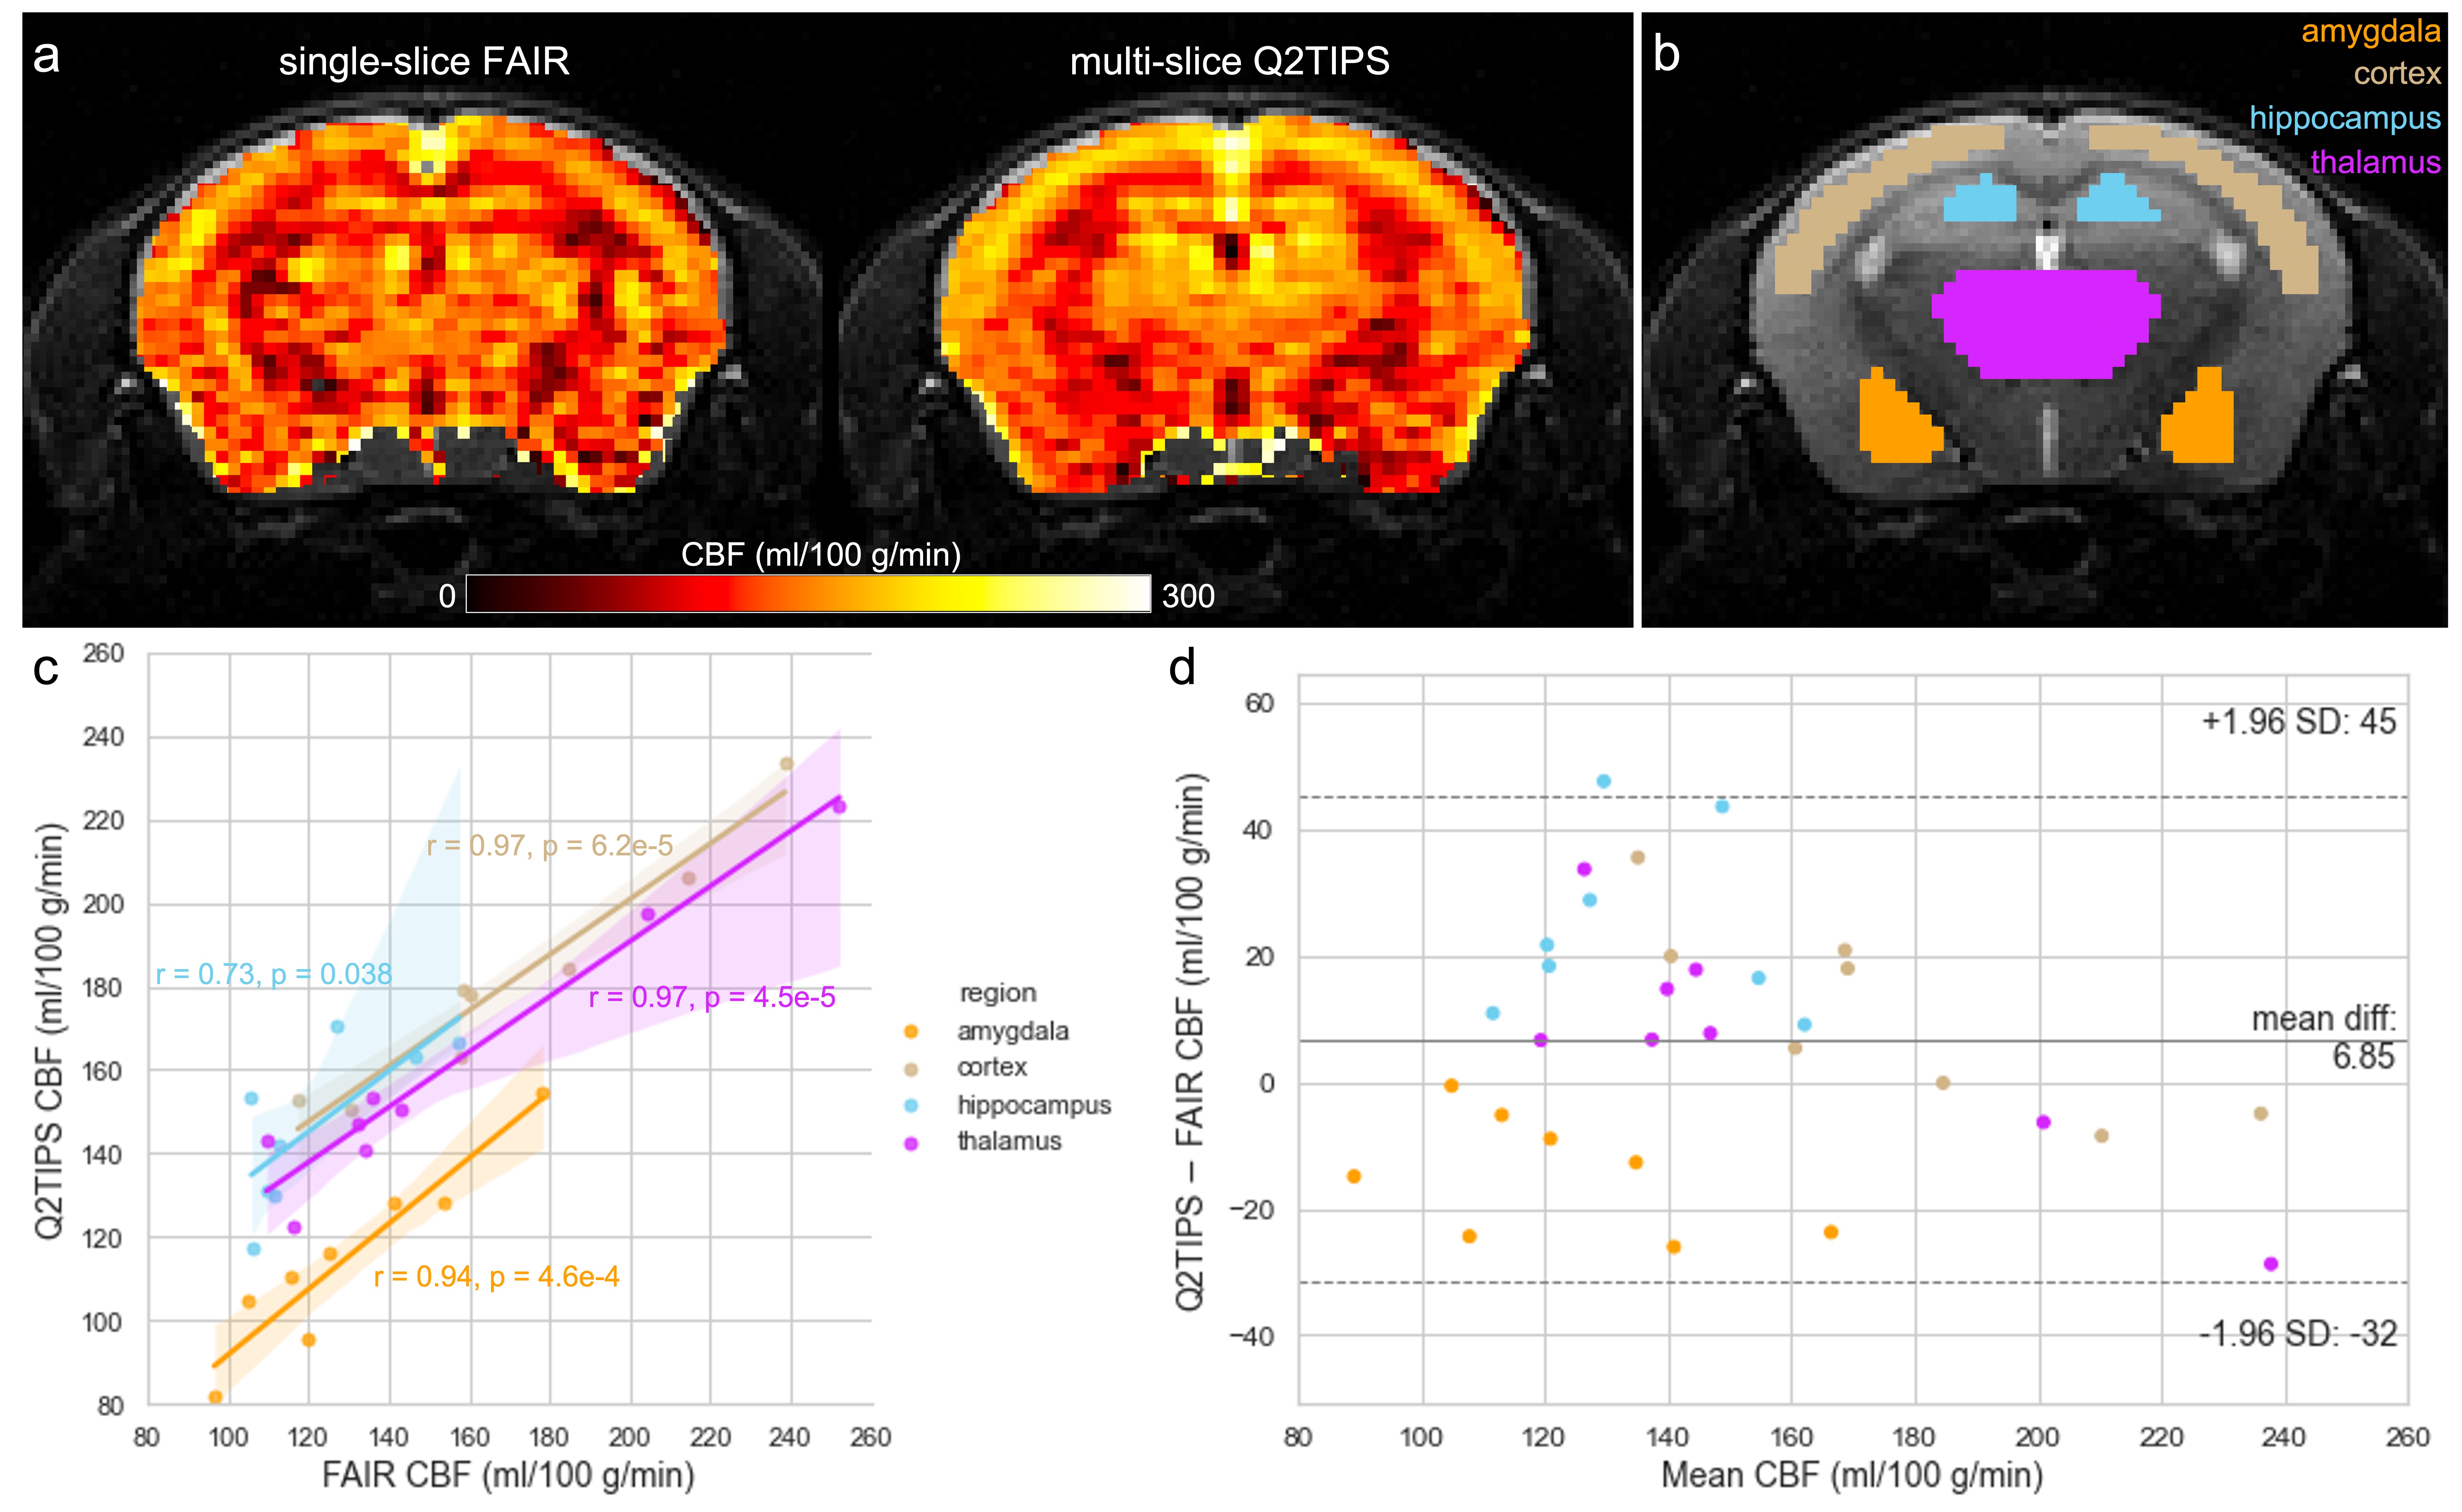
CBF maps were created from the FAIR data using the ParaVision ASL_Perfusion_Processing macro and from the Q2TIPS data using Equation 2 from Alsop et al3. For both methods, values of T1,blood=2.4 s and blood/brain partition coefficient λ=0.9 ml/g were used. For the FAIR cohort, mean FAIR and Q2TIPS CBF values were extracted from manually delineated amygdala, cortex, hippocampus, and thalamus regions-of-interest (ROIs) in the only/central slice (Figure 2a,b). For the OXT cohort, the Q2TIPS images were motion and distortion corrected before calculating CBF maps. The global CBF was calculated per subject as the mean across the whole brain.
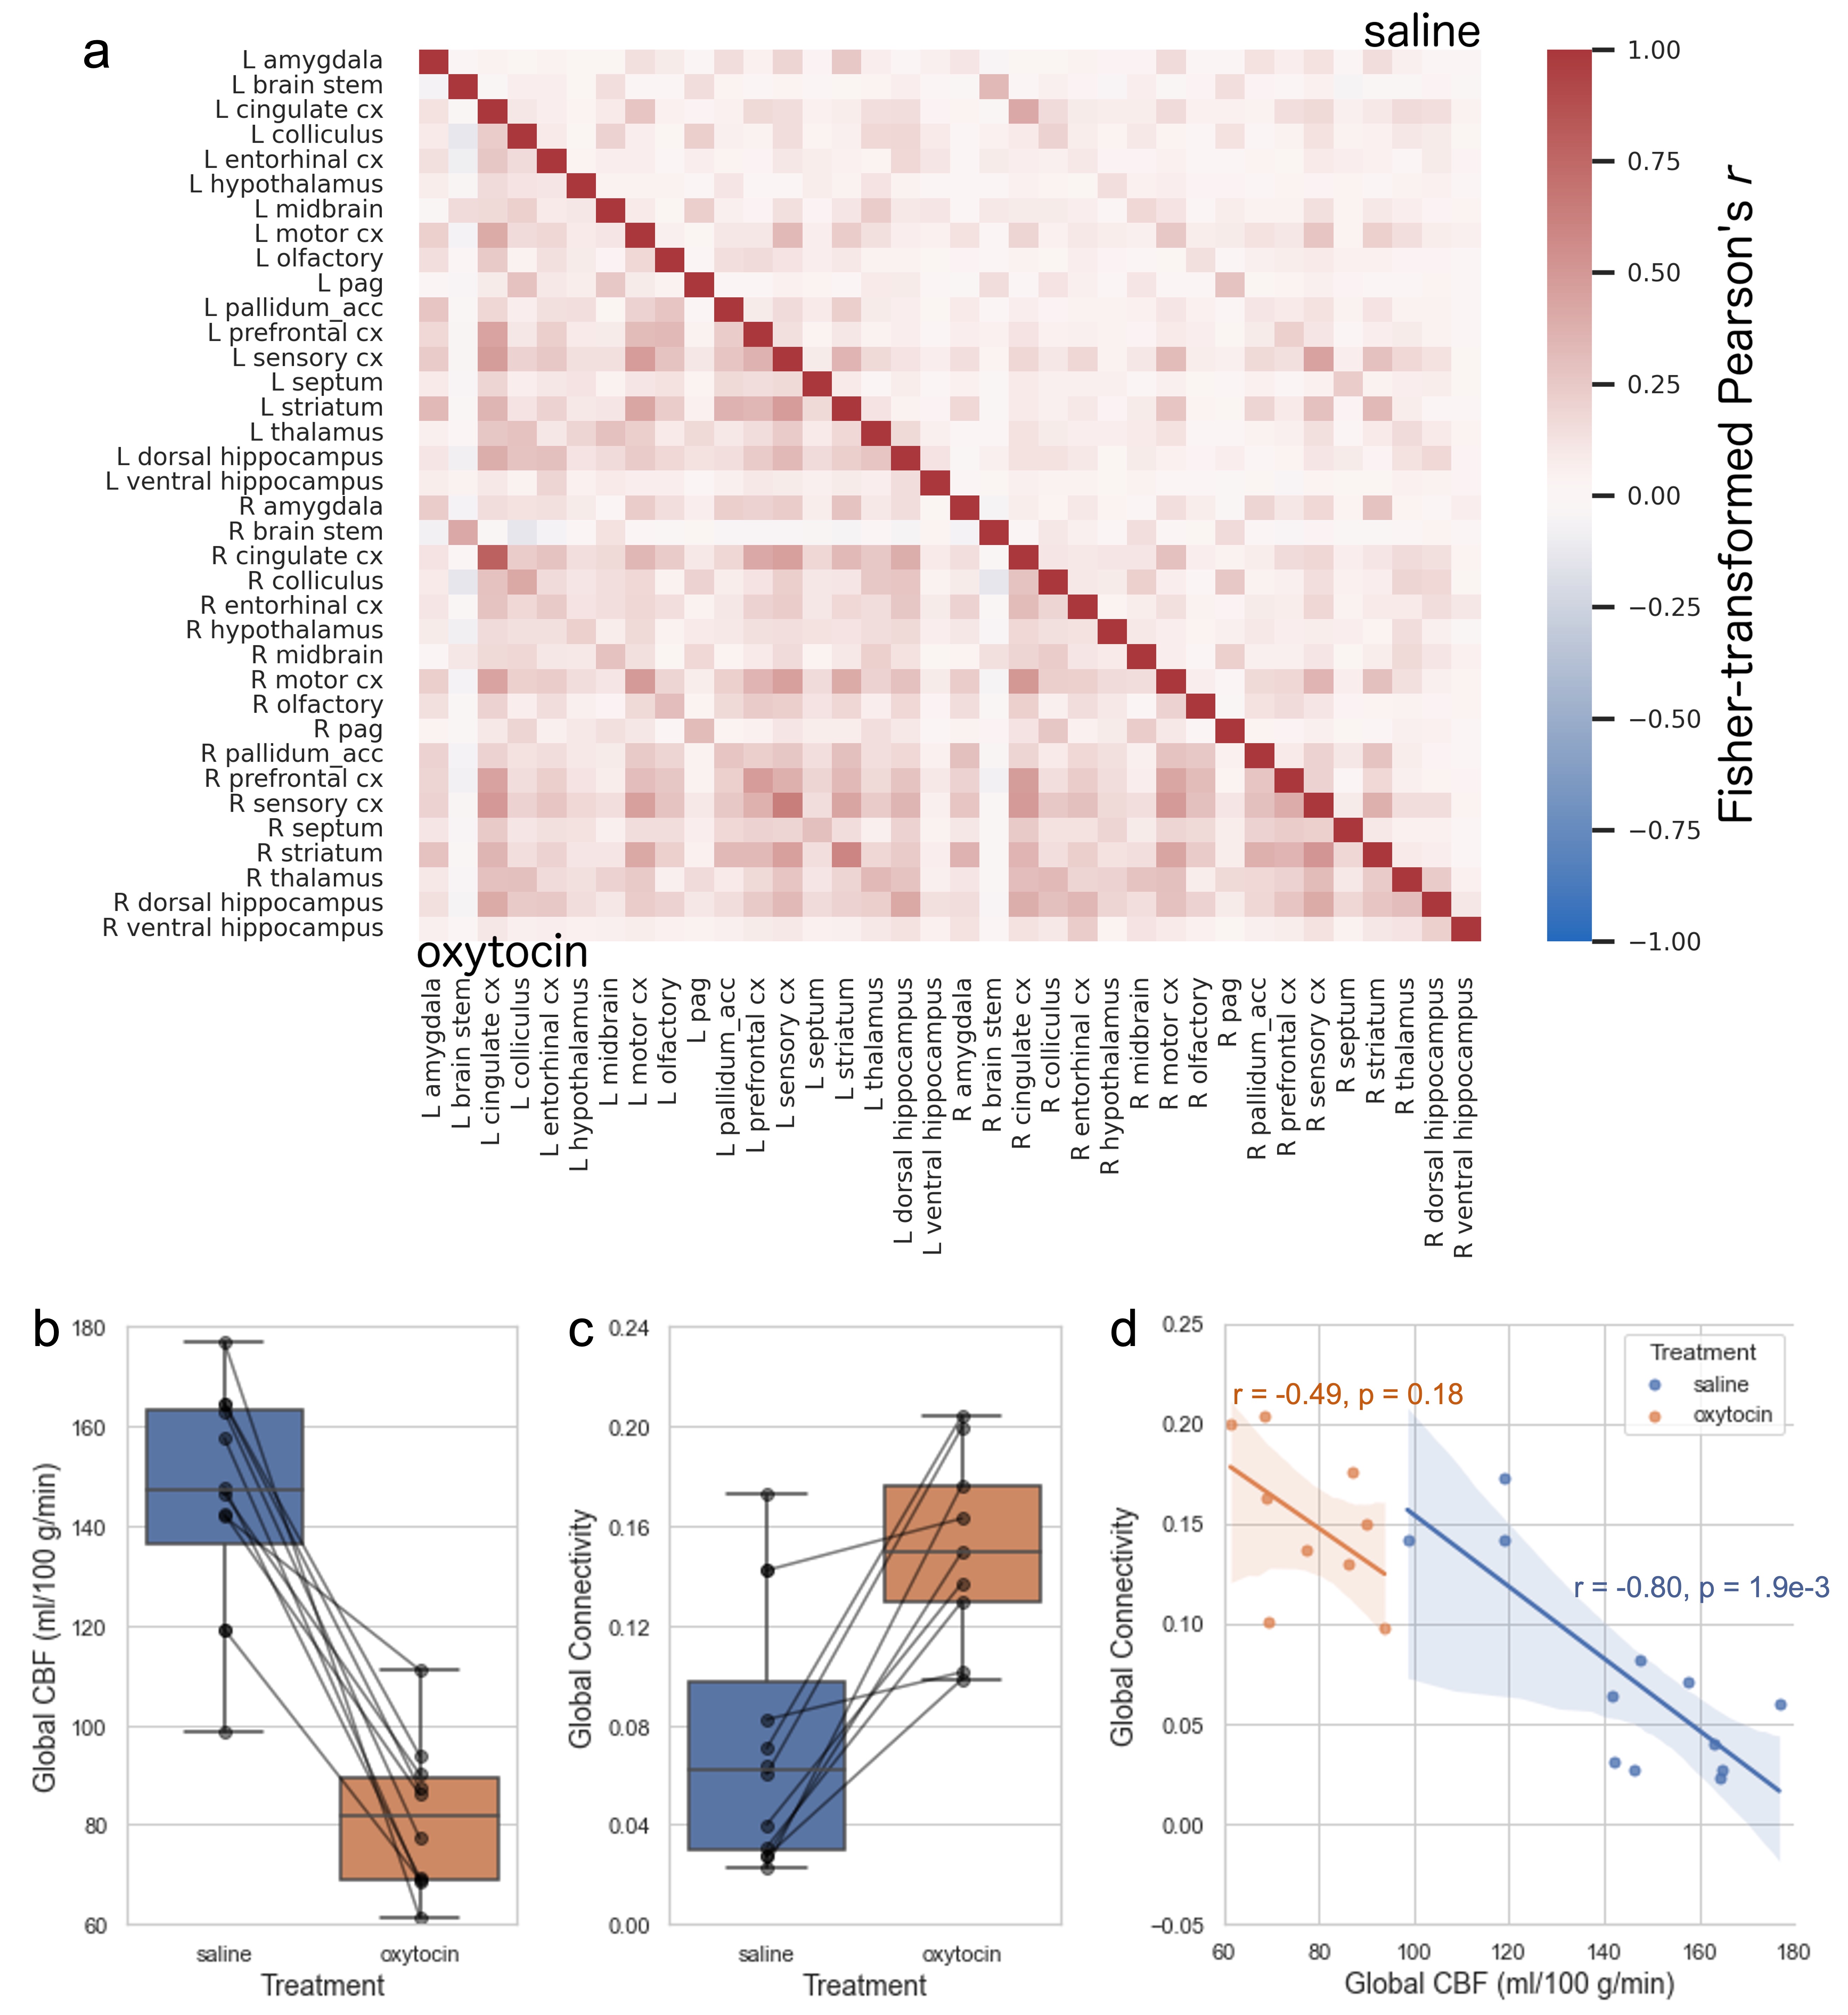
BOLD fMRI images were pre-processed with slice-timing, motion, and distortion correction; spatial smoothing; and simultaneous nuisance regression (motion, vascular and ventricular signal) and bandpass filtering (0.01–0.2 Hz). The filtered image was registered via the structural image to the Allen Mouse Brain Atlas. Mean time courses were extracted from 36 gray matter ROIs. Functional connectivity was calculated as the Fisher-transformed Pearson correlation between each pair of time courses, and the global connectivity calculated per subject as the mean of all functional connectivity values.
Results
CBF values measured using FAIR and Q2TIPS correlated strongly in all four regions (Figure 2c). Bland-Altman analysis revealed a small, fixed bias of 6.85 ml/100 g/min (p=0.06) and no proportional bias (p=0.21) with all regions pooled (Figure 2d). However, Q2TIPS CBF was systematically lower in the amygdala (p=3.4e-3) and higher in the hippocampus (p=1.9e-3), while there were proportional biases in the cortex (p=7.7e-3) and thalamus (p=5.3e-3).In the OXT cohort, paired t-tests revealed that mice exhibited increased self-grooming behavior after OXT vs. saline administration (duration: 75.9±55.4 s vs. 7.2±5.6 s, p=1.2e-3; number of bouts: 16.5±4.6 vs. 2.7±1.8, p<0.0001), confirming the OXT dose was behaviorally relevant and had central effects4.
The OXT scan sessions of two mice were excluded because they did not remain stably anesthetized under 1% isoflurane. The global connectivity of another mouse during its OXT session was excluded as a statistical outlier (>1.5*IQR+Q3).
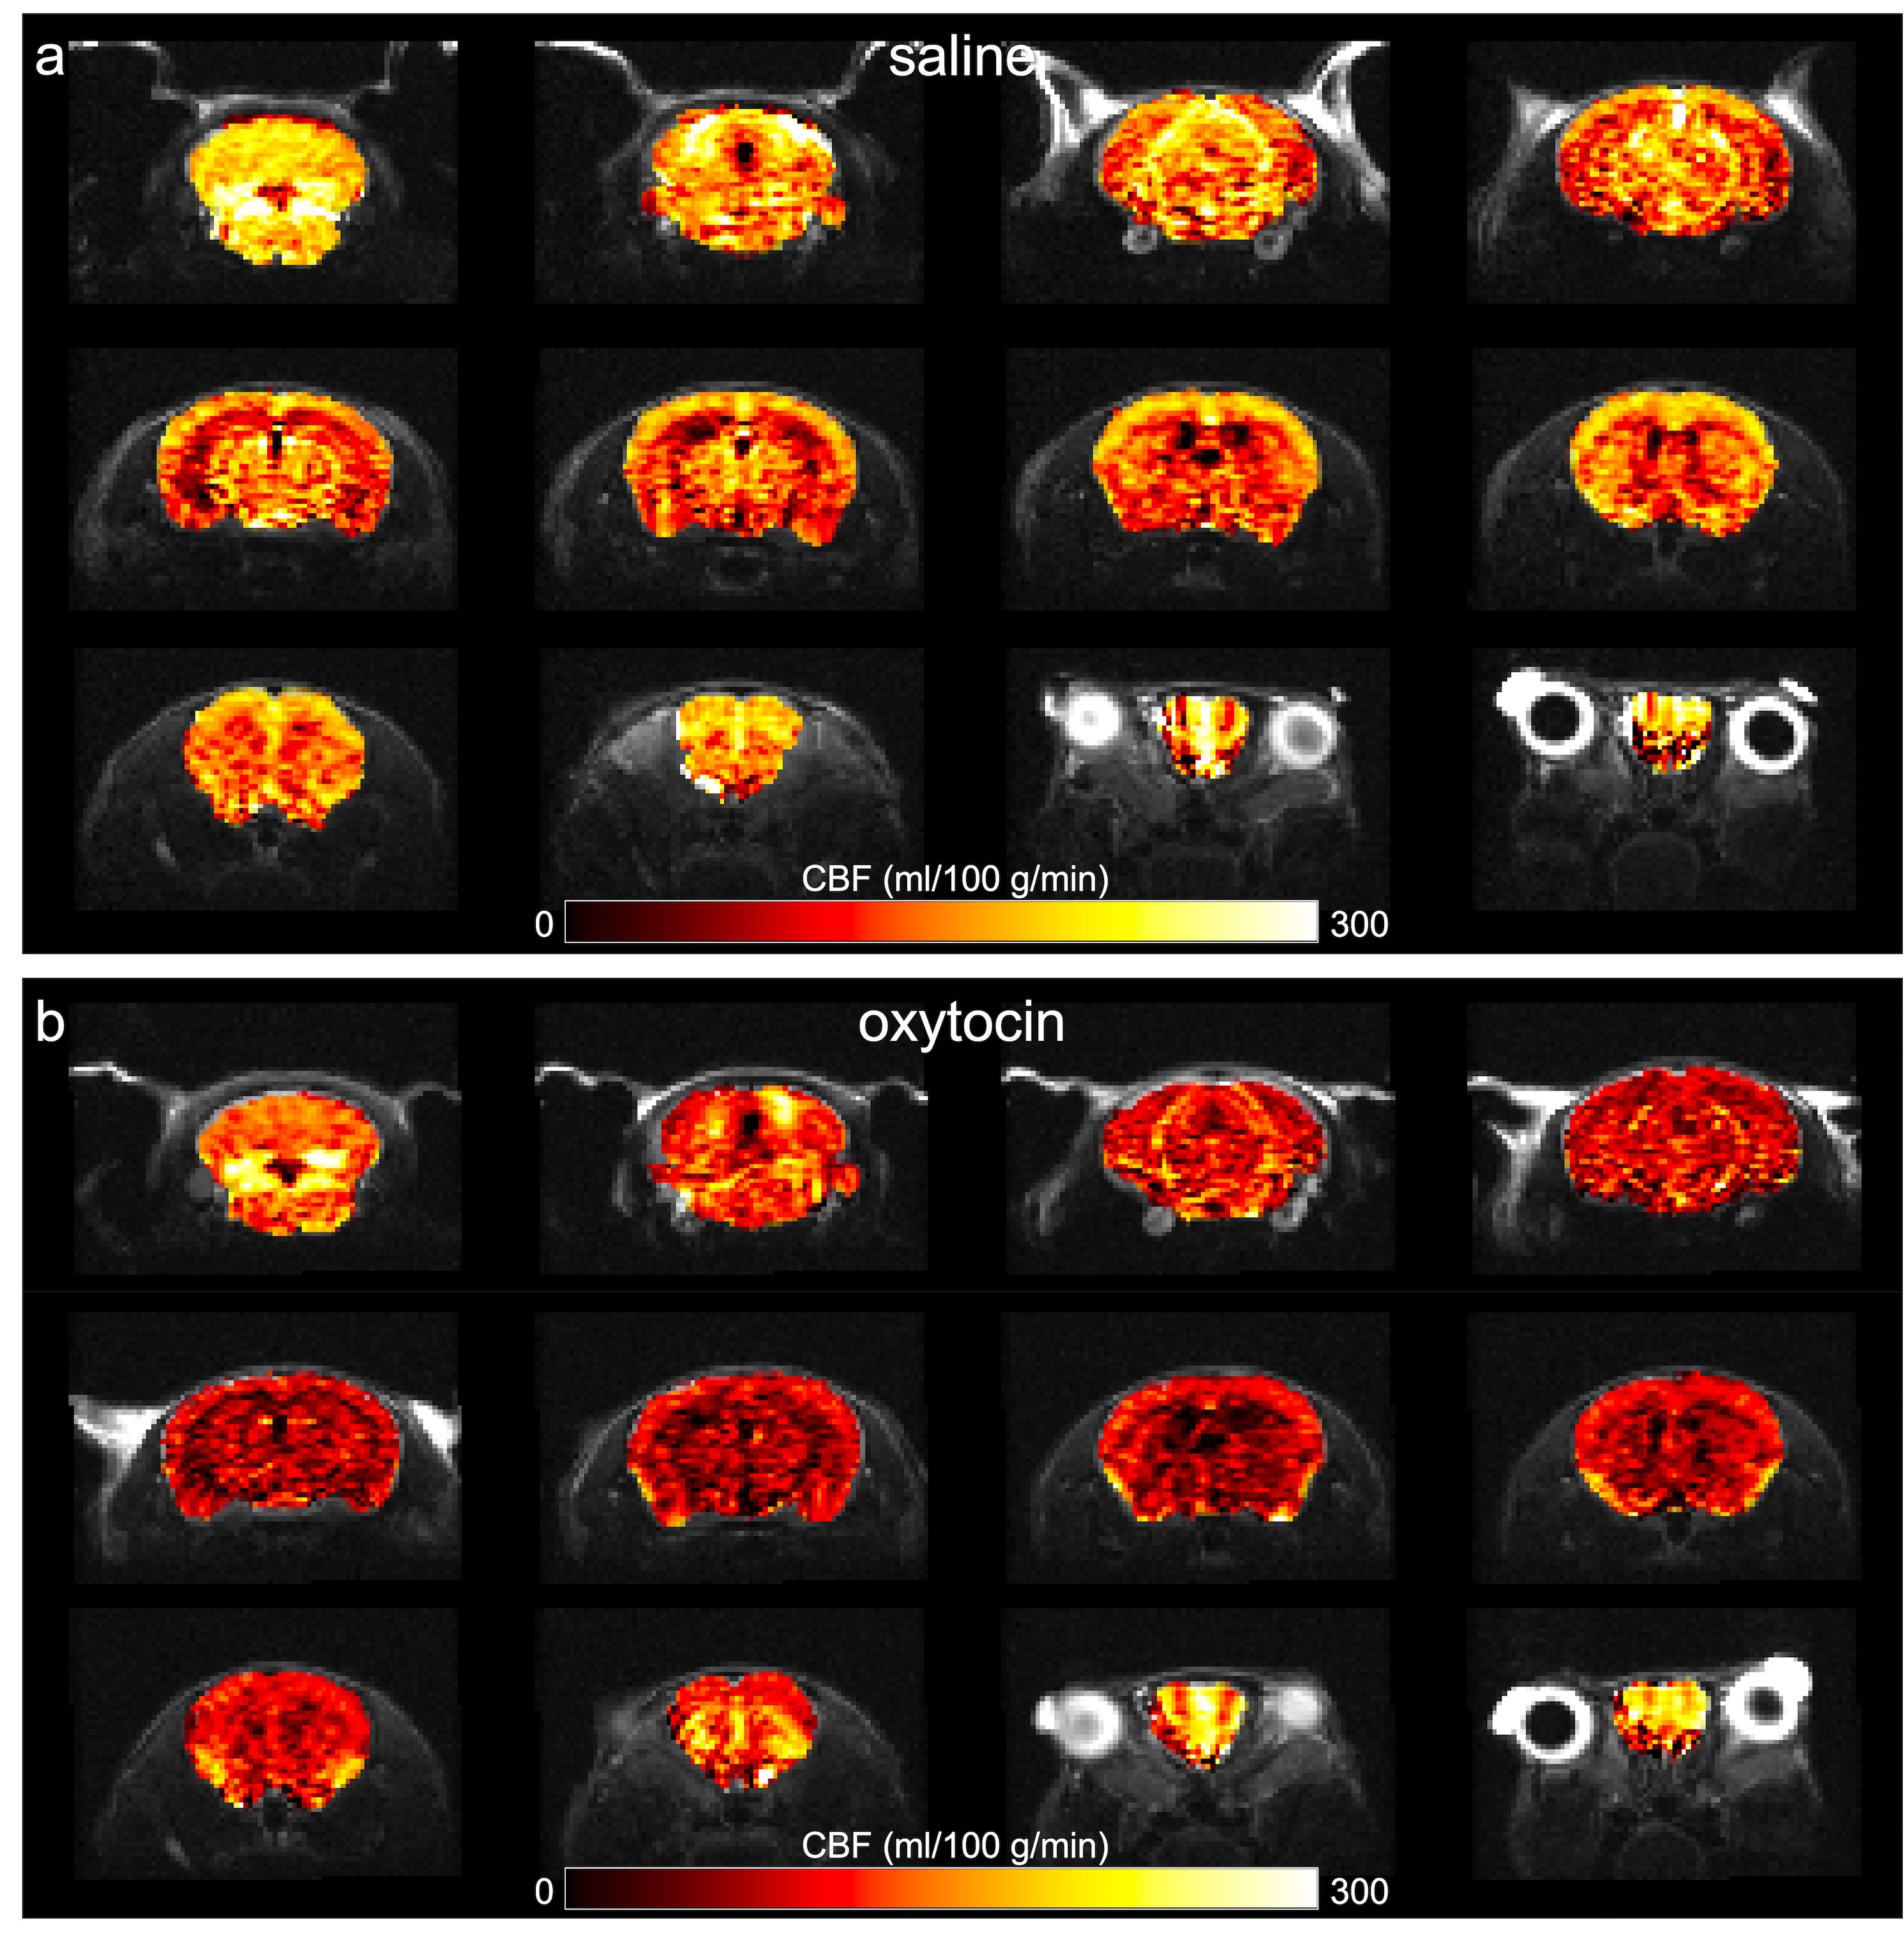
ASL and BOLD fMRI acquisitions commenced 41±10 and 56±12 min after treatment, respectively. Paired t-tests revealed that OXT caused a global decrease in CBF (-46±12%, p=5.7e-6, Figure 3, Figure 4b) and an increase in global connectivity (266±203%, p=4.1e-4, Figure 4a,c). There was a strong inverse correlation between global CBF and global connectivity across the pooled sessions (r=-0.84, p=2.4e-6) as well as within the saline session (Figure 4d).
Discussion
While there was some spatially varying bias between the CBF values derived from the Q2TIPS and standard Bruker FAIR methods, the two were generally in good agreement. Thus, Q2TIPS is a promising option for multi-slice ASL in mice with no special hardware requirements.Our finding that OXT reduces CBF while increasing functional connectivity is novel yet corroborates a recent concept of mutual exclusivity between high activity and high functional connectivity5. This has interesting implications for understanding brain disorders and merits further investigation.
Acknowledgements
No acknowledgement found.References
- Kim, S.G., Quantification of relative cerebral blood flow change by flow-sensitive alternating inversion recovery (FAIR) technique: application to functional mapping. Magn Reson Med, 1995. 34(3): p. 293-301.
- Luh, W.M., et al., QUIPSS II with thin-slice TI1 periodic saturation: a method for improving accuracy of quantitative perfusion imaging using pulsed arterial spin labeling. Magn Reson Med, 1999. 41(6): p. 1246-54.
- Alsop, D.C., et al., Recommended implementation of arterial spin-labeled perfusion MRI for clinical applications: A consensus of the ISMRM perfusion study group and the European consortium for ASL in dementia. Magn Reson Med, 2015. 73(1): p. 102-16.
- Drago, F., et al., Oxytocin potently enhances novelty-induced grooming behavior in the rat. Brain Res, 1986. 368(2): p. 287-95.
- Zarei, M., et al., High activity and high functional connectivity are mutually exclusive in resting state zebrafish and human brains. BMC Biol, 2022. 20(1): p. 84.
Figures