3928
Imaging the transmembrane pH gradient in gliomas1Radiology & Biomedical Imaging, Yale University, New Haven, CT, United States, 2Biomedical Engineering, Yale University, New Haven, CT, United States
Synopsis
Keywords: Molecular Imaging, Cancer, transmembrane pH
Extracellular acidosis in relation to intracellular milieu is a unique feature of the tumor microenvironment. The difference between intracellular pH (pHi) and extracellular pH (pHe) is much larger in tumors than normal tissue. Measuring the transmembrane pH gradient (ΔpH=pHi–pHe) could provide a tool for assessing tumor aggressiveness, monitoring treatment efficacy, guiding localized drug delivery, and understanding tumor responsiveness. This work establishes transmembrane pH gradient imaging in brain tumors. We observed a significantly higher transmembrane pH gradient in RG2 tumors compared to normal brain. Decreasing transmembrane pH gradient may serve as a functional biomarker for positive therapeutic outcome.
Purpose
Development of an MR-based platform for transmembrane pH gradient imaging in gliomas.Introduction
A unique feature of the tumor microenvironment is extracellular acidosis in relation to intracellular milieu (Warburg effect)1. Metabolic reprogramming in tumors results in overproduction of H+ ions and lactate, which are extruded from the cells to support tumor survival and progression. The difference between intracellular pH (pHi) and extracellular pH (pHe) is much larger in tumors than normal tissue2. The most aggressive and metastatic phenotypes have tumor pHe in range of 6.2 – 7.03, 4, and tumor pHi is either neutral or alkaline (pH = 7.0 – 7.4)1. Cancer cells require an alkaline pHi to sustain the function of intracellular machinery essential for glycolysis (i.e. glycolytic enzymes)5, 6 . Moreover, controlling the transmembrane pH difference represents an essential therapeutic target7, and could regulate drug entry into cells4, 8. Measuring the transmembrane pH gradient (ΔpH = pHi–pHe) would be beneficial clinically by providing a tool for assessing tumor aggressiveness, monitoring treatment efficacy, guiding localized drug delivery, and understanding tumor responsiveness.Methods
Fischer 344 rats were implanted with RG2 tumors, which were allowed to grow to 2-3 mm diameter. For the MR scans, the animals were anesthetized (2-3% isoflurane), positioned in a 3D-printed animal holder and artificially ventilated (70% N2O, 30% O2). An tail vein line was inserted for TmDOTP5- infusion (15µl/min for 90 minutes). A water‐heating pad was used to maintain the body temperature in the physiological range (36–37 °C) throughout the experiment. The body temperature was measured with a rectal optical probe. The MR data was obtained on a 9.4T Bruker (Billerica, MA, USA) horizontal-bore spectrometer. pHi was measured with Amine and Amide Concentration-Independent Detection (AACID)9 before TmDOTP5- infusion using an echo-planar spin-echo imaging sequence with an FOV of 32mm×32mm, 1 slice of 1mm thickness, a TR of 8s, and an image matrix of 64×64, for a voxel resolution of 0.5mm×0.5mm×0.5mm. A 4s continuous-wave of 1.5µT was used for saturation of 70 offset frequencies specifically chosen to accurately define the amide/amine peaks. pHe was measured with Biosensor Imaging of Redundant Deviation in Shifts (BIRDS)10 using a 3D chemical shift imaging (CSI) sequence with a FOV of 25mm×15mm×25mm, 1089 spherical encoding steps, TR=5ms, and a voxel resolution of 1x1x1mm3. The pHe was calculated from the H2, H3 and H6 chemical shifts of TmDOTP5-.10 The pHe images were resampled using bilinear interpolation to match the 0.5mm×0.5mm×0.5mm resolution of pHi maps from AACID.Results
For both BIRDS and AACID the pHe (Fig.1A) and pHi (Fig.1B) images were overlaid on the T1–weighted images to localize the RG2 tumors and delineate normal brain regions. The results show a significantly lower pHe (6.7±0.2) in RG2 tumors compared to normal brain (7.2±0.1, p<0.001, Fig.1A). The pHi was only slightly higher in tumors (7.5±0.2) compared to normal brain (7.3±0.2, p<0.01, Fig.1B). As a result, the transmembrane pH gradient was significantly higher inside the RG2 tumors (0.7±0.2) when compared to normal brain (0.1±0.1, p<0.001, Fig.1C).Discussion
This work establishes an MR-based platform for transmembrane pH gradient imaging in brain tumors. Because most tumors are hyperglycolytic and possess a large transmembrane pH gradient, decreasing this gradient may serve as a functional biomarker for positive therapeutic outcome.Acknowledgements
This work was supported by NIH (R01 EB-023366).References
1. Gatenby RA, Gillies RJ. Why do cancers have high aerobic glycolysis? Nat Rev Cancer 2004. 4(11): p. 891-9.
2. Gerweck LE. The pH difference between tumor and normal tissue offers a tumor specific target for the treatment of cancer. Drug Resist Updat 2000. 3(1): p. 49-50.
3. Mahoney BP, Raghunand N, Baggett B, Gillies RJ. Tumor acidity, ion trapping and chemotherapeutics. I. Acid pH affects the distribution of chemotherapeutic agents in vitro. Biochem Pharmacol 2003. 66(7): p. 1207-18.
4. Raghunand N, Mahoney BP, Gillies RJ. Tumor acidity, ion trapping and chemotherapeutics. II. pH-dependent partition coefficients predict importance of ion trapping on pharmacokinetics of weakly basic chemotherapeutic agents. Biochem Pharmacol 2003. 66(7): p. 1219-29.
5. Park SJ, Smith CP, Wilbur RR, Cain CP, Kallu SR, Valasapalli S, Sahoo A, Guda MR, Tsung AJ, Velpula KK. An overview of MCT1 and MCT4 in GBM: small molecule transporters with large implications. Am J Cancer Res 2018. 8(10): p. 1967-1976.
6. Harguindey S, Polo Orozco J, Alfarouk KO, Devesa J. Hydrogen Ion Dynamics of Cancer and a New Molecular, Biochemical and Metabolic Approach to the Etiopathogenesis and Treatment of Brain Malignancies. Int J Mol Sci 2019. 20(17).
7. Gerweck LE. Tumor pH: implications for treatment and novel drug design. Semin Radiat Oncol 1998. 8(3): p. 176-82.
8. Larsen AK, Escargueil AE, Skladanowski A. Resistance mechanisms associated with altered intracellular distribution of anticancer agents. Pharmacol Ther 2000. 85(3): p. 217-29.
9. McVicar N, Li AX, Gonçalves DF, Bellyou M, Meakin SO, Prado MA, Bartha R. Quantitative tissue pH measurement during cerebral ischemia using amine and amide concentration-independent detection (AACID) with MRI. J Cereb Blood Flow Metab 2014. 34(4): p. 690-8.
10. Coman D, Trubel HK, Rycyna RE, Hyder F. Brain temperature and pH measured by (1)H chemical shift imaging of a thulium agent. NMR Biomed 2009. 22(2): p. 229-39.
Figures
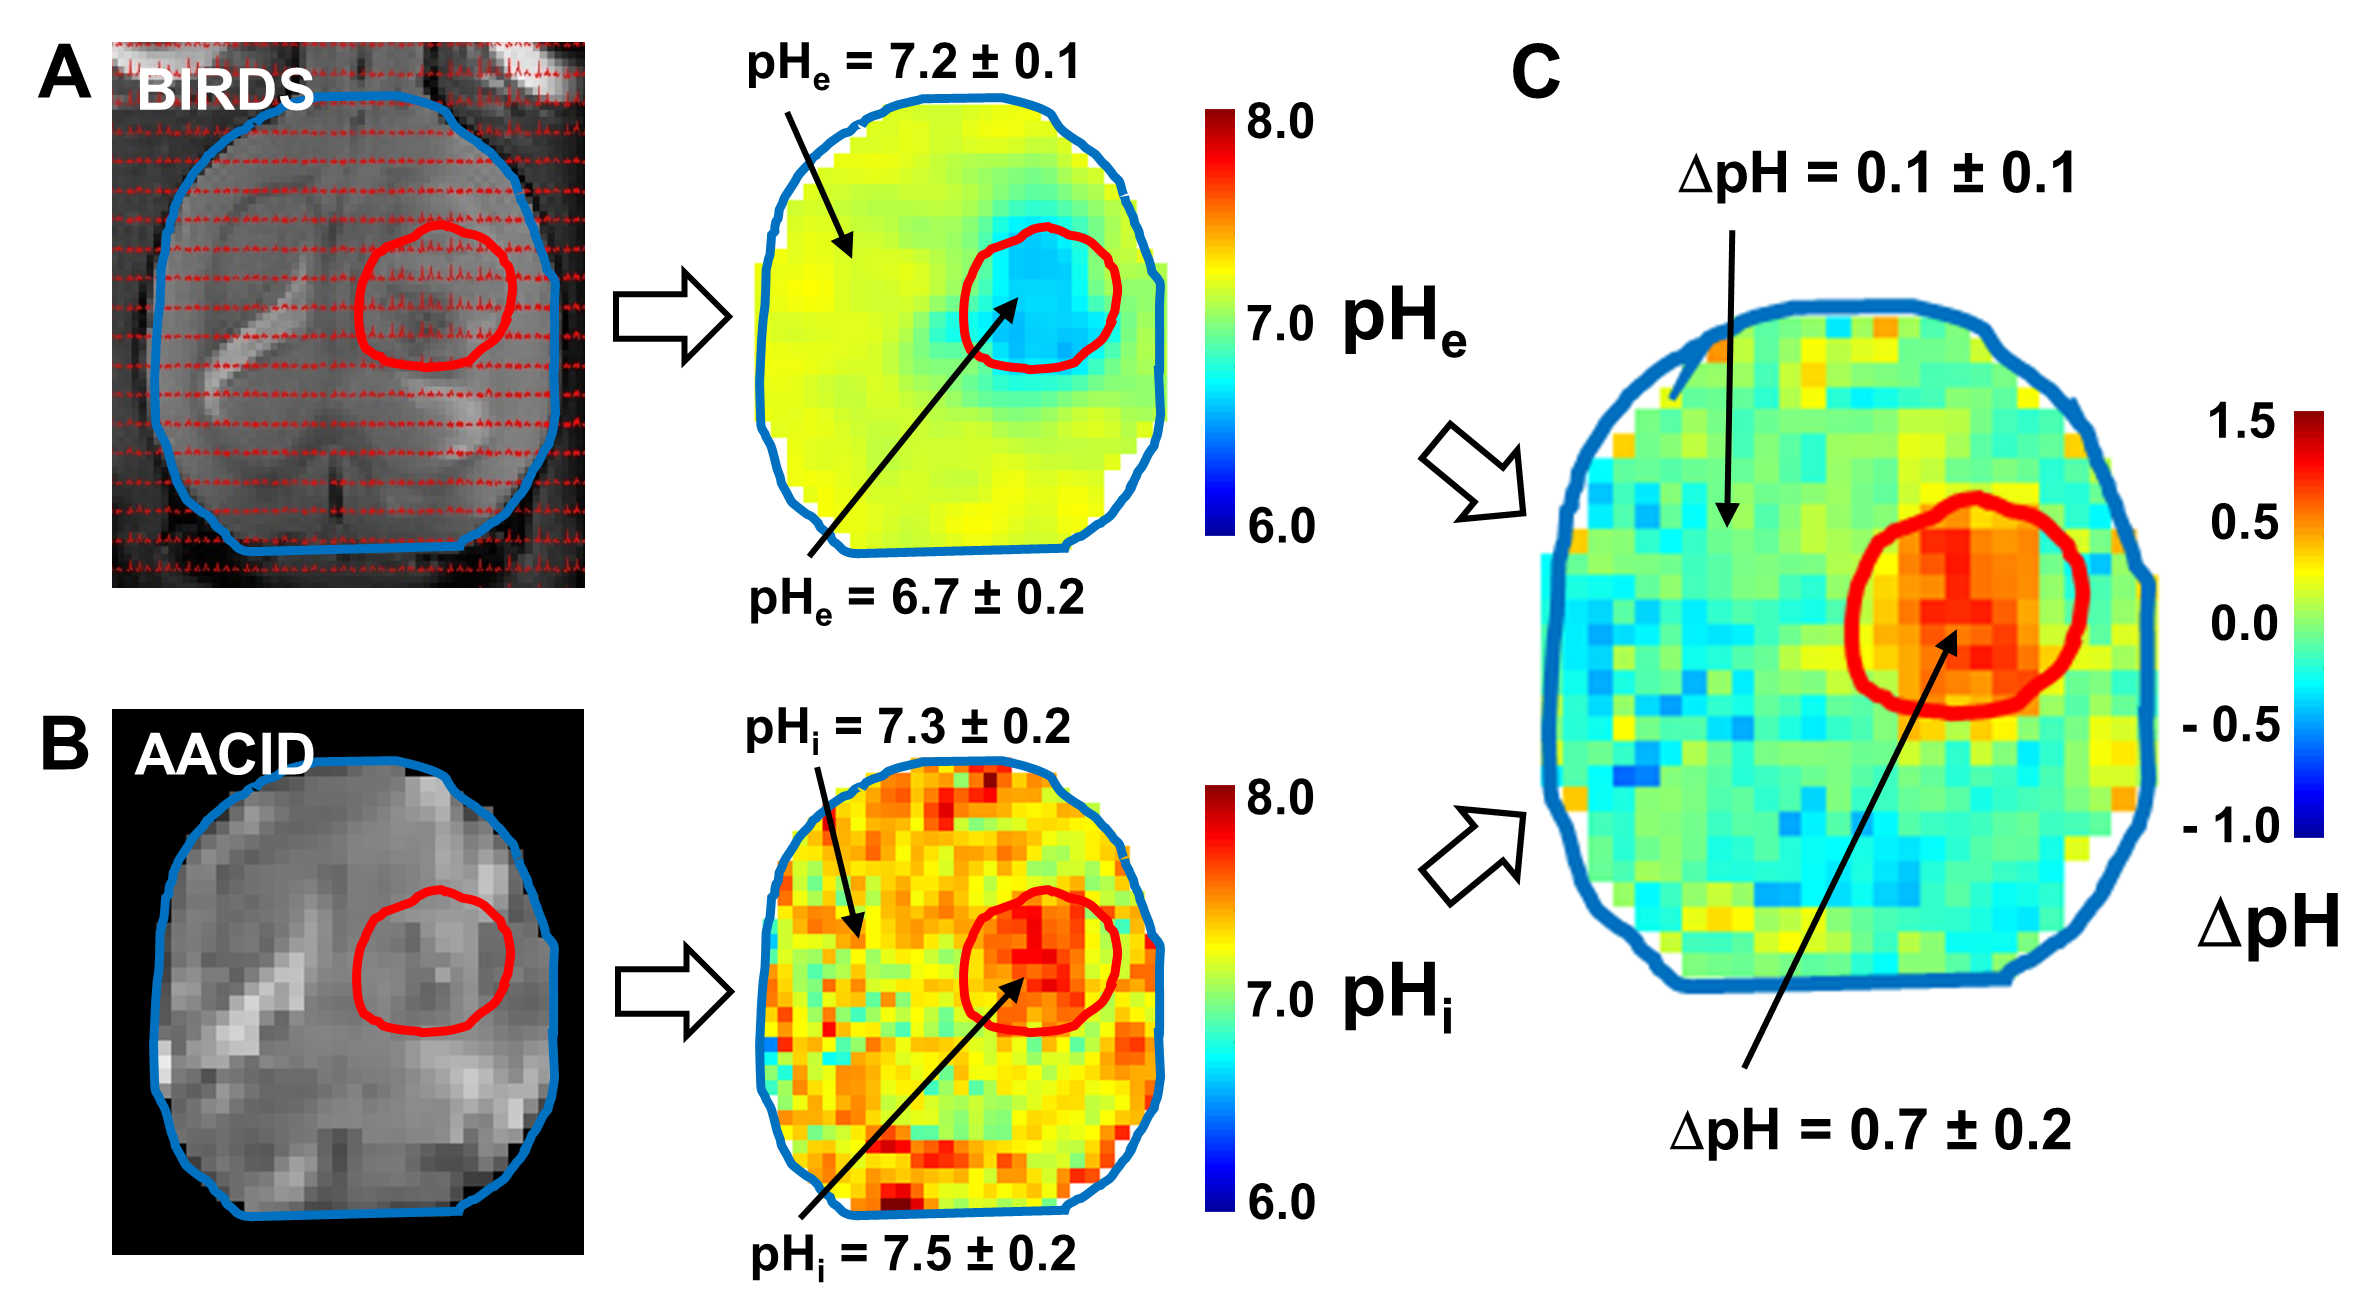
Figure 1. Measurement of transmembrane pH gradient in RG2 gliomas. pHe from BIRDS (A) and pHi from AACID (B) were used to calculate the transmembrane pH gradient (C).