3924
Metabolic Activity Diffusion Imaging [MADI] of Rat Brain Glioma1AIRC, OHSU, Portland, OR, United States, 2Neurology, OHSU, Portland, OR, United States, 3Diagnostic Radiology, OHSU, Portland, OR, United States, 4Research Cores and Shared Resources, OHSU, Portland, OR, United States
Synopsis
Keywords: Molecular Imaging, Metabolism, Cancer
We compared the novel DWI MRI-based metabolic activity [MA] imaging approach [MADI] to 18FDG-PET, employing an in vivo rat glioma model. The MADI-derived parameter, kio*V product, is proportional to Na+/K+ ATPase [NKA] activity, the primary cellular energy consumer. The kioV decreased within the tumor vs. contralateral while 18FDG uptake increased. This is consistent with the Warburg effect in glioma, which activates glucose uptake but also switches energy production from mitochondrial oxidative phosphorylation to glycolysis, thus reducing overall ATP production and NKA activity. MADI expands DWI MRI utility, providing a novel, noninvasive MA imaging method, with greater resolution than PET.
Introduction
Options for clinical metabolic activity [MA] imaging are limited. Positron Emission Tomography (PET) and 13C MRSI have poor resolution and require radioactive or hyperpolarized tracers. A novel high-resolution, non-invasive, MRI-based, metabolic activity imaging approach [MADI] has been developed.1‑3 MADI provides cytometric information (cell volume and density: V and ρ) in addition to MA. It is based on finding a large component of trans‑cytolemmal water exchange is MA-driven.1-3 MADI quantifies this as kio, the homeostatic cellular H2O efflux rate constant. This active water cycling (AWC) is coupled to the MA of Na+/K+ ATPase [NKA], the vital enzyme that maintains the trans-membrane Na+ and K+ ion concentration gradients, which in turn, drive the majority of active trans-membrane ion and metabolite transport for the cell. It has been recently determined that many coupled ion transport processes actively transport water with large stoichiometries (e.g., 500 H2O per K+ for the KCC4 cotransporter).4 NKA is the primary metabolic energy consumer in most cells. The kio*V product, which normalizes kio V-dependence, thus provides the homeostatic cellular NKA metabolic rate [cMRNKA], which has never before been quantified in vivo. In the current study we applied MADI to an in vivo rat glioma model.Methods
Syngeneic RG2 rat glioblastoma cells were implanted into the brains of Long Evans rats. At 9 days post-implantation rats were anesthetized with dexmedetomidine/ketamine (0.5/60 mg/kg, i.p.) and placed within a 11.7 T Bruker Biospec animal MRI system, with a volume (transmit) coil and a homebuilt surface (receive) coil. A spin echo DTI sequence was implemented with: FOV (20)2 mm2 with outer volume saturation, 0.312 x 0.312 x 1.5 mm voxel size, 10 slices, TR 2.5 s, TE 36.7 ms, diffusion gradient duration/separation 7/25 ms, b values 0, 100, 500, 1000, 2000, 3000, 4500, 6000. [s/(mm)2]. Post-contrast T1-weighted images (Omniscan 0.5-1.0 ml i.p.) were obtained: FOV 35x35 mm, TR 238 ms, FA 60°, 0.091 x 0.091 x 1.0 mm voxel size, 15 slices. One day post-MRI, 18F-FDG PET images were acquired using an Inveon (Siemens) MicroPET/SPECT/CT imaging system (1.4 mm spatial resolution) with 1 mCi of 18F-FDG (i.v. tail vein) and a 60 minute latency period. PET images were registered to the apparent diffusion constant (ADC) maps. MADI software matched voxel DWI signal b-space decays from a library of decays simulated for various kio, V and ρ combinations.Results
Figures 1A,B show an ADC map and post-contrast T1 weighted image, which clearly indicate the presence of intracerebral tumor [image right]. The ADC map indicates central hypo- and outer hyper-intense areas in the tumor region, a general observation for the n=6 rats. Comparison to the 1B post-Gd image suggests the hypo‑intense region is primarily tumor, while the hyper-intense region is likely tumor rim and/or a peritumoral region characterized by edema and inflammation (henceforth labeled “peritumoral”). The kioV map (Fig. 1C) reflects these regions, with decreased and increased values in the central tumor and peritumoral region, respectively. The co-registered 18FDG PET image (Fig. 1D) clearly indicates robust tumor 18FDG uptake, primarily associated with the central tumor region.Figures 2A,B bar graphs show mean kioV and 18FDG PET uptake values from n=6 rats, from the tumor and peritumoral regions defined by drawing ROIs on the ADC map, with their contralateral regions quantified within “mirror image” opposite hemisphere ROIs. The tumor kioV value is approximately half that of contralateral, while the 18FDG PET is approximately double; an inverse correlation. Peritumoral regions show a positive correlation, with both kioV and 18FDG PET uptake both having peritumoral values greater than contralateral (Figs. 2D,E). Figures 2C,F show the tumor cell density (ρ) is more than double the contralateral value, as expected. The peritumoral ρ is much closer to, and smaller than, the contralateral value, consistent with extracellular edema.
Conclusions
MADI disentangles the variables affecting DWI images and ADC maps. While decreased tumor ADC values are generally attributed to increased cell density (ρ), our study reveals instead, an important contribution relates to decreased AWC and MA, as indicated by the substantially decreased kioV. The novel ability of MADI to extract metabolic information from DWI has profound implications.We hypothesize that the substantially smaller central tumor kioV, which is proportional to cMRNKA, is related to the known switch from mitochondrial oxidative phosphorylation toward cytoplasmic glycolysis [Warburg Effect] in glioma. This crucial switch is invisible to 18FDG-PET since it occurs after the FDG rate-limiting step, and greatly decreases the production rate ATP/glucose/s, even though the glucose uptake rate glucose/s, reported by 18FDG-PET, is increased. This results in slower overall ATP production, lower steady state ATP levels, (despite increased glycolysis) and is consistent with the increased intracellular tumor Na+ generally observed.5
Importantly, this approach greatly expands DWI MRI utility to provide a novel, noninvasive method of metabolic activity imaging, with potentially much greater resolution than PET. Notably, an inverse MADI-18FDG-PET correlation was observed: increased tumor 18FDG-PET due to activated glucose uptake, and decreased tumor kioV due to decreased cMRNKA and overall ATP production, both of which are related to the Warburg effect.
We expect that MADI will have great utility in the diagnosis and monitoring of cancer and other pathologies. Future studies are planned of human glioblastoma.
Acknowledgements
We thank the Oregon Clinical & Translational Research Institute (OCTRI) in partnership with OHSU Technology Transfer for funding.References
1. Springer CS, Baker EM, Li X, Moloney B, Wilson GJ, Pike MM, Barbara TM, Rooney WD, Maki JH. Metabolic Activity Diffusion Imaging [MADI]: I. Metabolic, cytometric modeling and simulations. NMR Biomed. 2022; e4781.
2. Springer CS, Baker EM, Li X, Moloney B, Wilson GJ, Anderson VC, Sammi MK, Pike MM, M. G. Garzotto MG, R. P. Kopp RP, Coakley FV, Rooney WD, Maki JH. Metabolic activity diffusion imaging [MADI]: II. Non-invasive, high-resolution human brain imaging of sodium pump flux and cell metrics. NMR Biomed. 2022; e4782.
3. Neil JJ, Ackerman JJH, “Metabolic activity diffusion imaging (MADI): A new paradigm,” NMR Biomed. 2022; in press.
4. Zeuthen T. “Water-Transporting Proteins.” J. Membrane Biol. 2010; 234: 57-73, [DOI 10.1007/s00232-009-9216-y]
5. Leslie TK, James AD, Zaccagna F, Grist JT, Deen S, Kennerley A, Riemer F, Kaggie JD, Gallagher FA, Gilbert FJ, William J. Brackenbury WJ. Sodium homeostasis in the tumour microenvironment. Biochim Biophys Acta Rev Cancer. 2019 December 01; 1872(2): 188304. doi:10.1016/ j.bbcan.2019.07.001.
Figures
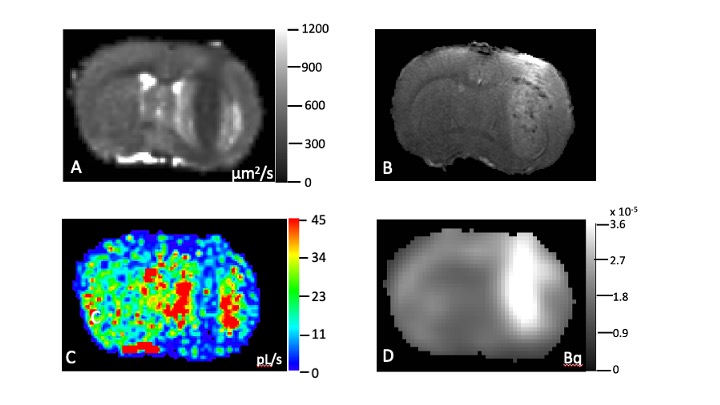
Figure 1 indicates typical coronal images/maps from the same rat and slice positions (non-brain regions removed) for A) ADC B) post-Gd T1, C) kio*V and D) 18FDG PET.
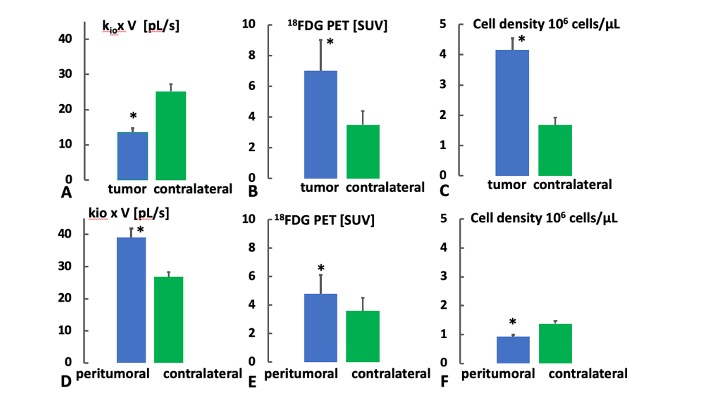
Figure 2 indicates mean values for kio*V, and PET [SUV} ρ (cell density) for the tumor and peritumoral region. The * indicate significant differences from contralateral (p<0.025, one tailed paired T test).