3923
Hyperpolarized [1-13C]pyruvate detects neuronal metabolic impairment in glucose transporter and pyruvate kinase deficient mice1Department of Physical Therapy and Rehabilitation Science, University of California San Francisco, San Francisco, CA, United States, 2Department of Radiology and Biomedical Imaging, University of California San Francisco, San Francisco, CA, United States, 3Gladstone Institute of Neurological Disease, Gladstone Institutes, San Francisco, CA, United States, 4Graduate Program in Biomedical Sciences, University of California San Francisco, San Francisco, CA, United States, 5UCSF/UCB Graduate Program in Bioengineering, University of California San Francisco, San Francisco, CA, United States, 6Koch Institute for Integrative Cancer Research and the Department of Biology, Massachusetts Institute of Technology, Boston, MA, United States, 7Department of Pathology, Microbiology, and Immunology, Vanderbilt Center for Immunobiology, Nashville, TN, United States, 8Dana-Farber Cancer Institute, Boston, MA, United States, 9Department of Neurology, University of California San Francisco, San Francisco, CA, United States, 10Graduate Program in Neuroscience, University of California San Francisco, San Francisco, CA, United States
Synopsis
Keywords: Hyperpolarized MR (Non-Gas), Neuro
We generated mice with deletion of the glucose transporter 3 (GLUT3cKO) or pyruvate kinase 1 (PKM1cKO) in CA1 hippocampal neurons. GLUT3cKO and PKM1cKO mice showed memory impairment. Hyperpolarized (HP) 13C magnetic resonance spectroscopic imaging showed that female, but not male, PKM1cKO mice had increased HP [1-13C]pyruvate-to-lactate conversion, while female GLUT3cKO mice had decreased conversion and brain volume, evaluated by T2-MRI. Fluorine-18-fluorodeoxyglucose ([18F]-FDG) positron emission tomography imaging did not detect changes, highlighting HP [1-13C]pyruvate’s potential to detect downstream alterations in brain glucose metabolism. Altogether, our findings demonstrated that neurons metabolize glucose through glycolysis in vivo, and require glycolysis for normal function.Introduction
Hyperpolarized 13C magnetic resonance spectroscopic imaging (HP 13C MRSI) is increasingly used to study brain metabolism in health and diseases, in preclinical models and patients1-6. Importantly, HP [1-13C]pyruvate detects [1-13C]lactate production in the brain, providing information on downstream glucose metabolism. Because of its capability to inform on metabolic fluxes, HP 13C MRSI provides complementary information to fluorine-18 fluorodeoxyglucose positron emission tomography ([18F]-FDG PET) imaging, which is well-established to image glucose uptake. Although the brain requires large amount of glucose, it remains controversial whether neurons import and metabolize functionally significant amount of glucose through glycolysis. To dissect out the contribution of neurons to glucose uptake and metabolism in vivo, we generated mouse models with postnatal deletion of the glucose transporter 3 (GLUT3) and pyruvate kinase 1 (PKM1) in neurons of the CA1 hippocampal region, a key structure involved in memory. We investigated whether GLUT3 or PKM1 deletion led to behavioral deficits and whether brain metabolic changes could be detected by HP 13C MRSI, anatomical T2-MRI, and [18F]-FDG PET imaging.Methods
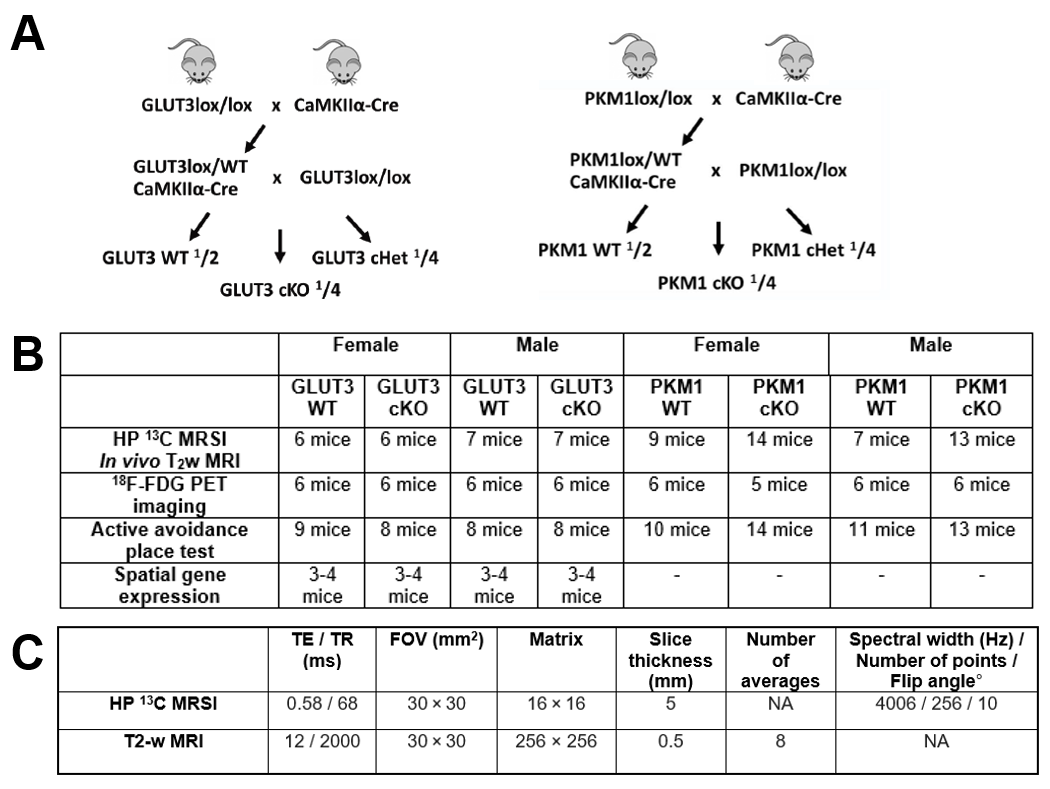
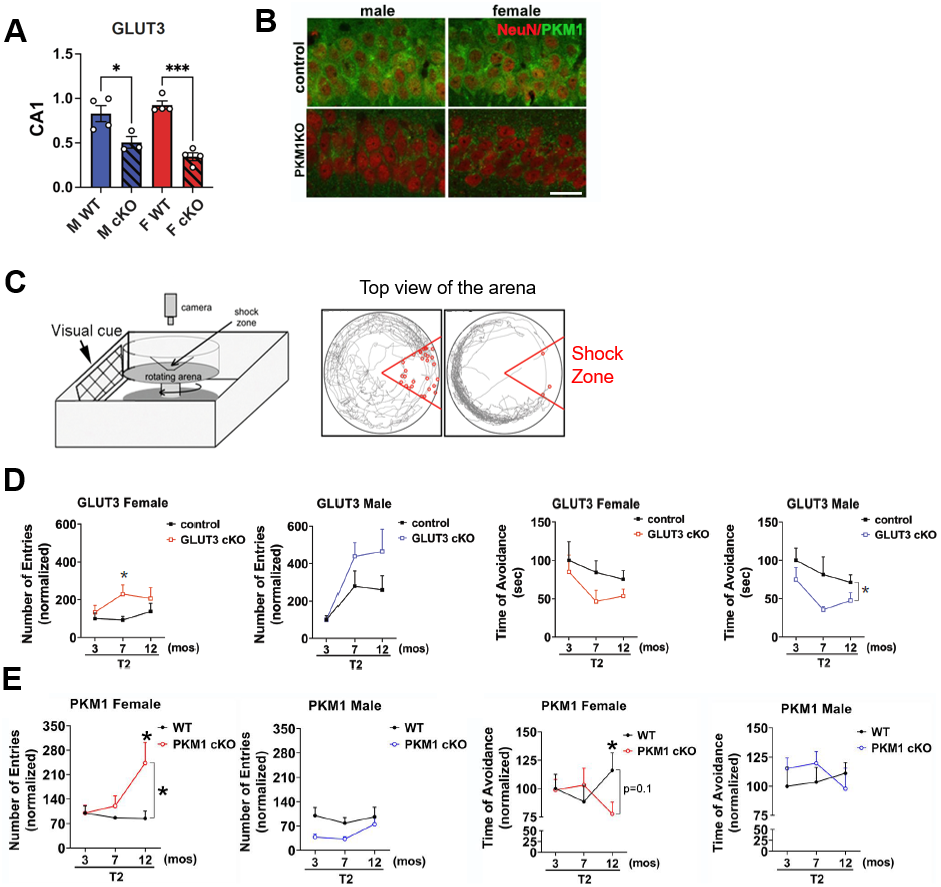
Animals: Floxed GLUT3 mice were bred with CamKII alpha (CamKCre) mice, which express Cre recombinase in essentially all CA1 neurons and in scattered forebrain neurons to obtain GLUT3cKO and littermate GLUT3WT controls. PKM1WT and PKM1cKO were obtained using a similar breeding approach (Figure 1A). Mice underwent PET, MRI, and behavioral testing as shown in Figure 1B.Behavioral analyses: The active place avoidance test was used to assess hippocampal-dependent spatial learning. Using visual cues, mice learn to avoid the shock zone of a rotating arena. The number of entrances into the shock zone was calculated.
PET/computerized tomography (CT) acquisitions and analyses: PET/CT was acquired 55 minutes after 18F-FDG intravenous injection (71±4.5μCi). We co-registered PET and T2-MR images using VivoQuant software to delineate the hippocampus and CA1 region based on MR contrast and calculated the corresponding mean percent-injected dose per grams (%ID/g) values.
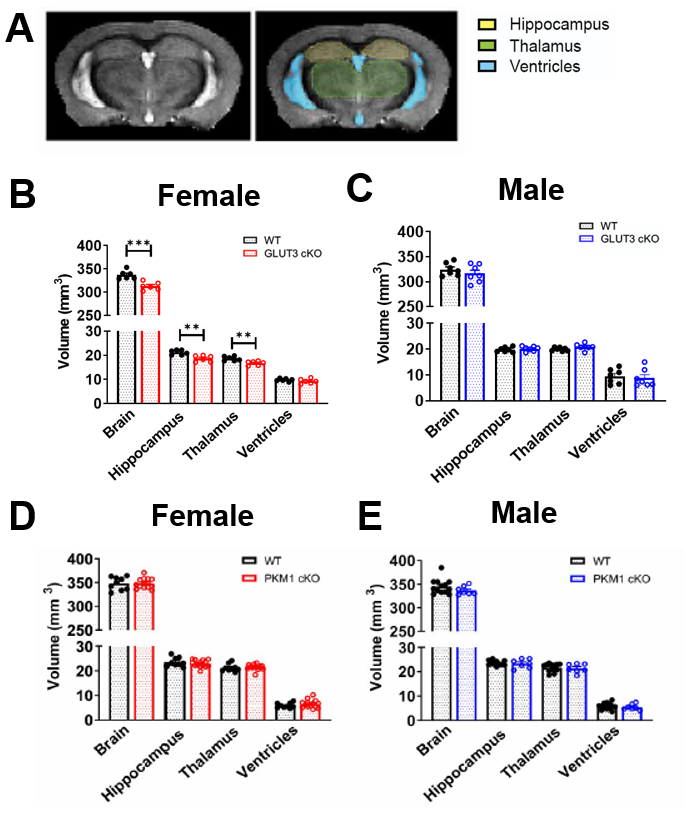
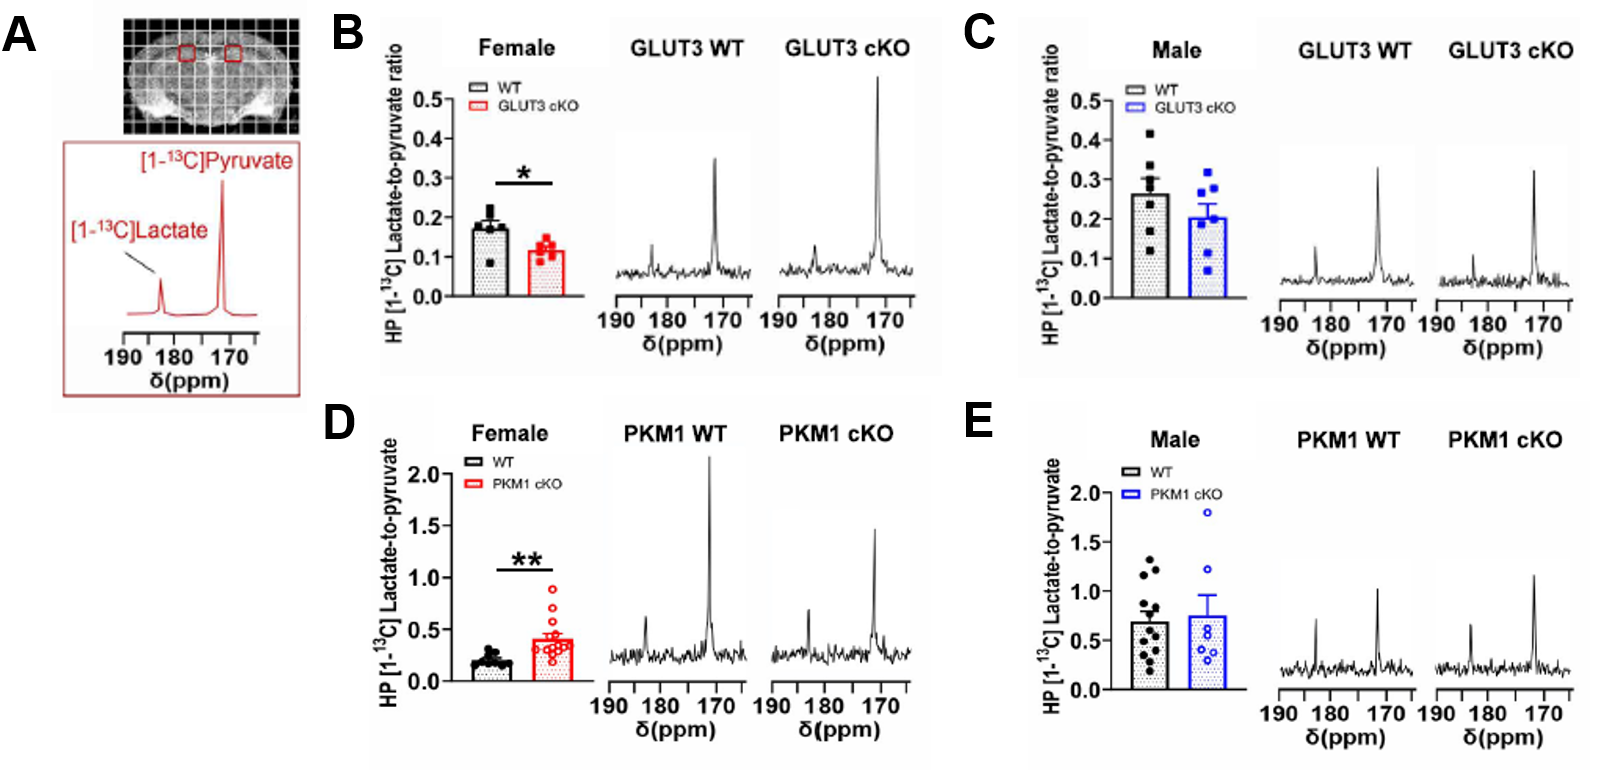
MR acquisitions and analyses: T2-MRI and HP 2D 13C CSI were acquired on a 14.1T MR scanner using the parameters shown in Figure 1C. For 13C MRS, 24μl [1-13C] pyruvate was polarized for ~1h in a Hypersense polarizer, dissolved in 4.5mL buffer (80mM NaOH in PBS), and data were acquired 18 seconds after intravenous injection. HP 13C MRSI data were analyzed using the SIVIC software and MATLAB. K-space dimensions were zero-filled by two. The area-under-the-curve of HP [1-13C]pyruvate and [1-13C]lactate Lorentzian fits were measured and [1-13C]lactate/pyruvate ratios were calculated. For analyses of T2-MRI data, brain, thalamus, ventricles, hippocampus and CA1 regions were delineated and the corresponding volumes were calculated.
Immunofluorescence: Immunofluorescence analyses were performed for PKM1 and neurons (NeuN).
Spatial Gene Expression: Spatial transcriptomics were acquired with Visium spatial gene expression kits (10X Genomics).
Statistical analyses: Welch ANOVA with Dunnett’s T3 multiple comparisons test, unpaired t-test, and Welch’s t tests were used to compare WT and cKO groups. *p<0.05, **p<0.01, ***p<0.001, ****p<0.001.
Results
We first confirmed that GLUT3 and PKM1 expression were decreased in GLUT3cKO and PKM1cKO mice (Figure 2.A-B).To determine if GLUT3 or PKM1 is required for normal hippocampal function, we examined how GLUT3cKO or PKM1cKO impacted spatial learning and memory assessed by active place avoidance. Higher number of entries and lower time of avoidance of the aversive shock zone reflected memory deficits in female and male GLUT3cKO and in female PKM1cKO. (Figure 2.C-E). Interestingly, male PKM1cKO did not show memory deficits.
T2-MRI revealed smaller brain, hippocampus and thalamus in female GLUT3cKO (Figure 3.A-B, p=0.0009, p=0.0033, p=0.0045, respectively), while ventricle size remained unchanged. No changes in brain regions were detected in male GLUT3cKO, and in female and male PKM1cKO (Figure 3.C-E).
Following injection of HP [1-13C]pyruvate, we observed production of [1-13C]lactate in the brain (Figure 4A). In the region containing hippocampus and CA1, we observed lower HP [1-13C]lactate-to-pyruvate ratios in female GLUT3cKO (p=0.0282), whereas this difference was not seen in males (Figure 4.B-C). We observed higher HP [1-13C]lactate-to-pyruvate ratios in female PKM1cKO (p=0.0018), but no difference in male PKM1cKO (Figure 4D-E).
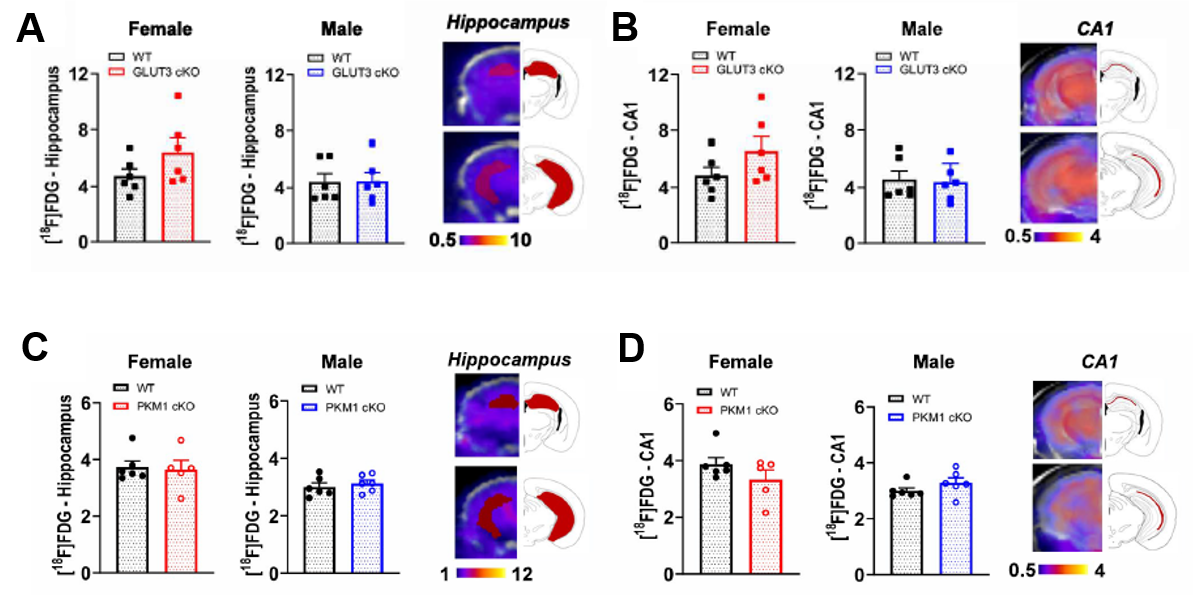
Interestingly, [18F]FDG PET signal from the hippocampus and CA1 did not detect any differences between GLUT3cKO and GLUT3WT, and between PKM1cKO and PKM1WT (Figure 5A-D).
Discussion
We showed that GLUT3 and PKM1 deletion in CA1 neurons led to memory impairment, establishing that glucose uptake and glycolysis are required to maintain normal neuronal function. MRI detected sex-specific alterations as HP [1-13C]pyruvate revealed metabolic changes in female PKM1cKO and GLUT3cKO, and T2-MRI detected smaller brain regions in female GLUT3cKO. Biological interpretation of this sex-specific HP change remains complex, however, it likely reflects not only the primary disruption in neuronal glycolysis, but also potential secondary compensatory changes in glial metabolism and neuro-glial coupling. MR acquisition parameters (flip angles) are likely to play a crucial role in the relative contribution of the HP lactate/pyruvate7, representing an area for future investigation. [18F]FDG-PET imaging remained unchanged following GLUT3 or PKM1 deletion, likely due to high background, or indicating that most signal originates from glial cells. Altogether our findings add to the growing evidence suggesting that HP 13C MRSI metabolic imaging has considerable clinical potential to study changes in brain energy metabolism in both health and disease.Acknowledgements
CG, HL, KN and MMC contributed equally to this work. This work was supported by National Institutes of Health RF1 AG064170 (to K.N. and M.M.C.), R01 NS102156 (M.M.C.), R21 AI153749 (M.M.C., C.G.), R01 CA168653 and R35 CA242379 (M.G.V.H.) and National Institutes of Health RR18928 (Gladstone Institutes). It was also supported by the UCSF Bakar Aging Research Institute (BARI, K.N.), the Alzheimer’s Association (H.L. and LLP), a Berkelhammer Award for Excellence in Neuroscience (Y.S.).References
1. Le Page, L. M., Guglielmetti, C., Taglang, C. & Chaumeil, M. M. Imaging Brain Metabolism Using Hyperpolarized (13)C Magnetic Resonance Spectroscopy. Trends Neurosci 43, 343-354, doi:10.1016/j.tins.2020.03.006 (2020).
2. Grist, J. T. et al. Quantifying normal human brain metabolism using hyperpolarized [1-(13)C]pyruvate and magnetic resonance imaging. Neuroimage 189, 171-179, doi:10.1016/j.neuroimage.2019.01.027 (2019).
3. Guglielmetti, C. et al. Hyperpolarized (13)C MR metabolic imaging can detect neuroinflammation in vivo in a multiple sclerosis murine model. Proc Natl Acad Sci U S A 114, E6982-E6991, doi:10.1073/pnas.1613345114 (2017).
4. Bogh, N. et al. Initial Experience on Hyperpolarized [1-(13)C]Pyruvate MRI Multicenter Reproducibility-Are Multicenter Trials Feasible? Tomography 8, 585-595, doi:10.3390/tomography8020048 (2022).
5. Hackett, E. P. et al. Imaging Acute Metabolic Changes in Patients with Mild Traumatic Brain Injury Using Hyperpolarized [1-(13)C]Pyruvate. iScience 23, 101885, doi:10.1016/j.isci.2020.101885 (2020).
6. Gordon, J. W. et al. Translation of Carbon-13 EPI for hyperpolarized MR molecular imaging of prostate and brain cancer patients. Magn Reson Med 81, 2702-2709, doi:10.1002/mrm.27549 (2019).
7. Bogh, N. et al. Lactate saturation limits bicarbonate detection in hyperpolarized (13) C-pyruvate MRI of the brain. Magn Reson Med 88, 1170-1179, doi:10.1002/mrm.29290 (2022).
Figures