3922
In vivo measurement of rat brain water content at 9.4T using super-resolution reconstruction1Institute of Neuroscience and Medicine-4, Forschungszentrum, Jülich, Germany, 2Institute of Neuroradiology, University Hospital Frankfurt, Frankfurt, Germany, 3Institute of Neuroscience and Medicine 11, INM-11, JARA, Forschungszentrum Jülich,, Jülich, Germany, 4JARA - BRAIN - Translational Medicine, Aachen, Germany, Aachen, Germany, 5RWTH Aachen University, Aachen, Germany
Synopsis
Keywords: Quantitative Imaging, Neurofluids, Super-resolution reconstruction, High-field MRI, ex vivo
Animal models have an indisputable role in the investigation of brain pathology. Investigating water content in vivo could lead to a better understanding of pathogenesis and hence, a robust technique to measure water content using MRI would be very beneficial. Here, we adapt a super-resolution-based technique, previously developed for humans, to the rat brain and report in vivo high-resolution (200μm isotropic) water content maps, obtained using a 9.4T MRI scanner. High resolution, isotropic water content maps of the rat brain are demonstrated. The water content values obtained using the proposed MR technique are compared with ex vivo wet/dry methods.Introduction
Water content in the mammalian brain is known to be very well regulated1. Local brain pathologies and systemic diseases have been shown to affect the brain water content2,3. Since animal models have an irreplaceable role in the study of brain diseases, a robust method to measure water content non-invasively in animals using MRI would allow us to study the changes in animal disease models over time and correlate the measured changes with the ex vivo methods including histology, thus enabling a better understanding of brain diseases. To date, very few studies have been performed to validate animal brain water content obtained by MRI against gold standard ex vivo wet/dry techniques4-7. Recently, Super-resolution reconstruction (SRR) techniques8 were combined with a modified version of the single-scan water content mapping technique9 to obtain accurate water content maps of the in vivo human brain at high resolution and isotropic resolution10,11. In the current work, we modify and adapt this SRR-based technique to perform high and isotropic resolution water content mapping in rats using a small animal 9.4 T MRI scanner. The proposed method is used to measure in vivo brain water content in eight healthy rats. We further validate the obtained water content values with the gold standard ex vivo wet/dry experiments12 of the excised rat brains.Methods
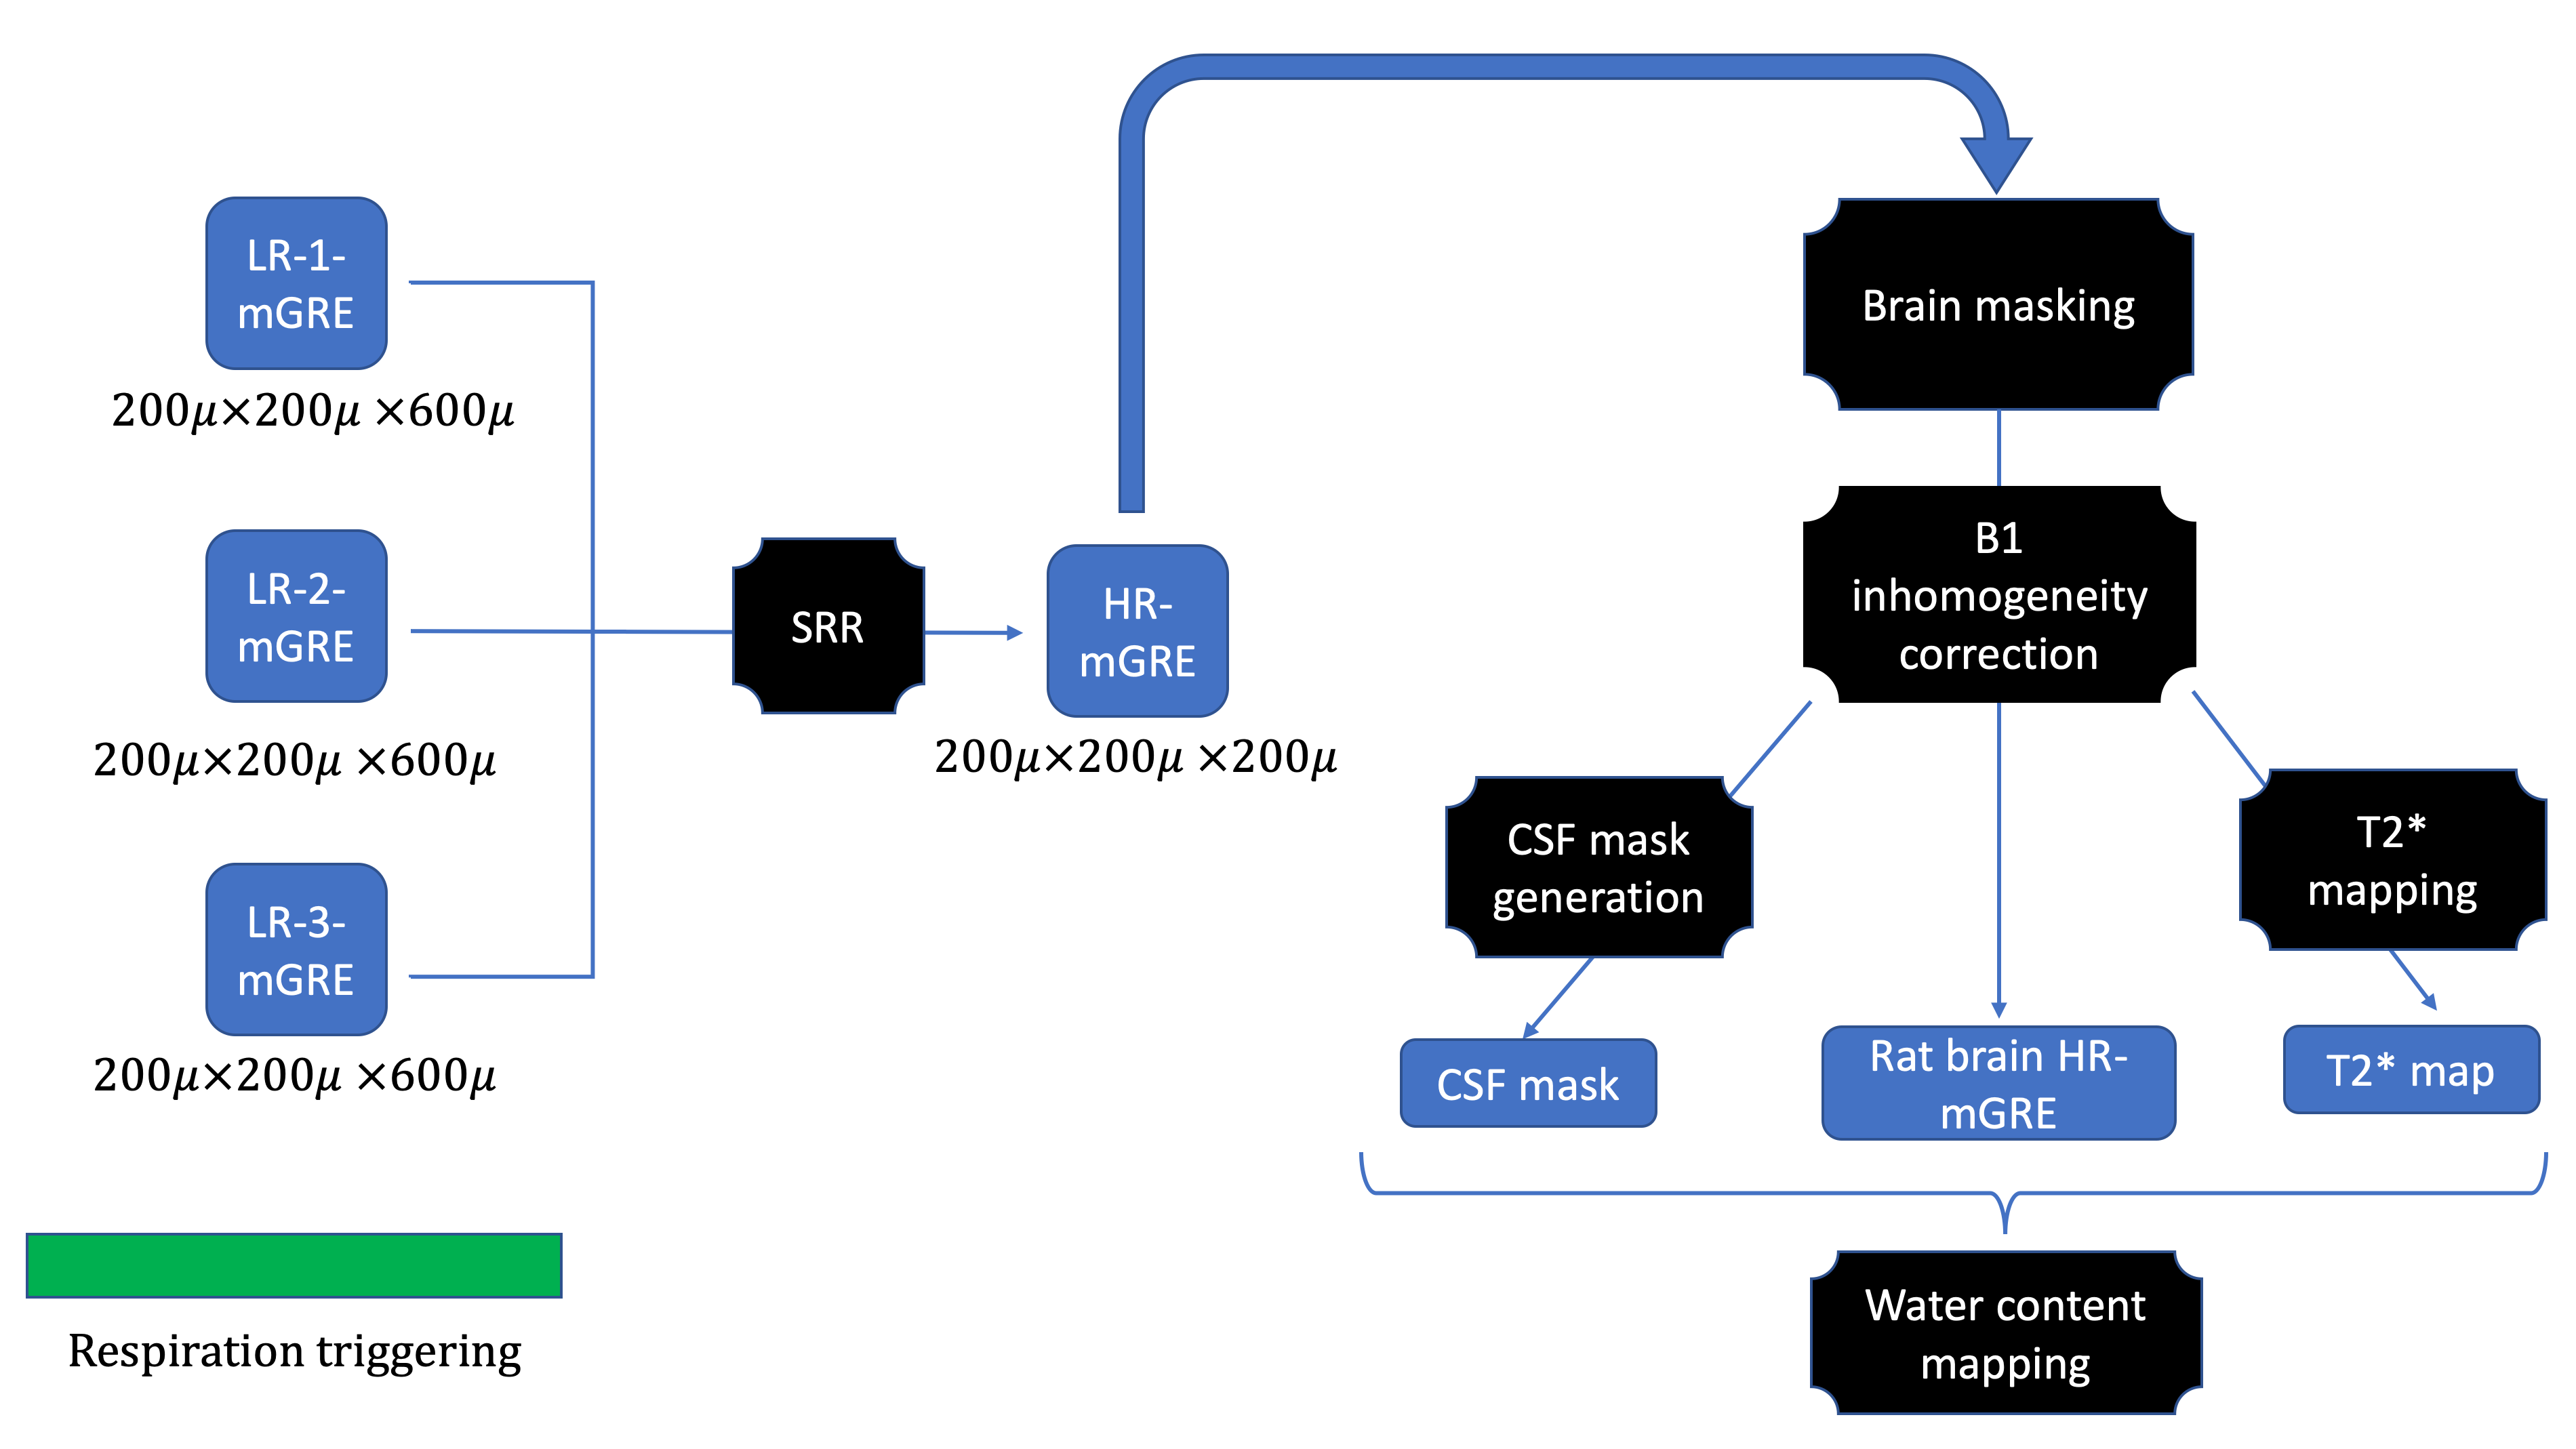
Experiments were carried out on a total of eight male Wistar rats (Charles River Laboratories, Sulzfeld, Germany), age range: 10-11 weeks, mean weight = 400 g. The rats were scanned with a 9.4 T MRI scanner13 and later sacrificed to carry out the ex vivo studies. Similar to the method described in10, three orthogonally oriented low-resolution mGRE images (12 echoes) with an in-plane resolution of 200 μm×200 μm and a slice thickness of 600 μm were acquired and recombined using SRR to obtain a single high-resolution (HR) mGRE image (200 μm isotropic resolution) as shown in Fig. 1. The MR parameters were: TR = 3330 ms, FA = 15°, TE0 = 1.35 ms, ∆TE = 2.10 ms, nTE = 12, BW = 650 Hz/pixel, FOV = 38.4 mm x 38.4 mm, matrix size = 192x192, partial Fourier = 6/8, no. of slices = 90, 4 averages per orientation. The total measurement time was 2 hours. Receive field inhomogeneities were corrected for using N4ITK14. Following the MR experiments, the rats were sacrificed. The rat brain was excised and divided into five regions, namely: frontal left (FL), frontal right (FR), midbrain left (ML), midbrain right (MR) and the cerebellum-brainstem (CB-BS) and ex vivo wet/dry measurements of water content were carried out.Results
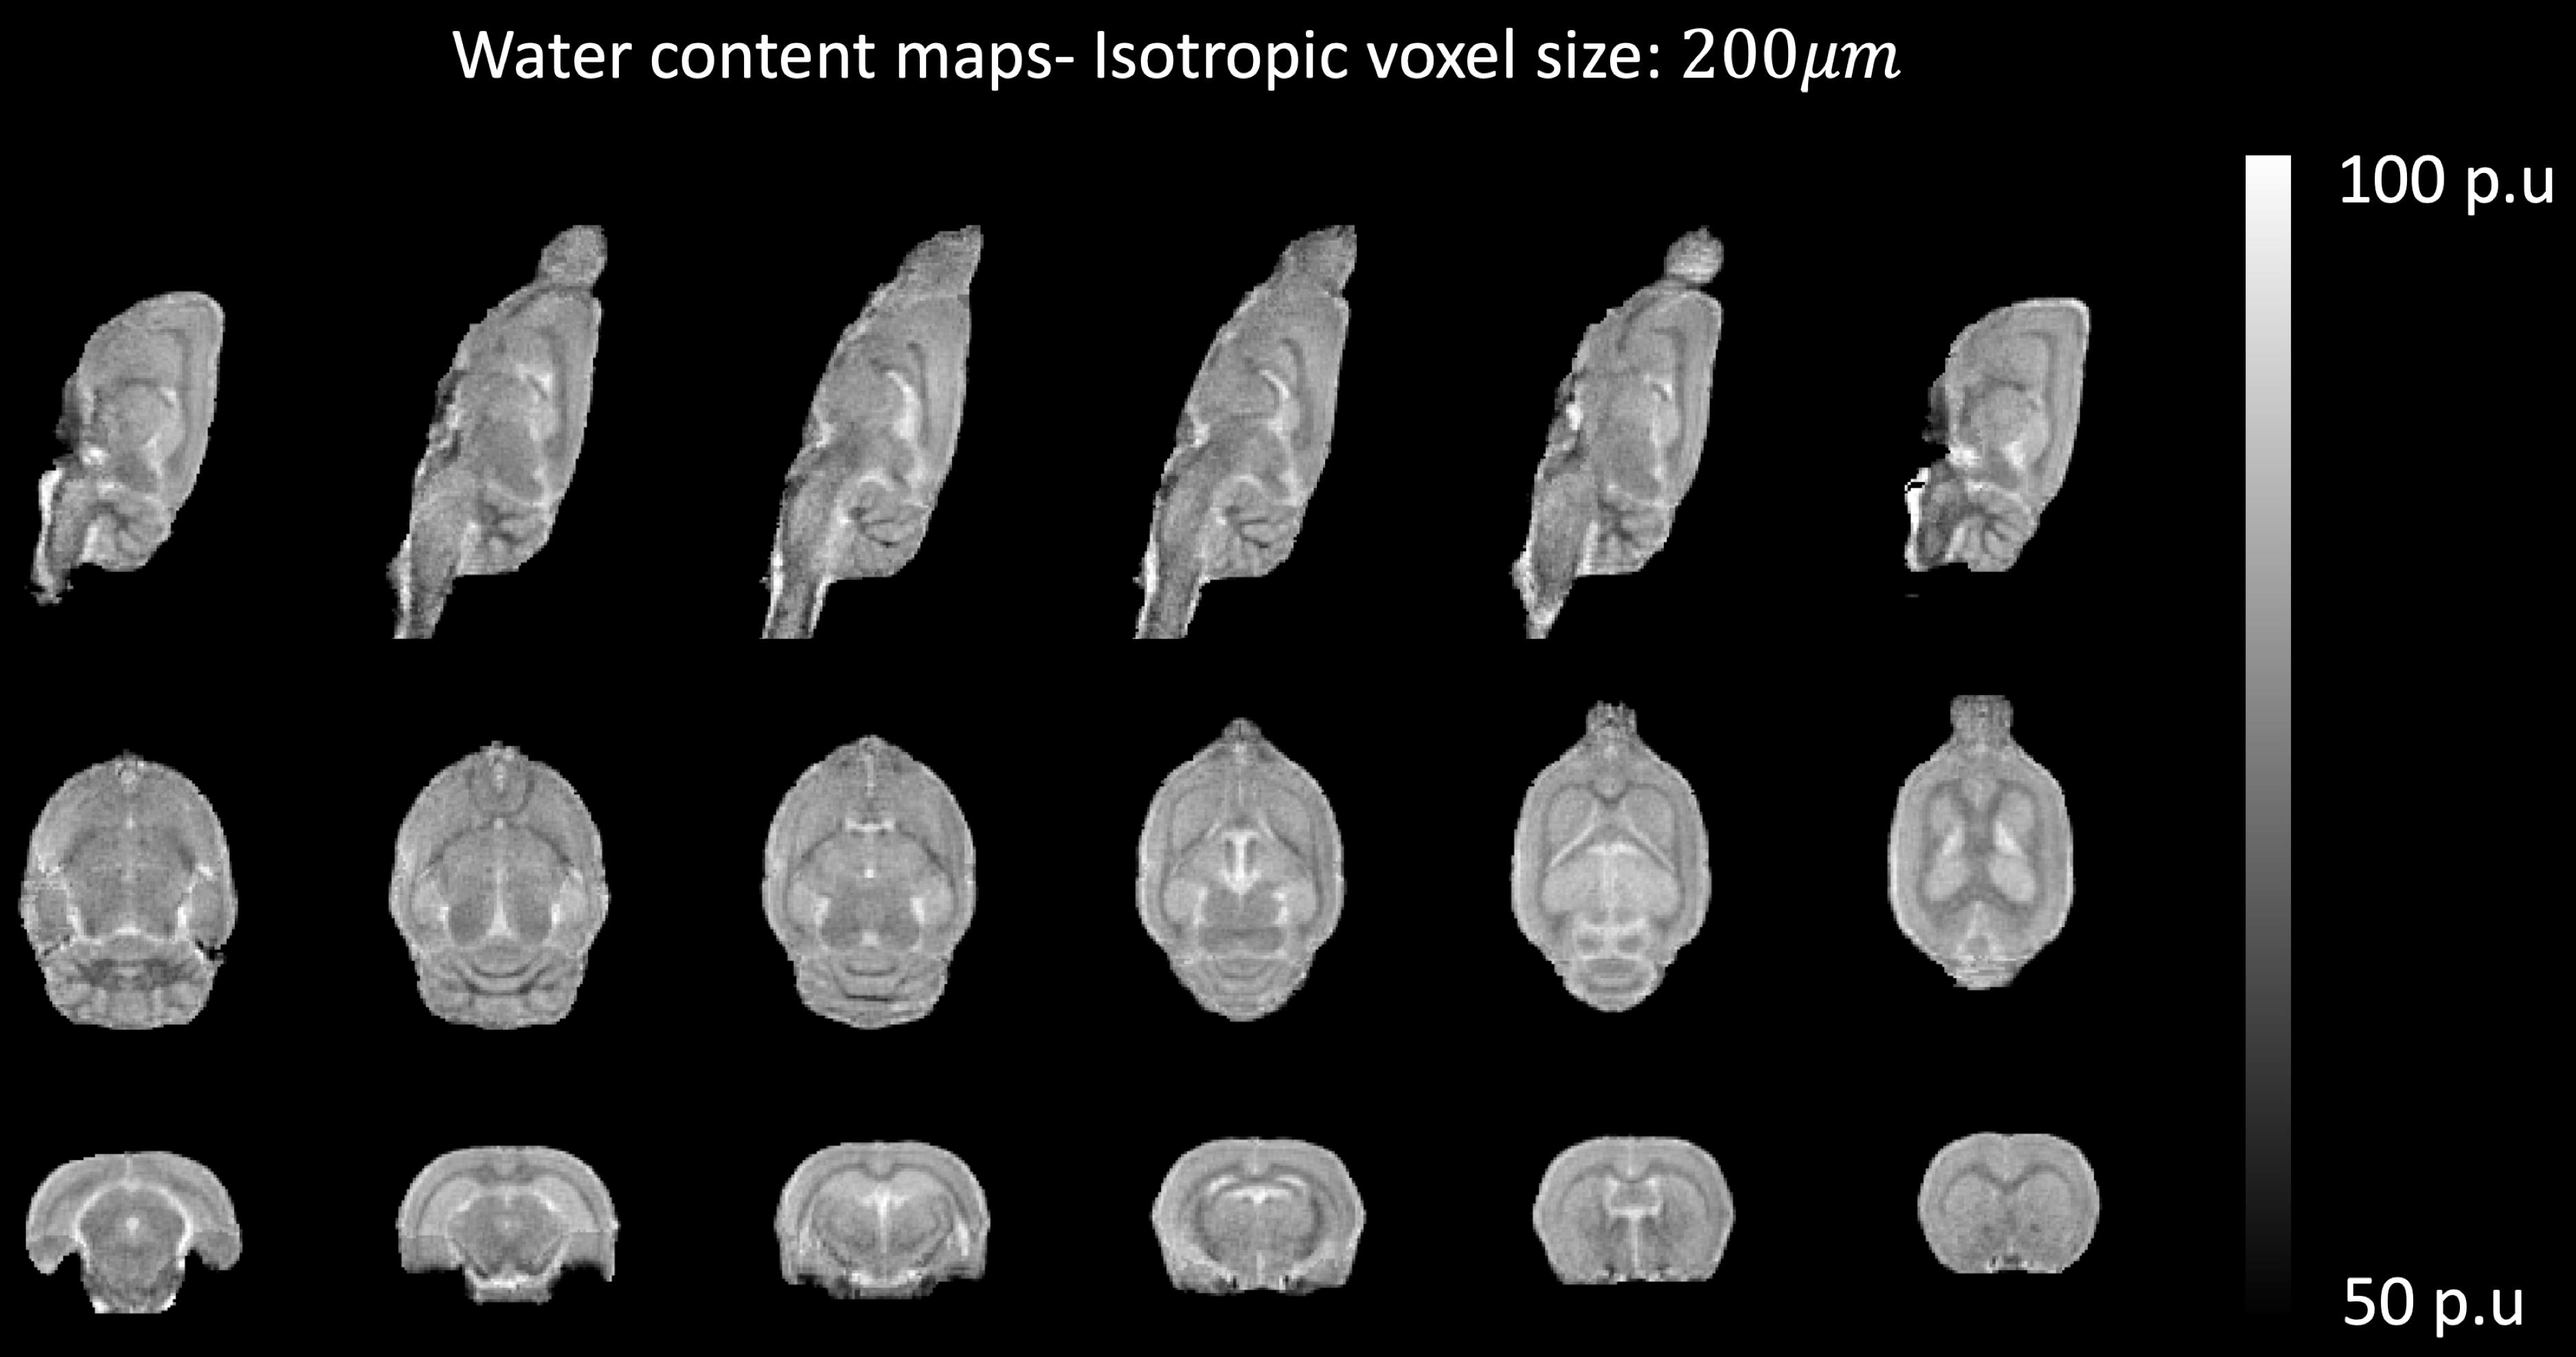
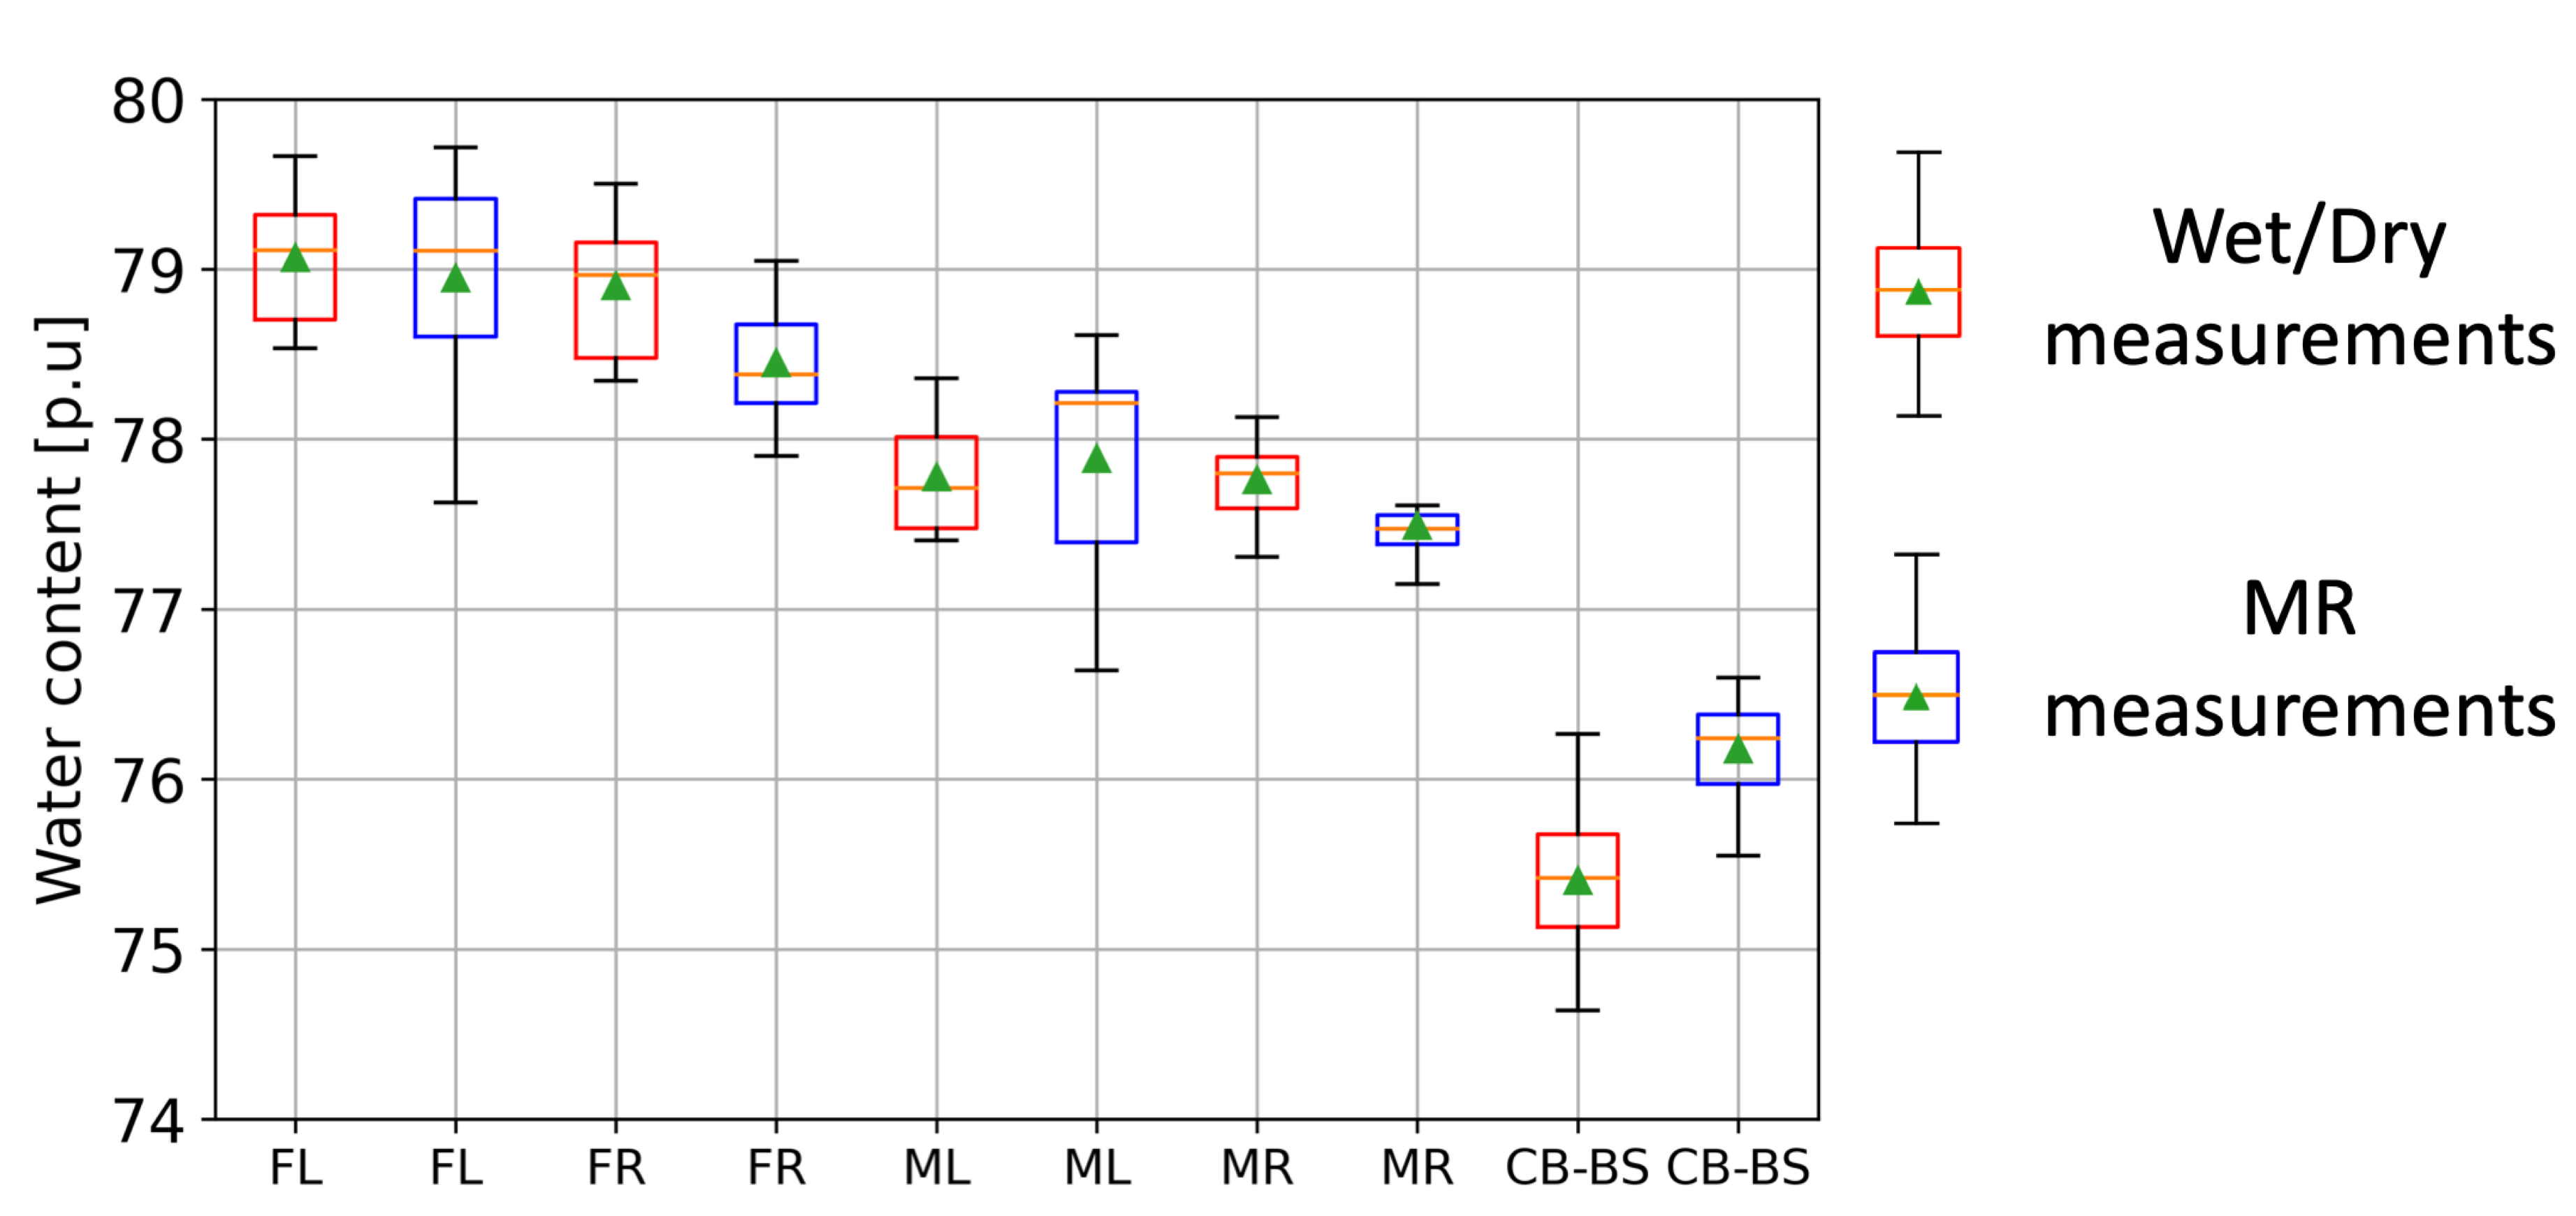
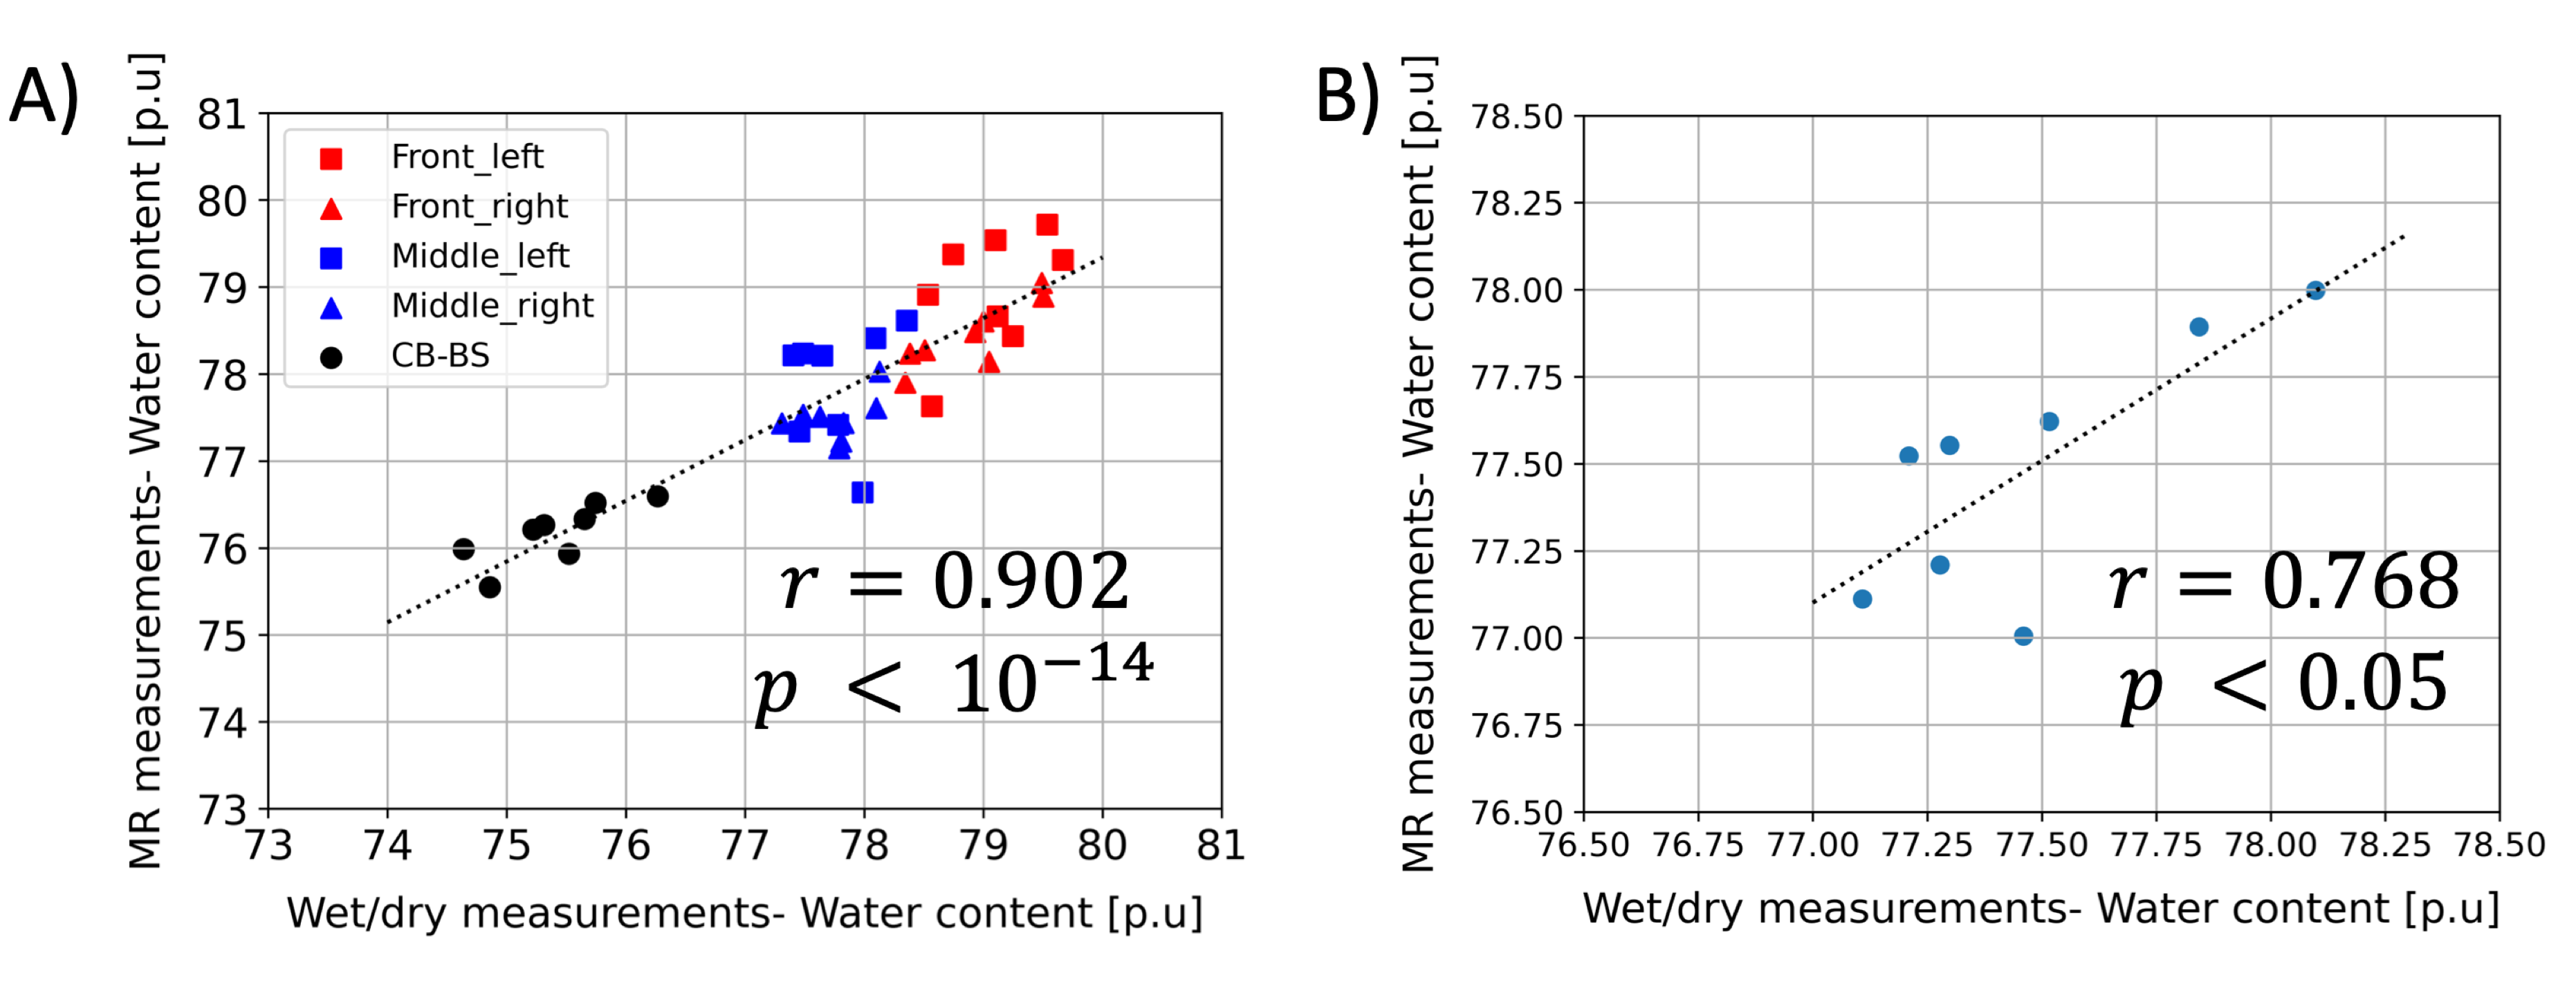
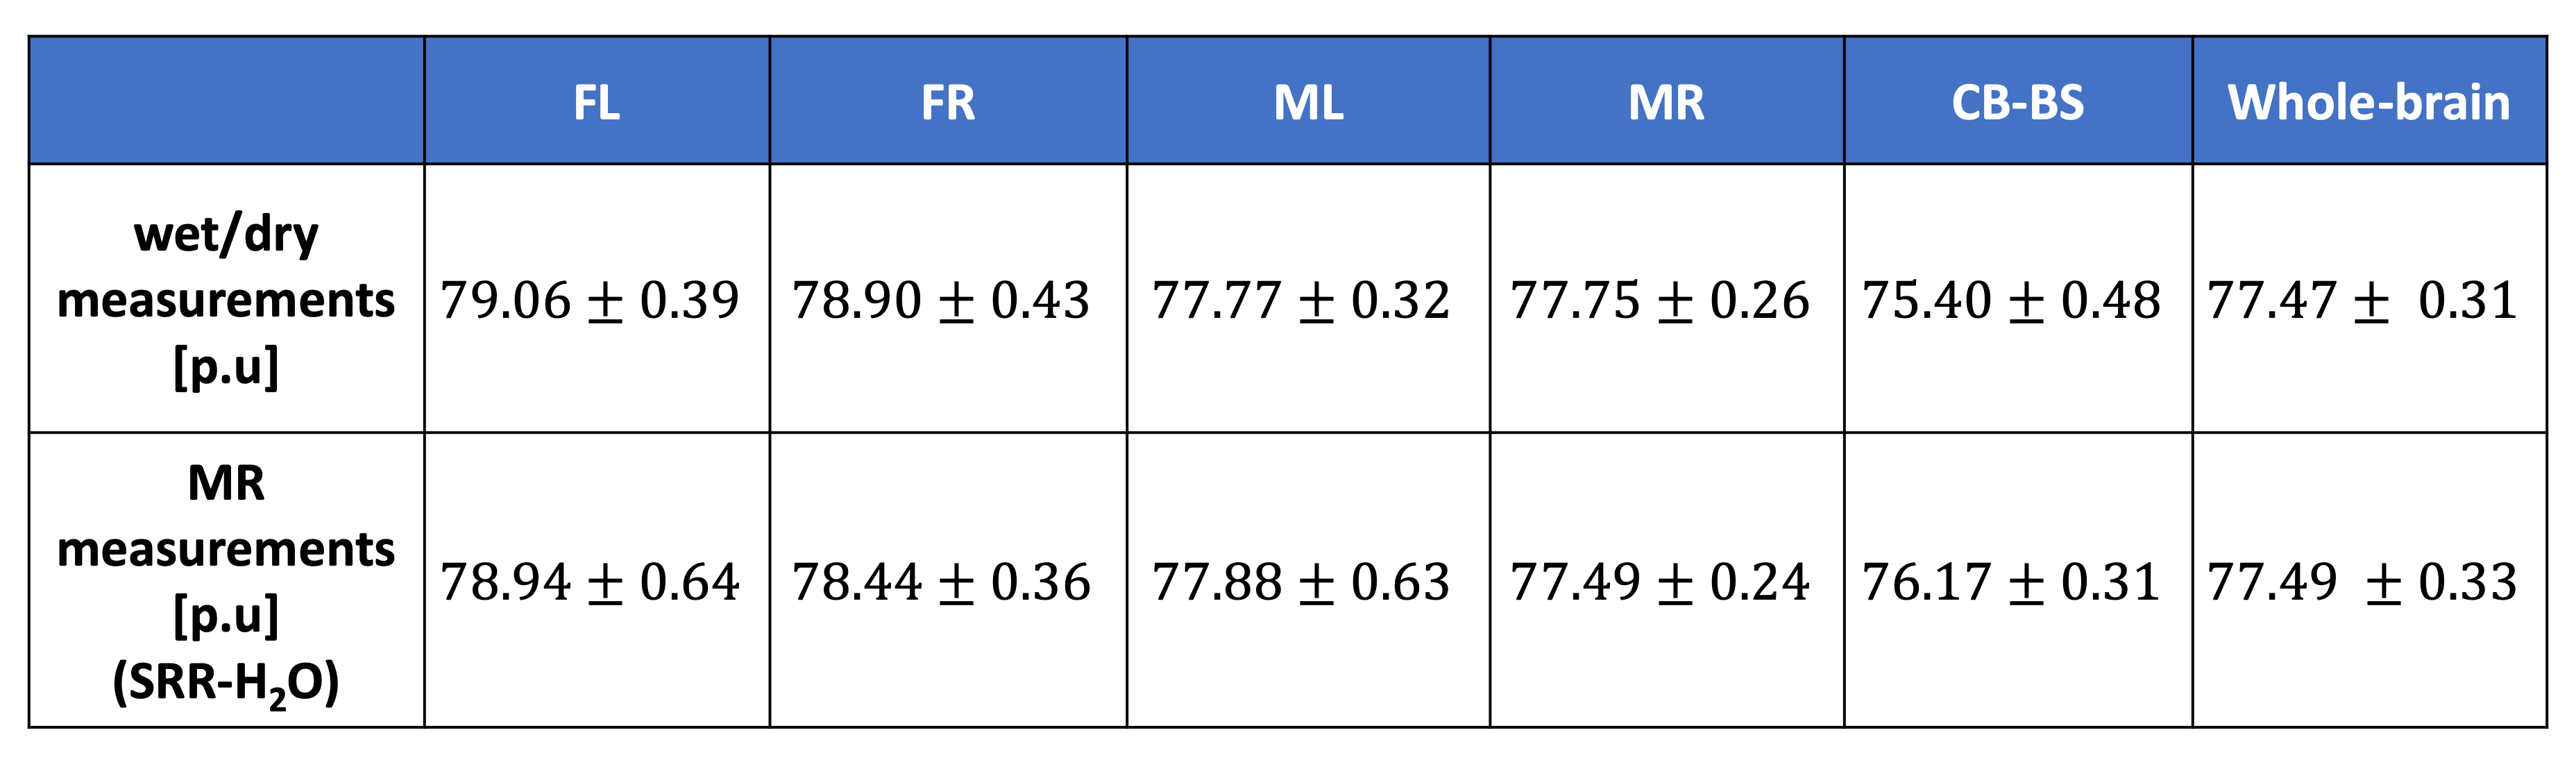
Fig. 2 shows one of the HR in vivo water content maps in all the three orthogonal orientations. Qualitatively, it can be seen that the effect of receive field inhomogeneities is very well corrected. Furthermore, good contrast is achieved between the WM, GM and CSF. The mean whole-brain water content value for this particular rat was 77.43 p.u. At the group level, the whole brain water content was found to be 77.49 +/- 0.33 (mean +/- SD). At a group level, the water content values of all the rat brains measured with the wet/dry method appeared to be similar in both hemispheres but different between the broad regions (Fig. 3). Statistical analysis using repeated measures ANOVA revealed significant differences between the brain regions (p < 0.0001). The water content values of the different regions obtained with MR and ex vivo measurements are shown in Table 1. The SD of the SRR-H2O (0.33 p.u) was found to be comparable with that of the ex vivo measurements (0.31 p.u). Fig. 4A and 4B show the excellent correlation between the water content values obtained using MR measurements and wet/dry measurements, regional: r = 0.902 (p < 0.000001), whole-brain: r = 0.768 (p <0.05).Discussion and Conclusions
The technique presented here is an adaptation of a recently developed technique in humans using SRR at 3 T. The use of SRR allows one to achieve a better trade-off between SNR and scan time as compared to averaging. The high and isotropic resolution achieved using SRR enables a more accurate delineation of the CSF with minimal partial volume effects thus leading to accurate water content values. Using a TR of 3330 ms and FA of 15° ensures a good contrast between the CSF and brain tissue, as was also demonstrated in11. A very good correlation between the whole brain water content values (Fig 4B, r=0.768) shows a high sensitivity of the MR measurements to changes in whole-brain water content (<1 p.u). The differences in water content values between the broad regions (Fig. 3 and Table 1) are not surprising as different brain regions are known to have different water content values9,12. These broad differences seen in the reference wet/dry measurements are also accurately reflected in the MR-based water content values, thus validating the accurate correction of the bias field. In conclusion, an in vivo technique to achieve high and isotropic resolution water content maps in rats using SRR has been developed and the accuracy of the technique assessed. The MR derived water content values showed an excellent correlation with the gold standard ex vivo techniques.Acknowledgements
This work was supported by the European Union’s Horizon 2020 research and innovation programme under the Marie Sklodowska-Curie grant agreement No. 764513. The authors would like to thank Ms. Kornadt-Beck for help with the animal approval.References
1. J. E. Hall and A. C. Guyton, Guyton and Hall textbook of medical physiology. 2011.
2. N. J. Shah, H. Neeb, G. Kircheis, P. Engels, D. Häussinger, and K. Zilles, “Quantitative cerebral water content mapping in hepatic encephalopathy,” NeuroImage, vol. 41, no. 3, pp. 706–717, Jul. 2008, doi: 10.1016/j.neuroimage.2008.02.057.
3. C. Laule et al., “Water content and myelin water fraction in multiple sclerosis,” Journal of Neurology, vol. 251, no. 3, pp. 284–293, Mar. 2004, doi: 10.1007/s00415-004-0306-6.
4. W. Lin, R. Venkatesan, K. Gurleyik, Y. Y. He, W. J. Powers, and C. Y. Hsu, “An Absolute Measurement of Brain Water Content Using Magnetic Resonance Imaging in Two Focal Cerebral Ischemic Rat Models,” J Cereb Blood Flow Metab, vol. 20, no. 1, pp. 37–44, Jan. 2000, doi: 10.1097/00004647-200001000-00007.
5. R. Venkatesan et al., “Absolute measurements of water content using magnetic resonance imaging: Preliminary findings in an in vivo focal ischemic rat model,” Magnetic Resonance in Medicine, vol. 43, no. 1, pp. 146–150, 2000, doi: 10.1002
6. A. Schwarcz, Z. Berente, E. Ősz, and T. Dóczi, “In vivo water quantification in mouse brain at 9.4 Tesla in a vasogenic edema model,” Magnetic Resonance in Medicine, vol. 46, no. 6, pp. 1246–1249, 2001, doi: 10.1002/mrm.1324.
7. P. P. Fatouros, A. Marmarou, K. A. Kraft, S. Inao, and F. P. Schwarz, “In Vivo Brain Water Determination by T1 Measurements: Effect of Total Water Content, Hydration Fraction, and Field Strength,” Magnetic Resonance in Medicine, vol. 17, no. 2, pp. 402–413, 1991, doi: 10.1002/mrm.1910170212.
8. H. Greenspan, “Super-Resolution in Medical Imaging,” The Computer Journal, vol. 52, no. 1, pp. 43–63, Feb. 2008, doi: 10.1093/comjnl/bxm075.
9. A.-M. Oros-Peusquens, R. Loução, Z. Abbas, V. Gras, M. Zimmermann, and N. J. Shah, “A Single-Scan, Rapid Whole-Brain Protocol for Quantitative Water Content Mapping With Neurobiological Implications,” Front. Neurol., vol. 10, p. 1333, Dec. 2019, doi: 10.3389/fneur.2019.01333.
10. D. Thomas, A.-M. Oros-Peusquens, D. Poot, and N. J. Shah, “Isotropic water content mapping employing super-resolution reconstruction with acquisition in three orthogonal orientations,” in 2021 ISMRM & SMRT Annual Meeting & Exhibition 15-20 May 2021, Online, May 2021.
11. D. C. Thomas, A.-M. Oros-Peusquens, D. Poot, and N. J. Shah, “Whole-Brain Water Content Mapping Using Super-Resolution Reconstruction with MRI Acquisition in 3 Orthogonal Orientations,” Magnetic Resonance in Medicine, vol. 88, no. 5, pp. 2117–2130, 2022, doi: 10.1002/mrm.29377.
12. M. Schwab, R. Bauer, and U. Zwiener, “The distribution of normal brain water content in Wistar rats and its increase due to ischemia,” Brain Research, vol. 749, no. 1, pp. 82–87, Feb. 1997, doi: 10.1016/S0006-8993(96)01165-1.
13. J. Felder, A. A. Celik, C.-H. Choi, S. Schwan, and N. J. Shah, “9.4 T small animal MRI using clinical components for direct translational studies,” J Transl Med, vol. 15, p. 264, Dec. 2017, doi: 10.1186/s12967-017-1373-7.
14. N. J. Tustison et al., “N4ITK: Improved N3 Bias Correction,” IEEE Trans. Med. Imaging, vol. 29, no. 6, pp. 1310–1320, Jun. 2010, doi: 10.1109/TMI.2010.2046908.
Figures