3918
Agonism/antagonism on cannabinoid 1 receptor reveal opposite cerebral blood volume change: a simultaneous PET/fMRI study on primates1Athinoula A. Martinos Center for Biomedical Imaging, Boston, MA, United States
Synopsis
Keywords: Molecular Imaging, Drug Development
The goal of this study was to detect the changes of cerebral blood volume (CBV) in the non-human primate brain induced by administration of agonist and antagonist of cannabinoid receptor 1 (CB1R) using simultaneous positron emission tomography (PET) and function magnetic resonance imaging (fMRI). After the antagonist injection, a bi-phasic response, fast increase and prolonged decrease of CBV, were identified throughout the brain, while CB1R agonist administration evoked elevation of CBV. Future studies integrating PET-derived receptor occupancy information with the CBV changes will provide deeper understanding on CB1R and brain response.Purpose
Cannabinoids, namely cannabis, have been used for their therapeutic and medicinal properties to mitigate pain, the effects of which on the central nervous system are mediated by cannabinoid receptor 1 (CB1R)1. However, cannabis may cause negative health implications, such as cachexia, nausea/vomiting, and spasticity1. Despite its potential as a novel therapeutic target, current understanding on how cannabinoids act in the brain in vivo remains limited. Simultaneous positron emission tomography/magnetic resonance image (PET/MRI) systems have played a key role in investigating functional responses to novel medicine/drugs targeting specific receptor systems, such as dopamine, serotonin, opioid receptors 2,3, while offering receptor occupancy measures. The goal of this study was to investigate the changes of cerebral blood volume (CBV) in the non-human primate (NHPs) brain induced by administration of CB1R agonist and antagonist, while simultaneously imaging the CB1R receptor system using PET. Our hypothesis was that agonist/antagonist injection will induce CBV changes in brain regions with high CB1R density. We also hypothesized that CB1R agonist and antagonist will evoke opposite CBV responses in the same brain regions.Methods
Simultaneous PET/MRI of NHP brains were acquired with a 3T Siemens TIM-Trio with a BrainPET insert using a custom 8-channel array coil. A high-resolution anatomical scan was obtained by using multi-echo MPRAGE sequence (TR = 2530 ms, TE1/TE2/TE3/TE4 = 1.64/3.5/5.36/7.22 ms, TI = 1200 ms, flip angle = 7°, and 1 mm isotropic). To improve the sensitivity of fMRI, ferumoxytol was used to measure CBV-weighted fMRI. Functional scan using multislice echo-planar imaging sequence (TR = 3000 ms, TE = 22 ms, flip angle = 90°, and 1.3 mm isotropic) was acquired for ~110 min with rimonabant (1 and 3 mg/kg) or CP55,940 (0.1 mg/kg) injection during the fMRI scan. Dynamic PET data were acquired from the NHPs using the predetermined bolus-plus-infusion (BI) protocol with bolus injection of ~250 MBq, constant infusion of ~160 MBq of [11C]OMAR radiotracer and stored in list mode for 100 min. Functional MR scans were motion corrected, brain extracted, and affine registered to the INIA19 template4. The anatomical MRI was masked by a PET-derived binary mask of body contour, bias-corrected and intensity-normalized, and brain extracted. Prior to the general linear model (GLM) analysis, fMRI data were spatially smoothed with a 2-mm Gaussian kernel. Gamma-variate functions were used to model the fMRI temporal response to CB1R agonist/antagonist administration, as described in the previous studies5,6. The time-to-peak response (τ) of the gamma functions was adjusted to minimize the χ2/degree-of-freedom of the GLM fit to data. Peak magnitudes of the gamma-variate regressor were defined as the maximum changes in fMRI signal. Percentage differences in CBV (%∆CBV) were converted from the maximum fMRI changes, using standard methods and a separate baseline scan (~5 min) acquired when ferumoxytol was administered intravenously7. For a region-based comparison, 22 gray matter, 1 cerebellum, 1 white matter, 1 whole brain regions of interest (ROIs) obtained from the INIA19 template. Finally, dynamic PET images were reconstructed using the 3D-OSEM algorithm into 1-min frames after detector efficiency, decay, dead time, AC, and scatter corrections. Reconstructed PET images were registered to INIA19 template using the preprocessed anatomical MR image.Results
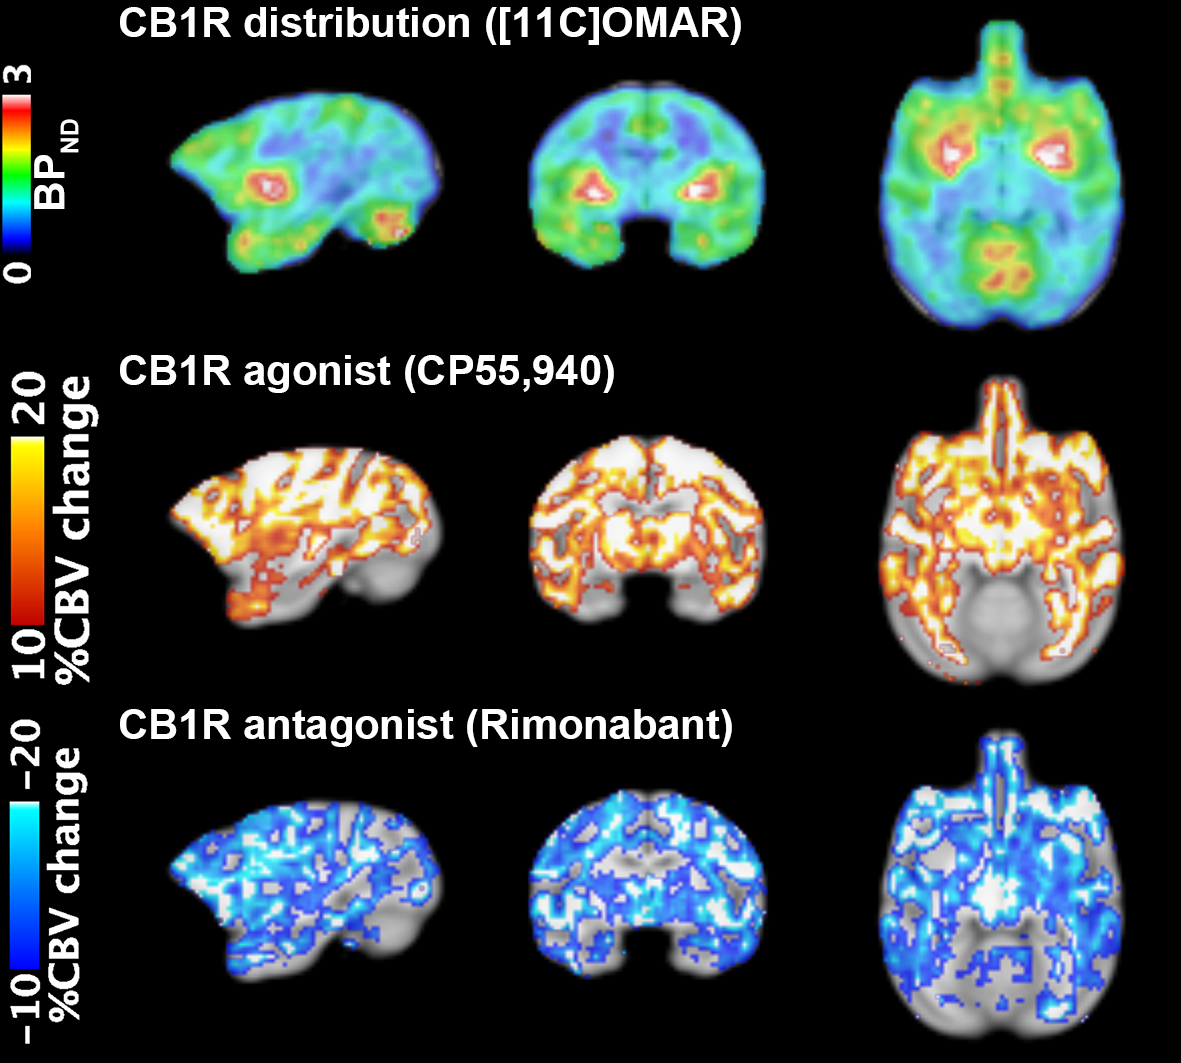
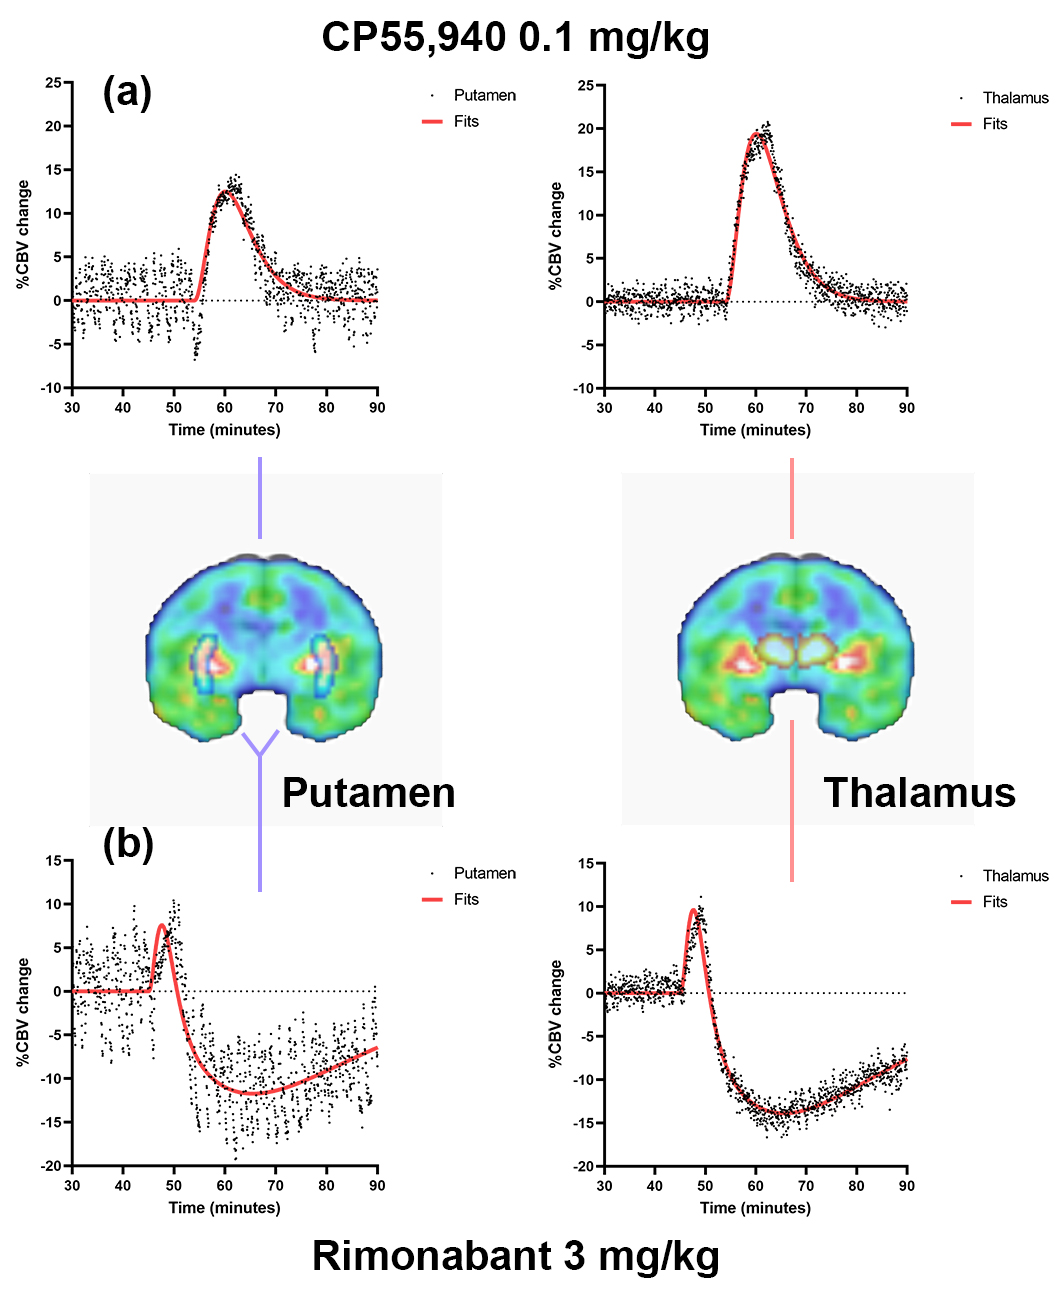
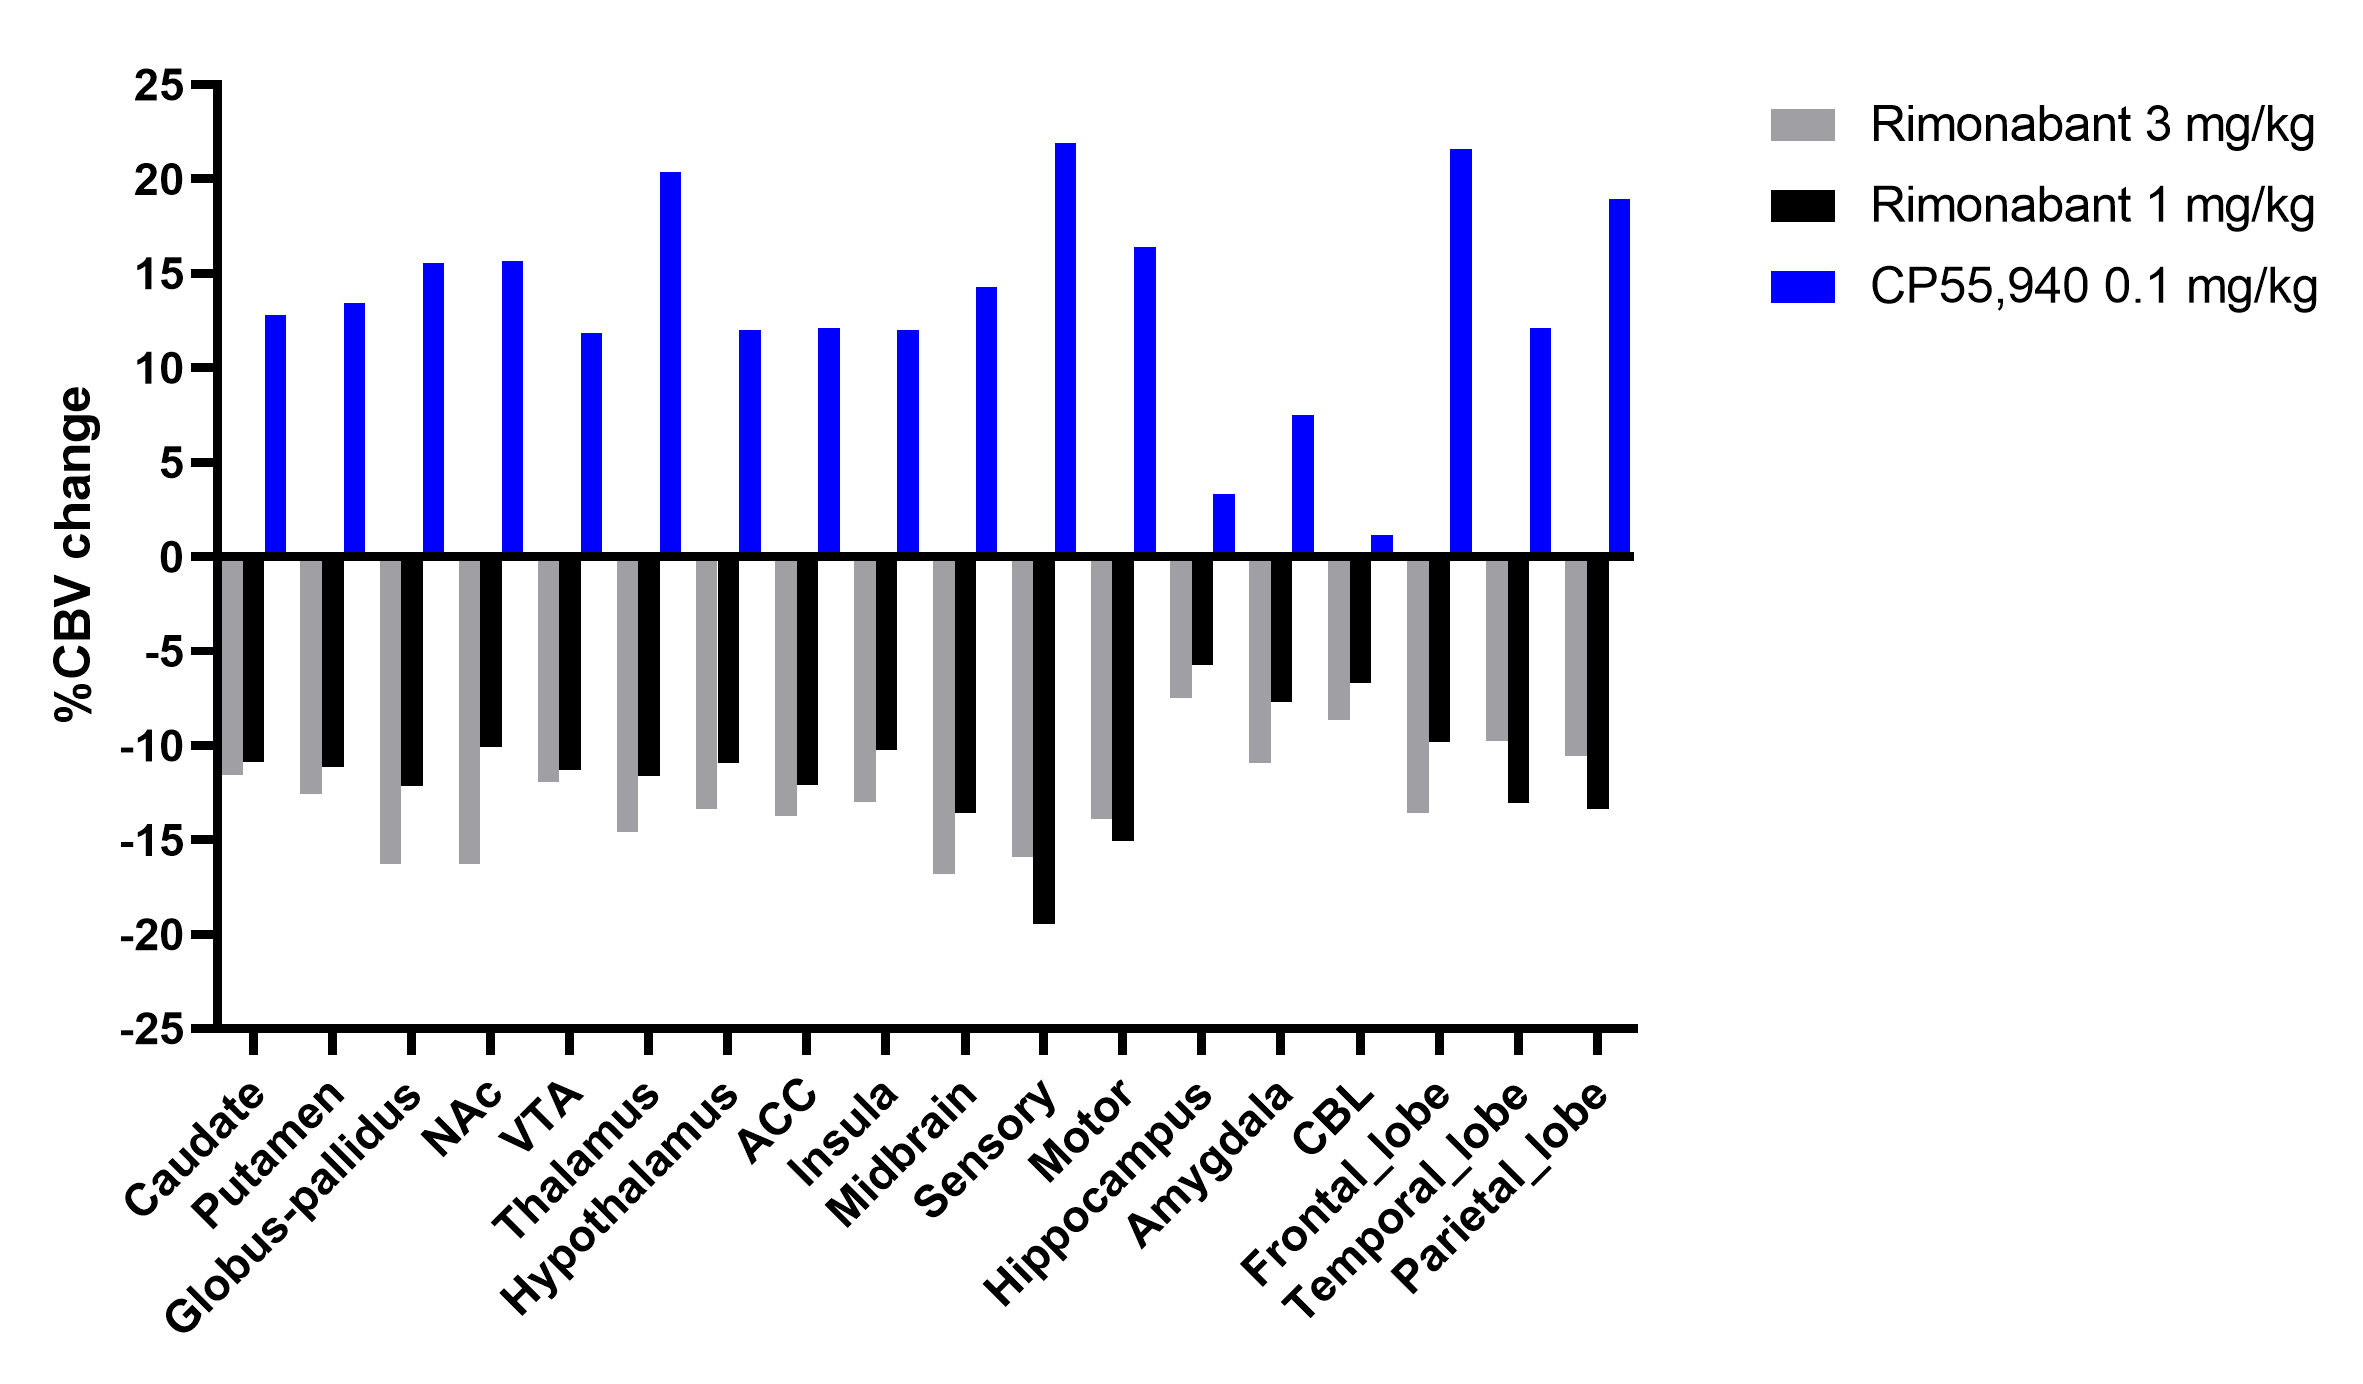
Figure 1 highlights regional non-displaceable binding potential (BPND) of [11C]OMAR, and %∆CBV maps show hemodynamic response induced by the CB1R agonist and antagonist, respectively. Figure 2 shows time-courses of %∆CBV (baseline drift corrected) from representative brain regions. A range (10-20%) of ∆%CBV after administration of (a) 0.1 mg/kg of CP55,940 and (b) 3 mg/kg of rimonabant was apparent. CP55,940 evoked elevation of %CBV (τ = ~ 6 min), whereas rimonabant caused CBV (τ = ~3 min) to be elevated, followed by prolonged reduction (τ = ~20 min). The summary of regional %∆CBV induced by CB1R agonist/antagonist is shown in Figure 3.Discussion and Conclusion
We detected the functional response to CB1R agonist (CP55,940) and antagonist (rimonabant) in the NHP brain. CB1R drug occupancy was indirectly measured using simultaneous PET/fMRI. Administration of a CB1R agonist, expected to activate CB1R, induced detectable increased of %CBV over high binding regions. Interestingly, the brain regions with mild-low CB1R density, i.e. thalamus and midbrain, also showed high %CBV changes. However, small %occupancy was measured, potentially due to low dose or the affinity of the drug. In contrast, the CB1R antagonist, expected to deactivate CB1R, evoked a reduction in %CBV after initial elevation. Reduced radiotracer binding was observed after both doses of rimonabant injection (~40% occupancy at the putamen), indicating that rimonabant bound to CB1R and blocked its activation. Considering that the action of agonist and antagonist is theoretically opposite, the opposite directional %∆CBV induced by agonist/antagonist of CB1R could mainly be mediated by CB1R system, consistent with our hypothesis. This opposite directional %∆CBV was obvious even in brain regions known to have mild-low CB1R density. Future studies with multiple doses of CP55,940 and other relevant agonist/antagonist (i.e., tetrahydrocannabinol (THC), Cannabidiol (CBD)) will provide a deeper understanding of the mechanisms of action of CB1R in the presence of agonist/antagonist drug challenges and their underlying implications to brain function.Acknowledgements
No acknowledgement found.References
1. Page RL 2nd, Allen LA, Kloner RA, Carriker CR, Martel C, Morris AA, Piano MR, Rana JS, Saucedo JF; American Heart Association Clinical Pharmacology Committee and Heart Failure and Transplantation Committee of the Council on Clinical Cardiology; Council on Basic Cardiovascular Sciences; Council on Cardiovascular and Stroke Nursing; Council on Epidemiology and Prevention; Council on Lifestyle and Cardiometabolic Health; and Council on Quality of Care and Outcomes Research. Medical Marijuana, Recreational Cannabis, and Cardiovascular Health: A Scientific Statement From the American Heart Association. Circulation. 2020 Sep 8;142(10):e131-e152. doi: 10.1161/CIR.0000000000000883.
2. Sander CY, Hansen HD, Wey HY. Advances in simultaneous PET/MR for imaging neuroreceptor function. J Cereb Blood Flow Metab. 2020;40(6):1148-1166. doi:10.1177/0271678X20910038
3. Sander CY, Hooker JM, Catana C, Normandin MD, Alpert NM, Knudsen GM, Vanduffel W, Rosen BR, Mandeville JB. Neurovascular coupling to D2/D3 dopamine receptor occupancy using simultaneous PET/functional MRI. Proc Natl Acad Sci U S A. 2013;110(27):11169-74. doi: 10.1073/pnas.1220512110.
4. Rohlfing T, Kroenke CD, Sullivan EV, Dubach MF, Bowden DM, Grant KA, Pfefferbaum A. The INIA19 Template and NeuroMaps Atlas for Primate Brain Image Parcellation and Spatial Normalization. Front Neuroinform. 2012;6:27. doi: 10.3389/fninf.2012.00027.
5. Mandeville JB. IRON fMRI measurements of CBV and implications for BOLD signal. Neuroimage. 2012;62(2):1000-8. doi: 10.1016/j.neuroimage.2012.01.070.
6. Liu CH, Greve DN, Dai G, Marota JJ, Mandeville JB. Remifentanil administration reveals biphasic phMRI temporal responses in rat consistent with dynamic receptor regulation. Neuroimage. 2007;34(3):1042-53. doi: 10.1016/j.neuroimage.2006.10.028.
7. Mandeville JB, et al. (1998) Dynamic functional imaging of relative cerebral blood volume during rat forepaw stimulation. Magn Reson Med 39(4):615–624
Figures