3917
Therapeutic response assessment to IDH inhibitor using hyperpolarized [5-12C-1-13C]α-ketoglutarate MRSI in rat models of low-grade glioma1Department of Radiology and Biomedical Imaging, University of California, San Francisco, San Francisco, CA, United States, 2National Cancer Institute, NIH, Bethesda, MD, United States, 3National Heart, Lung, and Blood Institute, NIH, Bethesda, MD, United States, 4Brain Tumor Research Center, University of California, San Francisco, San Francisco, CA, United States
Synopsis
Keywords: Hyperpolarized MR (Non-Gas), Treatment, Tumor, Preclinical, Non-proton, Spectroscopy
Hyperpolarized [1-13C]α-ketoglutarate is useful for monitoring 2HG and glutamate production but has limited SNR and the [5-13C]α-ketoglutarate natural abundance peak is within 0.1ppm of 2HG. To address these challenges, this study investigated the utility of HP [5-12C-1-13C]α-ketoglutarate to monitor 2HG and glutamate production as biomarkers of response to treatment with the mutant IDH inhibitor BAY-1436032 in an in vivo rat glioma model using an optimized acquisition strategy. We were able to clearly monitor the dynamic localized production of both 2HG and glutamate in vivo in real-time, and early metabolic changes predicted enhanced survival.Introduction
The isocitrate dehydrogenase (IDH) mutation is a driver in the development of lower-grade gliomas. Mutant IDH leads to the production of the oncometabolite 2-hydroxyglutarate(2HG) from α-ketoglutarate(αKG), and mutant IDH inhibitors are currently in clinical trials. We have previously shown that 13C magnetic resonance spectroscopy(MRS) of hyperpolarized(HP) αKG can be used to detect elevated HP 2HG and reduced HP glutamate production in mutant IDH tumors1,2. We have also shown that, in cells, reduced HP 2HG levels and elevated HP glutamate levels are associated with response to IDH inhibitors3. However, these prior studies have suffered from limited SNR and the proximity of the hyperpolarized [1-13C]2HG peak (183.9ppm) to the natural abundance [5-13C] αKG peak (184ppm) requiring careful post-processing to monitor the fate of 2HG in vivo4. To address these challenges, the current study investigated the utility of HP [5-12C-1-13C]αKG5 to monitor response to treatment with the mutant IDH inhibitor BAY-14360326 in an in vivo rat glioma model using an optimized acquisition strategy that simultaneously monitored the localized dynamic production of HP [1-13C]2HG and [1-13C]glutamate from HP[5-12C-1-13C]αKG.Methods
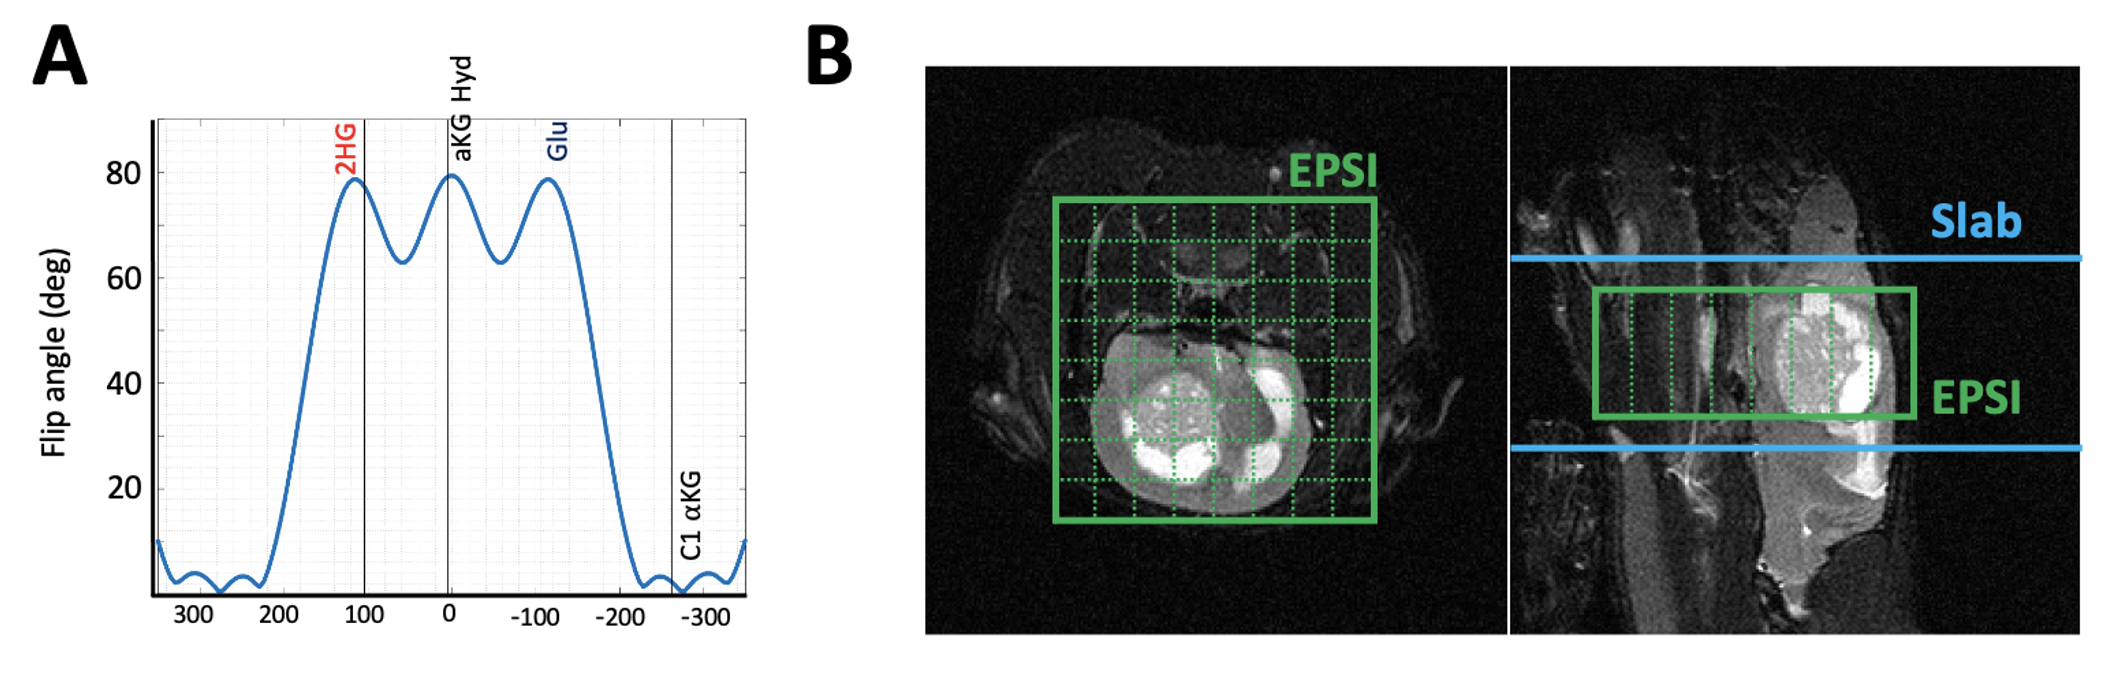
Patient-derived mutant IDH1 astrocytoma cells (BT257) were intracranially injected into nude rats and tumor volume was monitored using T2-weighted MR images. When tumor volume reached approximately 30mm3, the first set of spectra was acquired as follows and considered Day 0 pre-treatment data. 2.5ml of hyperpolarized [5-12C-1-13C]αKG, prepared as previously described1, was injected intravenously over 12s. MR data were acquired using a horizontal 3T pre-clinical scanner (Bruker, Germany) equipped with a quadrature 1H-13C volume coil (Neos-Biotech, Spain) and using multiband spectral-spatial (SPSP) excitation with slab (n=4) or echo planner spectroscopic imaging (EPSI, n=3) readout and the following parameters: TE=6ms, NEX=32, spectral resolution=512, temporal resolution=3s, slice thickness=14mm for slab and 10mm for EPSI, FA=78° for 2HG and glutamate, 1.7° for αKG for both slab and EPSI, and spatial resolution for EPSI=2.7*2.7*8mm3. Rats were then treated with the IC50 value of BAY-1436032 every 24 hours until the endpoint. On Day 10, a post-treatment data set was also acquired in the same way as the Day 0 data. EPSI data were post-processed with tensor denoising7 using an in-house Matlab (Mathworks, MA) script. Metabolite concentrations were quantified using the peak area. Paired t-test was used to determine the significance of metabolite differences between pre-and post-treatment. P-values < 0.05 were considered to be significant.Results
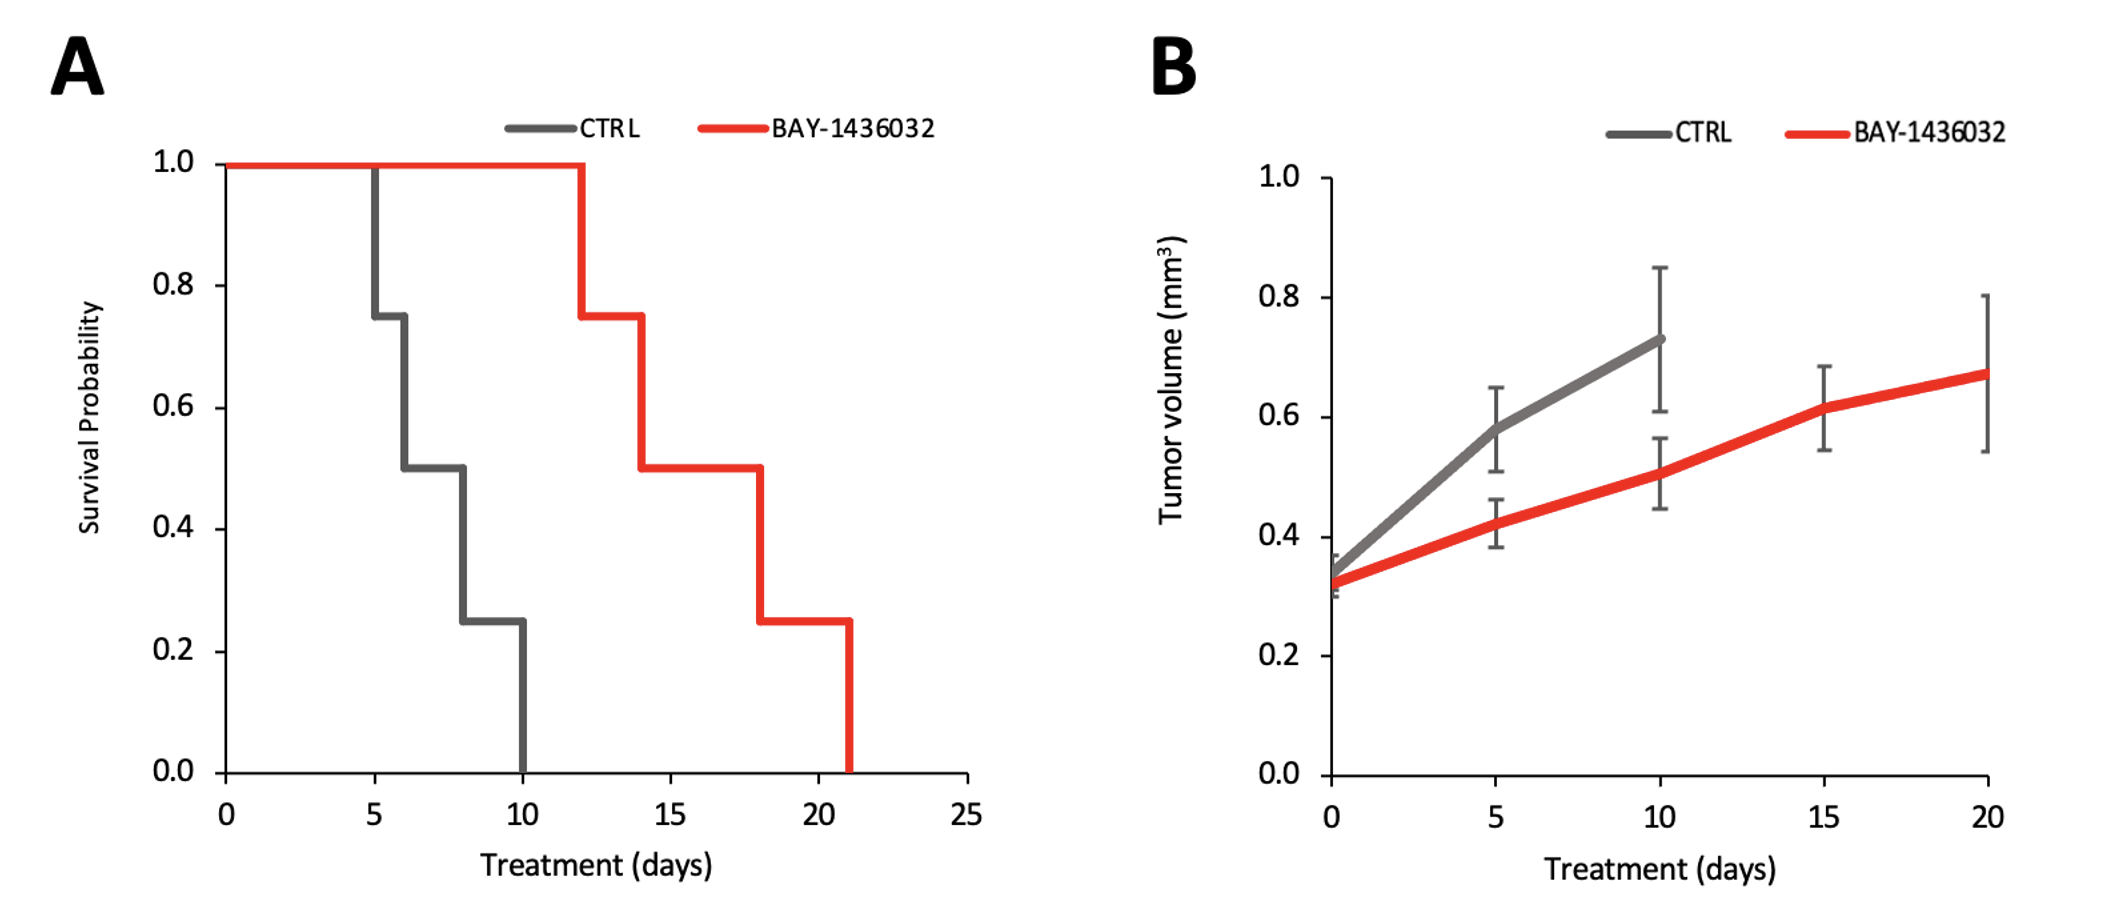
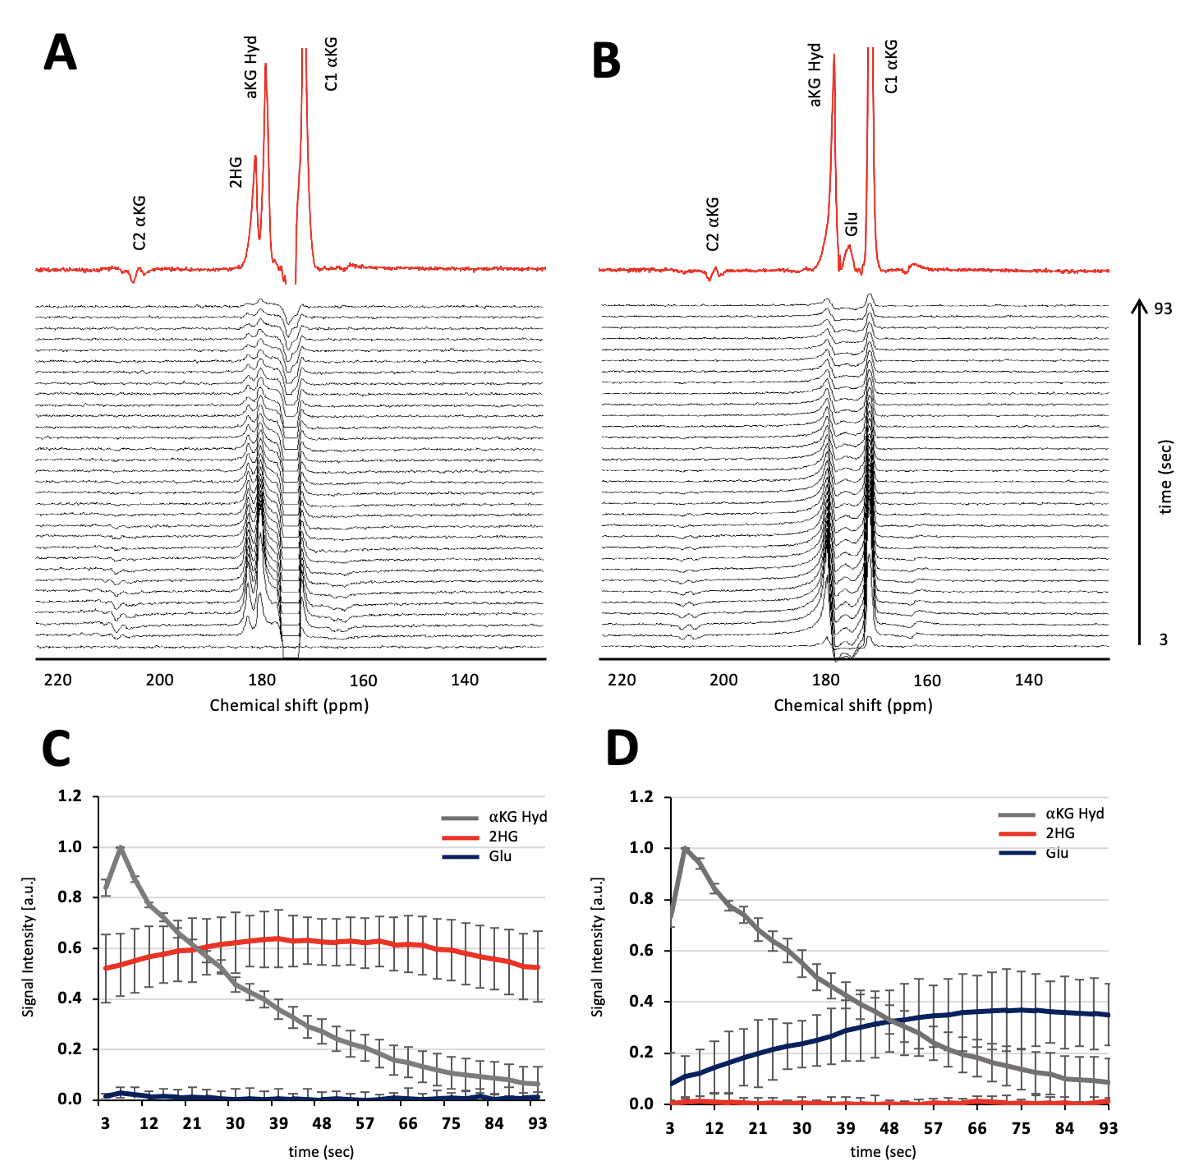
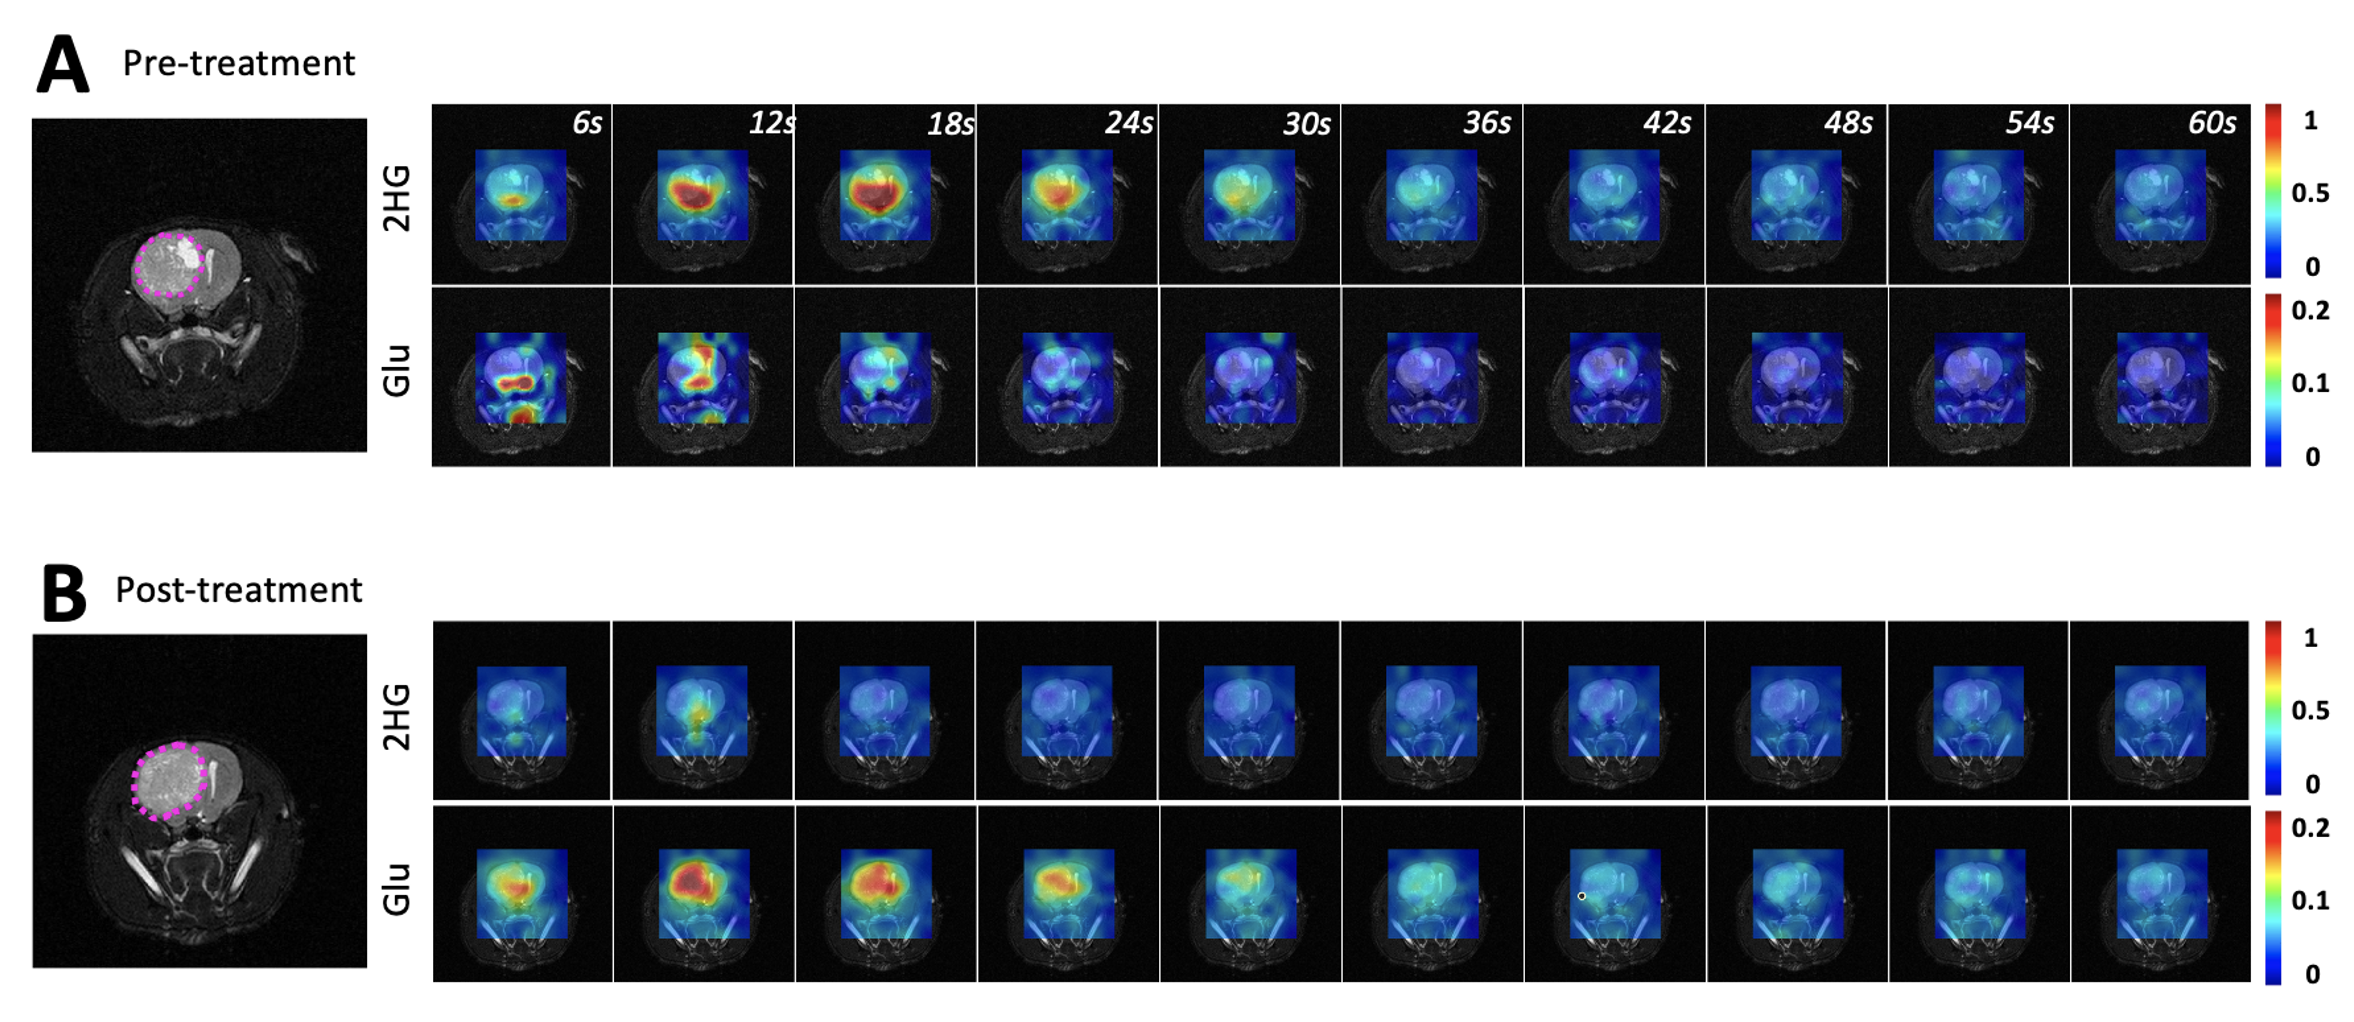
Figure 1A shows the flip angle profile of the RF pulse used for the multiband excitation. Figure 1B illustrates the slice orientation on the T2-weighted images of a BT257 tumor for the data acquisition schemes. As expected, BAY-1436032 treatments enhanced animal survival, and slowed tumor growth (ncontrol=3 and ntreated=4), however, tumor shrinkage was not observed (see Figure 2A and 2B). Figure 3 illustrates the slab data and shows the dynamic evolution of HP [5-12C-1-13C]αKG metabolism in BT257 tumor-bearing rat brain demonstrating 2HG production before treatment (Day 0, Figure 3A) and only glutamate production following treatment (Day 10, Figure 3B). The quantified dynamic curves of each metabolite before and after treatment are shown in Figures 3C and 3D, respectively. Signal differences for 2HG and glutamate between pre-and post-treatment were statistically significant (p<0.001). Furthermore, the dynamic heatmaps of 2HG and glutamate obtained from the HP-13C EPSI acquisition before (Figure 4A) and following (Figure 4B) treatment demonstrated that 2HG observed within the tumor before treatment was no longer detectable after treatment. In contrast, some glutamate could be detected in the normal brain before treatment but was present throughout the brain and in the tumor following treatment.Discussion
This study shows the value of HP[5-12C-1-13C]αKG, which eliminated the natural abundance peak of [5-13C]αKG at 184 ppm. When combined with an optimized RF pulse which minimized the exciting of the substrate peak and maximized excitation of the products, we were able to clearly monitor the dynamic localized production of both 2HG and glutamate in vivo in real-time. Importantly, we confirmed the value of this approach by showing that a drop in 2HG that was accompanied by an increase in glutamate was associated with the inhibition of tumor growth and enhanced animal survival. This finding is consistent with our previous observations in cells. It is also consistent with previous studies in vivo using 1H-MRS that showed that treatment with mutant IDH inhibitors and enhanced animal survival were associated with a drop in 2HG and an increase in glutamate8. Collectively, our observations point to the added value of MRS for early detection of tumor response to therapy, even when tumor shrinkage is not observed.Acknowledgements
This work was supported by NIH R01CA172845, NIH R01CA197254, UCSF LOGLIO collective, NICO project, and center grant P41EB013598References
1. Chaumeil MM, Larson PE, Yoshihara HA, Danforth OM, Vigneron DB, Nelson SJ, Pieper RO, Phillips JJ, Ronen SM. Non-invasive in vivo assessment of IDH1 mutational status in glioma. Nature communications 2013;4(1):1-12.
2. Chaumeil MM, Larson PE, Woods SM, Cai L, Eriksson P, Robinson AE, Lupo JM, Vigneron DB, Nelson SJ, Pieper RO, Phillips JJ. Hyperpolarized [1-13C] Glutamate: A Metabolic Imaging Biomarker of IDH1 Mutational Status in GliomaHyperpolarized Glutamate as an Imaging Marker of Mutant IDH1. Cancer research. 2014 Aug 15;74(16):4247-57.
3. Molloy AR, Najac C, Viswanath P, Lakhani A, Subramani E, Batsios G, Radoul M, Gillespie AM, Pieper RO, Ronen SM. MR-detectable metabolic biomarkers of response to mutant IDH inhibition in low-grade glioma. Theranostics 2020;10(19):8757-8770.
4. Hong D, Batsios G, Viswanath P, Gillespie AM, Vaidya M, Larson PE, Ronen SM. Acquisition and quantification pipeline for in vivo hyperpolarized 13C MR spectroscopy. Magnetic Resonance in Medicine. 2022 Apr;87(4):1673-87.
5. Miura N, Mushti C, Sail D, AbuSalim JE, Yamamoto K, Brender JR, Seki T, AbuSalim DI, Matsumoto S, Camphausen KA, Krishna MC. Synthesis of [1‐13C‐5‐12C]‐alpha‐ketoglutarate enables noninvasive detection of 2‐hydroxyglutarate. NMR in Biomedicine. 2021 Nov;34(11):e4588.
6. Pusch S, Krausert S, Fischer V, Balss J, Ott M, Schrimpf D, Capper D, Sahm F, Eisel J, Beck A-C. Pan-mutant IDH1 inhibitor BAY 1436032 for effective treatment of IDH1 mutant astrocytoma in vivo. Acta neuropathologica 2017;133(4):629-644.
7. Brender JR, Kishimoto S, Merkle H, Reed G, Hurd RE, Chen AP, Ardenkjaer-Larsen JH, Munasinghe J, Saito K, Seki T, Oshima N. Dynamic imaging of glucose and lactate metabolism by 13C-MRS without hyperpolarization. Scientific reports. 2019 Mar 4;9(1):1-4.
8. Radoul M, Hong D, Gillespie AM, Najac C, Viswanath P, Pieper RO, Costello JF, Luchman HA, Ronen SM. Early noninvasive metabolic biomarkers of mutant idh inhibition in glioma. Metabolites. 2021 Feb 13;11(2):109.
Figures