3916
Identifying spreading depression during coma induction with multi-modal fMRI
Yuanyuan Jiang1, Zeping Xie1, Wenchao Yang1, Bei Zhang1, David Hike1, Andy Liu1,2, Brian L. Edlow1,3, and Xin Yu1
1Martinos Center for Biomedical Imaging, Massachusetts General Hospital, Charlestown, MA, United States, 2Department of Neuroscience, Boston University, Boston, MA, United States, 3Center for Neurotechnology and Neurorecovery, Department of Neurology, Massachusetts General Hospital, Boston, MA, United States
1Martinos Center for Biomedical Imaging, Massachusetts General Hospital, Charlestown, MA, United States, 2Department of Neuroscience, Boston University, Boston, MA, United States, 3Center for Neurotechnology and Neurorecovery, Department of Neurology, Massachusetts General Hospital, Boston, MA, United States
Synopsis
Keywords: Stroke, Ischemia, coma, spreading depression
We have demonstrated spreading depression as a key event contributing to coma induction following the ET-1 injection to the brainstem of rats. Multi-modal fMRI enables the whole brain functional mapping to present the spatial dynamic changes during coma induction, in particular, paired with the incidence of SD events.INTRODUCTION
Previously, our lab developed a robust coma rat model by introducing the ET-induced ischemic injury in the dorsomedial brainstem1. Here, we optimized the injection protocol of endothelin-1 (ET-1) into the tegmentum, enabling simultaneous fMRI and fiber photometry-based Ca2+/Glu recording with real-time micro-injection of ET-1. This method enables measuring brain dynamic changes during the onset of coma and the comatose state progression in the acute 12-hour time window. Interestingly, the spreading depression (SD) event has been reliably detected during the first 10-15 min following the onset of coma induction. Whole brain fMRI presented oxygenation changes and Glu signals indicated the initiation of the iso-electric state, as well as the SD. This work revealed the critical contribution of SD during coma induction and highlights the critical usage of multi-modal fMRI to specify the underlying brain dynamic changesMETHODS
Animal ModelMale Long Evans male rats (~250g) were induced with 5% and maintained at 1%-2% isoflurane. The rats’ rectal temperature was maintained at around 37oC. The genetically encoded reporter iGluSnFR or GCaMP6f was expressed by the AAV virus in the forepaw somatosensory cortex. Optical fiber (200 µm) was inserted into the cortex (e.g. somatosensory cortex) expressing the fluorescent biosensors for recording. Isoflurane is withdrawn after the coma induction. Animals were incubated during scanning.
MR Techniques
All images were acquired with a 14 T/ 13 mm horizontal bore magnet (Magnex), interfaced to a Bruker AV-Neo console (Bruker), and equipped with a 6 cm gradient set, capable of providing 1.2 T/m (Resonance Research). A transceiver surface coil was used to acquire fMRI images. fMRI scans with block design were performed using 3D Echo planar imaging sequence: TR=1.5s, TE=7.5ms, FOV=2.4X2.4X2.0 cm3, 96X96X40 matrix.
RESULTS
We have implemented microinjection of ET-1 with peek tubing into the brainstem tegmentum through the ventral surface of the brain (Fig 1A). As shown in Fig 1B, after the coma induction the apnea was detected based on a change in shape and amplitude of the ventilatory pressure waveform (spontaneous breathing vs. apnea insert). The cortical and brainstem activity, as measured by local field potentials (LFP), is abruptly vanished in 3-5 min after the ET-1 injection and withdrawal of the anesthetic. We combined fiber photometry for glutamate (Glu) signal recording using the genetically encoded sensors( iGluSnFR) and whole-brain MR imaging during the coma induction. The extracellular glutamate recording showed spontaneous spikes decreased after the ET-1 injection(Fig 2), which was accompanied by a positive Glu spike, i.e. SD event. During ET-1 microinjection, the BOLD fMRI responses can trace the vasoconstriction in the brainstem injection site (negative BOLD, blue dot). In 8-10 min, we observed broad vasoconstriction across the brainstem (blue patch), and positive BOLD of higher-level regions, which may indicate flow compensation. The SD occurred 12 min after ET-1 injection, coinciding with a largely spread negative BOLD signal in the brain, which could be caused by suppression of neuronal activity and also the diffusion of ET-1 (Fig 3). A control group, of which the ET-1 is directly injected into the 4th ventricles, will be used to elucidate the cause of the spreading of negative BOLD signals following SD. Fig 4 shows two representative SD-related fMRI maps following coma induction, presenting highly reproducible global negative fMRI responses. However, it should be noted that detailed brain functional changes coupled with SD need to be verified from the global negative BOLD signals in our future study.CONCLUSIONS
We optimized a brainstem coma induction model with real-time monitoring of the LFP, whole-brain fMRI, and fiber photometry-based Glu recording during coma induction and acute coma recovery. We observed that spreading depression events occurred during coma induction, contributing to neuronal activity suppression (as evidenced by iso-electric lines).Acknowledgements
This research was funded by NIH funding (RF1NS113278, RF1NS124778, R01NS122904, R01NS120594), NSF grant 2123971, and the S10 instrument grant (S10 MH124733–01) to Martino’s Center.References
1 Pais-Roldan, P. et al. Multimodal assessment of recovery from coma in a rat model of diffuse brainstem tegmentum injury. Neuroimage 189, 615-630, doi:10.1016/j.neuroimage.2019.01.060 (2019).Figures
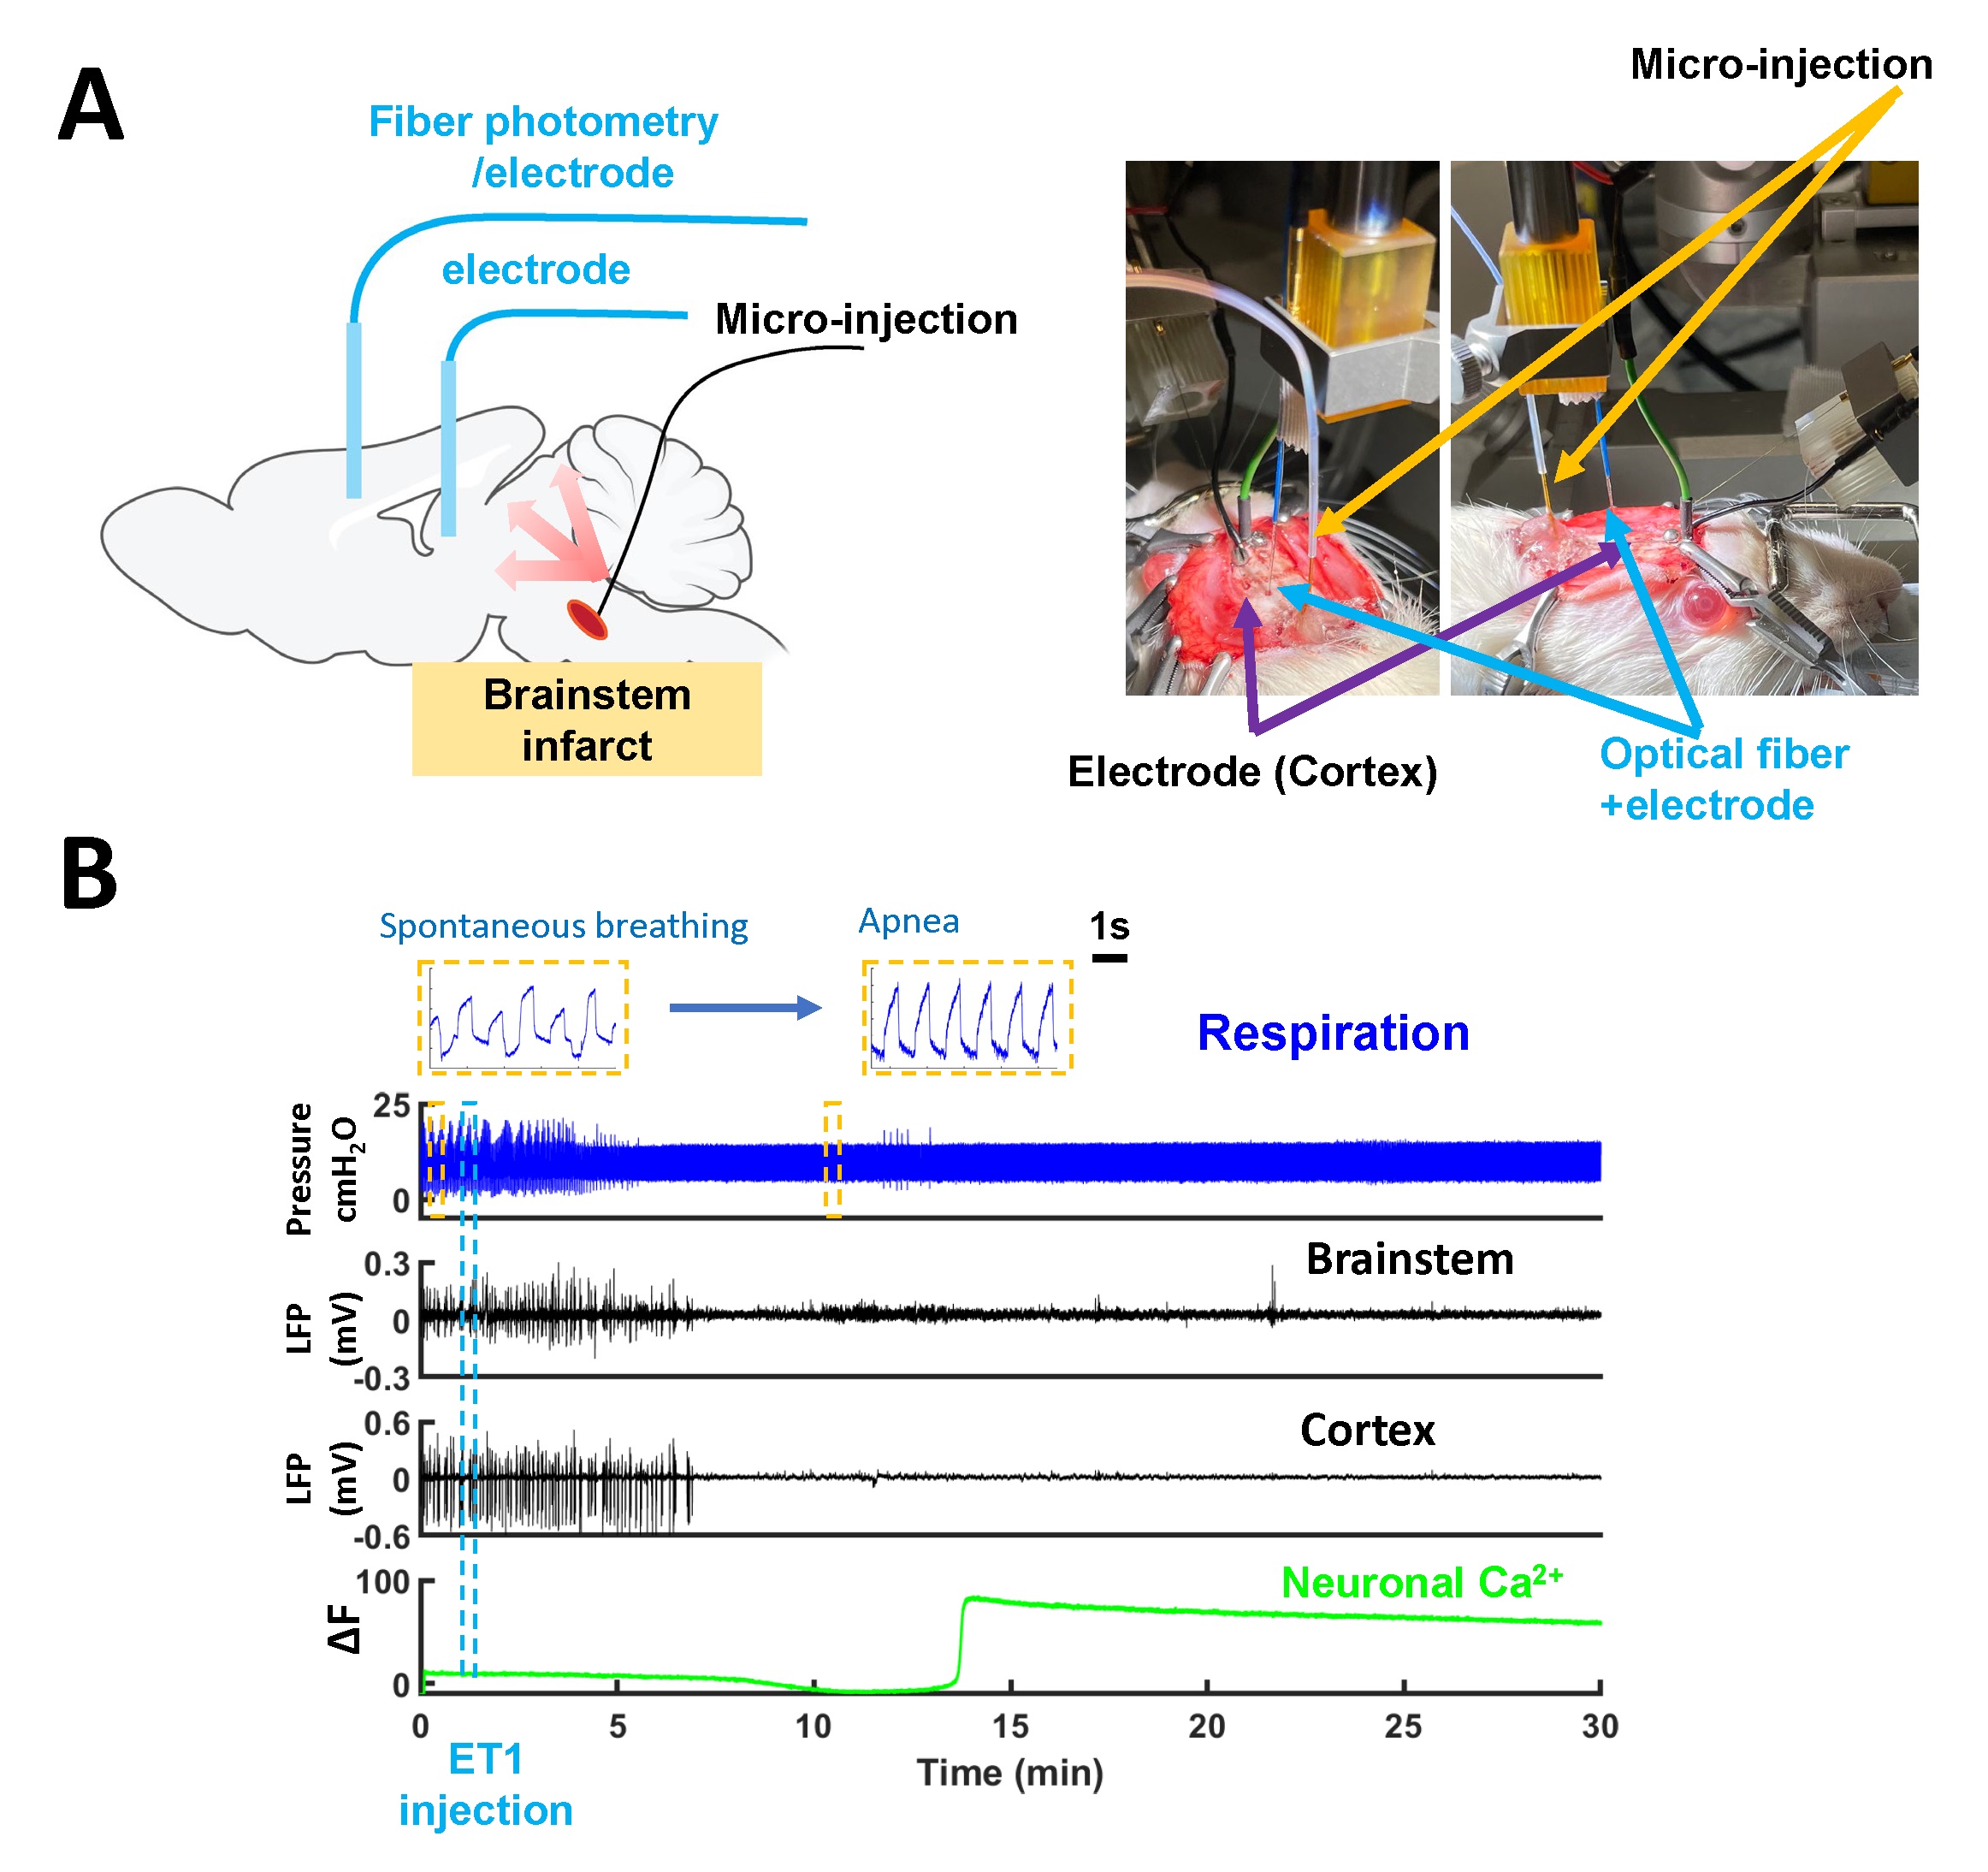
Figure 1. Real-time brainstem coma
induction model for neuro-glio-vascular (NGV) signaling with multimodal fMRI
platform. (A) The
scheme of microinjection of ET-1 into tegmentum through the ventral surface of
the brain and the fiber photometry-based NGV dynamic signal recording. (B)
Electrophysiological LFP monitoring of brainstem and cortex and neuronal
calcium fiber photometry recording during coma induction in a representative
animal.
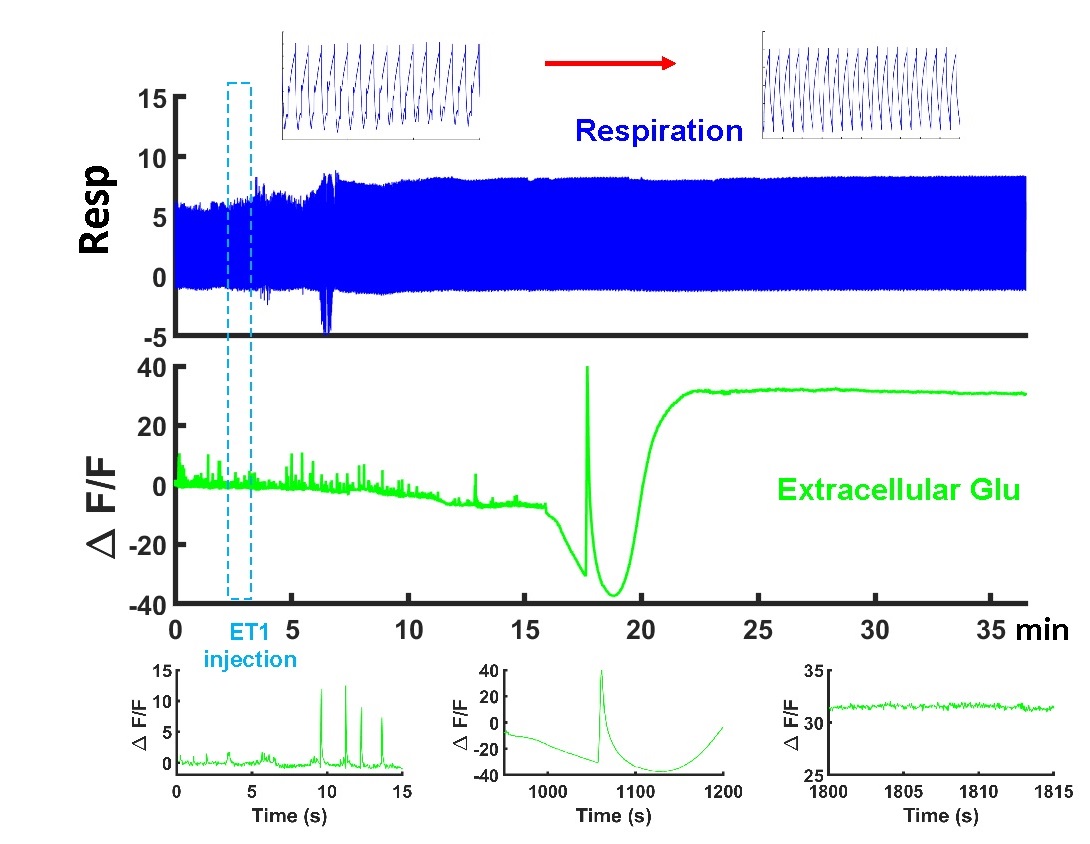
Figure 2. Real-time extracellular glutamate
signaling dynamics following coma induction. The spontaneous spikes decreased
after the ET-1 injection and spreading depression-like events presented during
the coma induction.
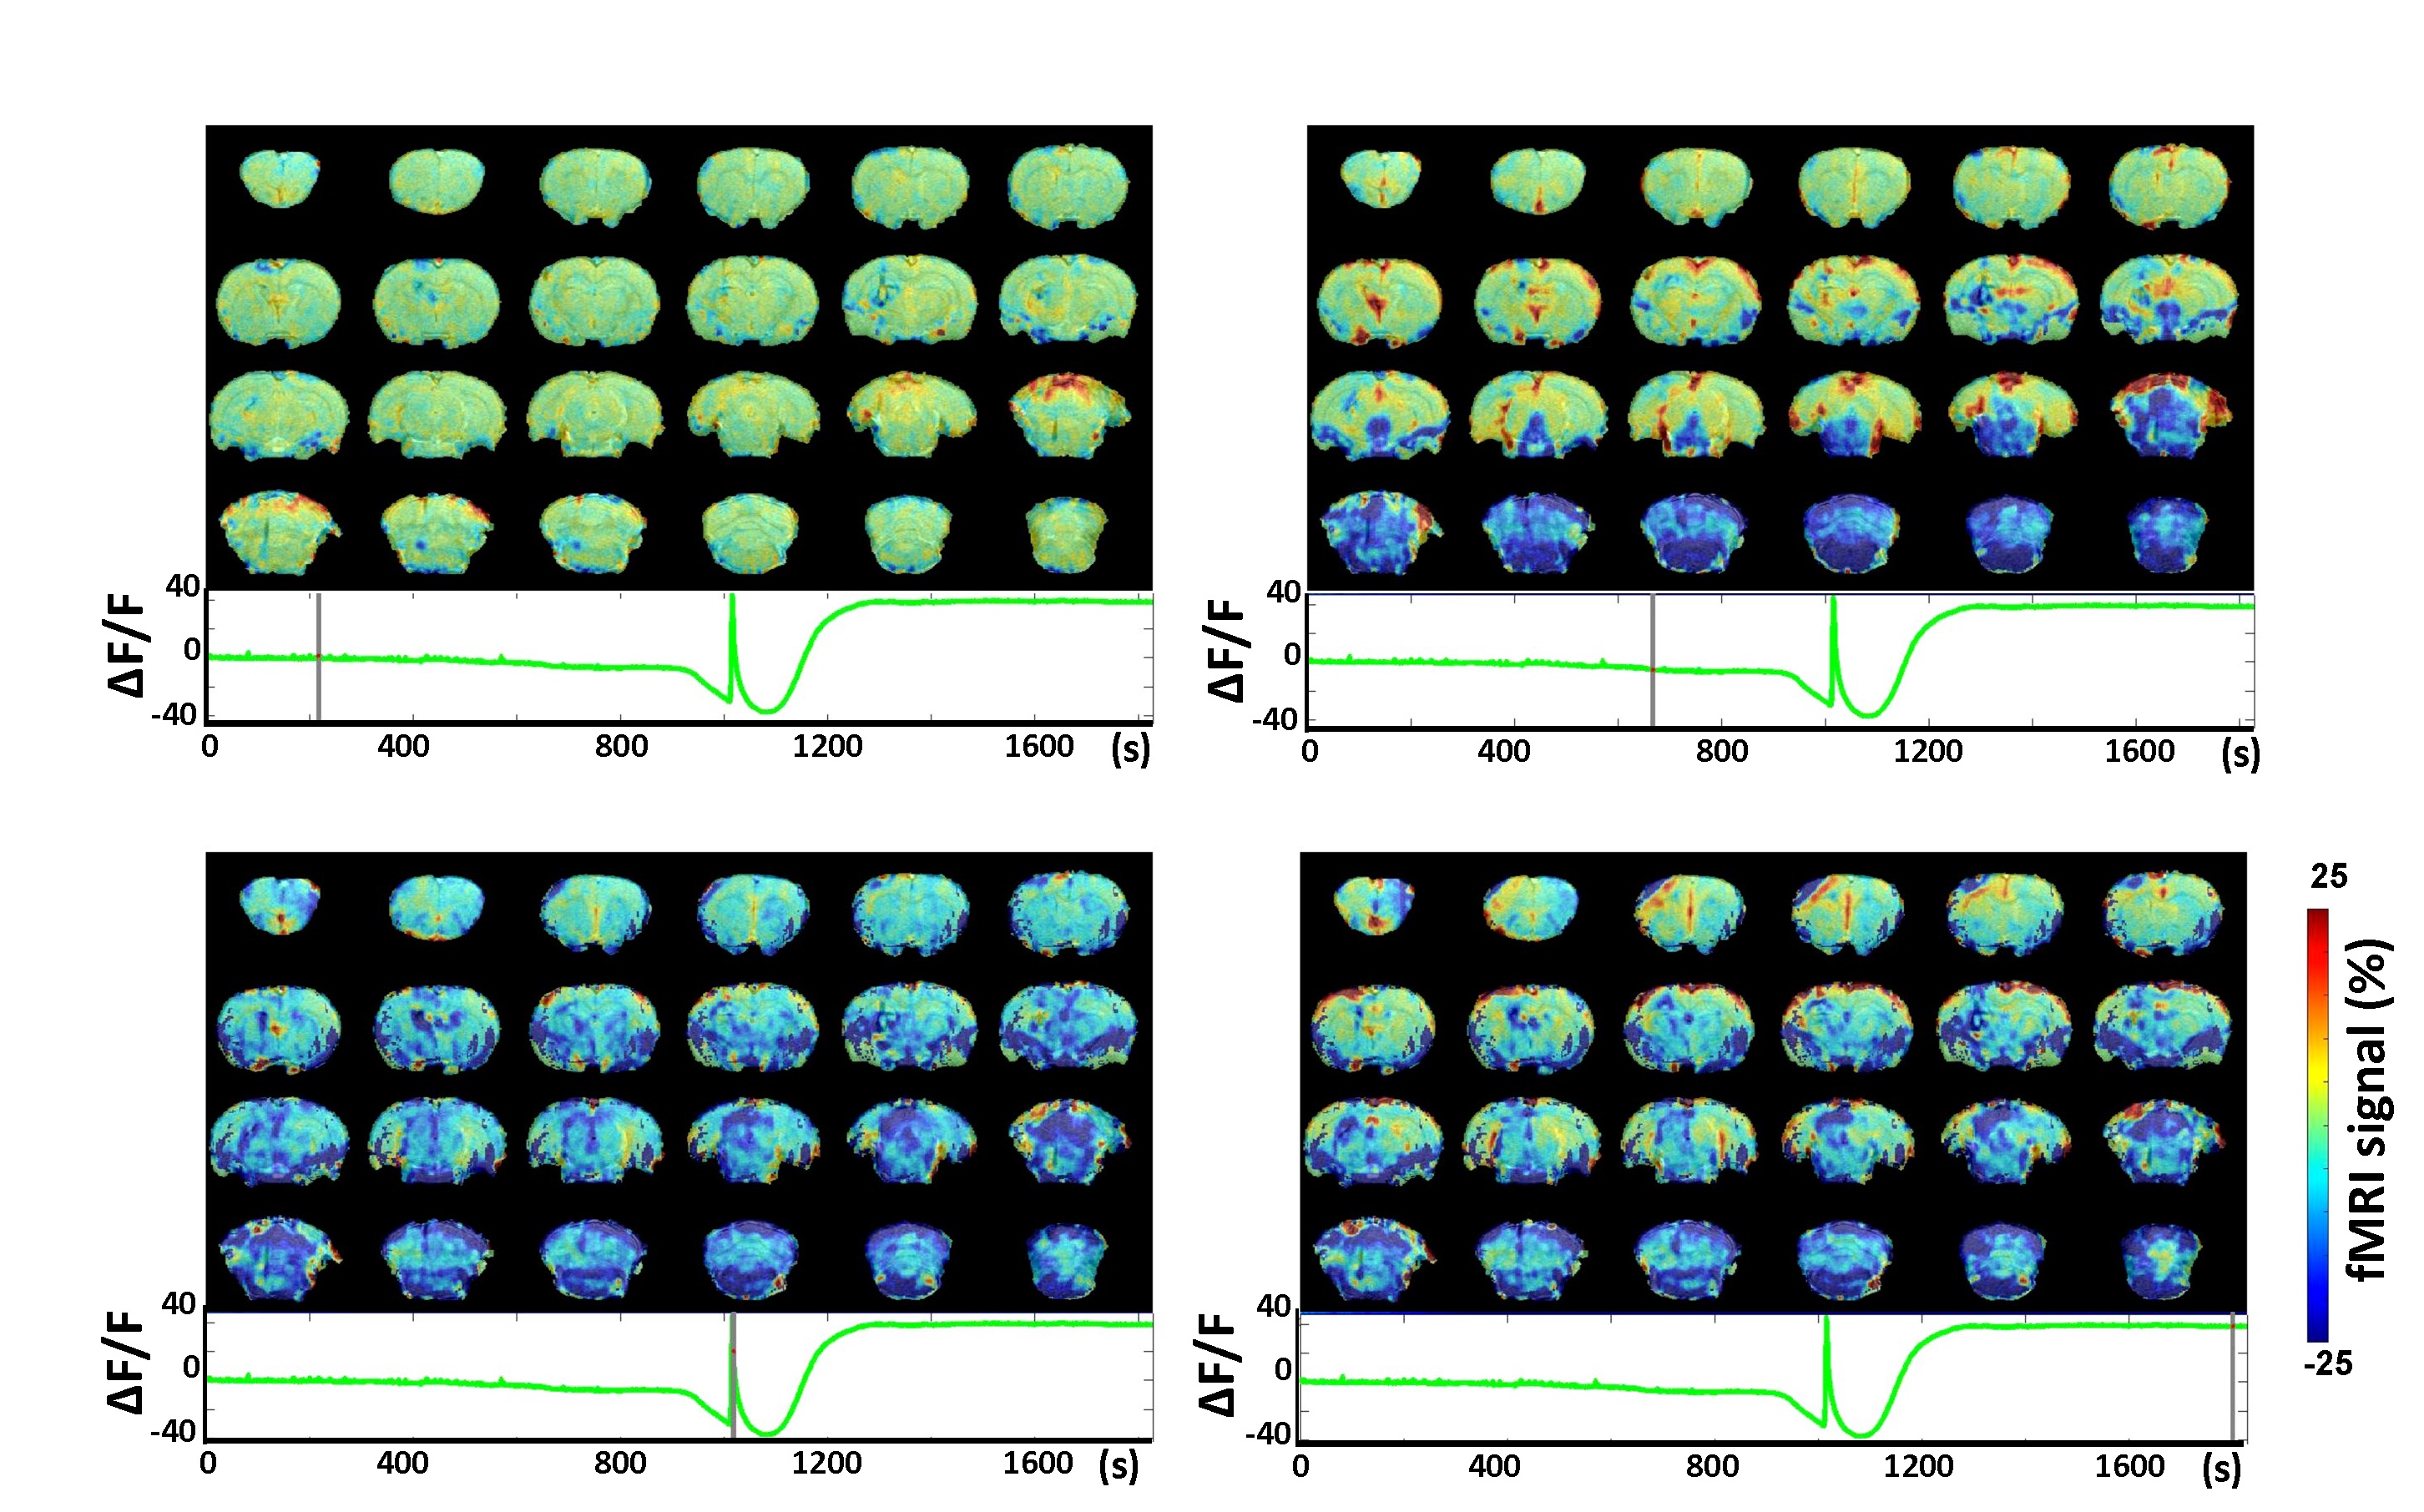
Figure 3. The whole brain signal propagation with spreading
depression(SD)-like event in real-time brainstem coma induction. The MRI map during injection, short after injection,
during (SD) peak, and after the SD.
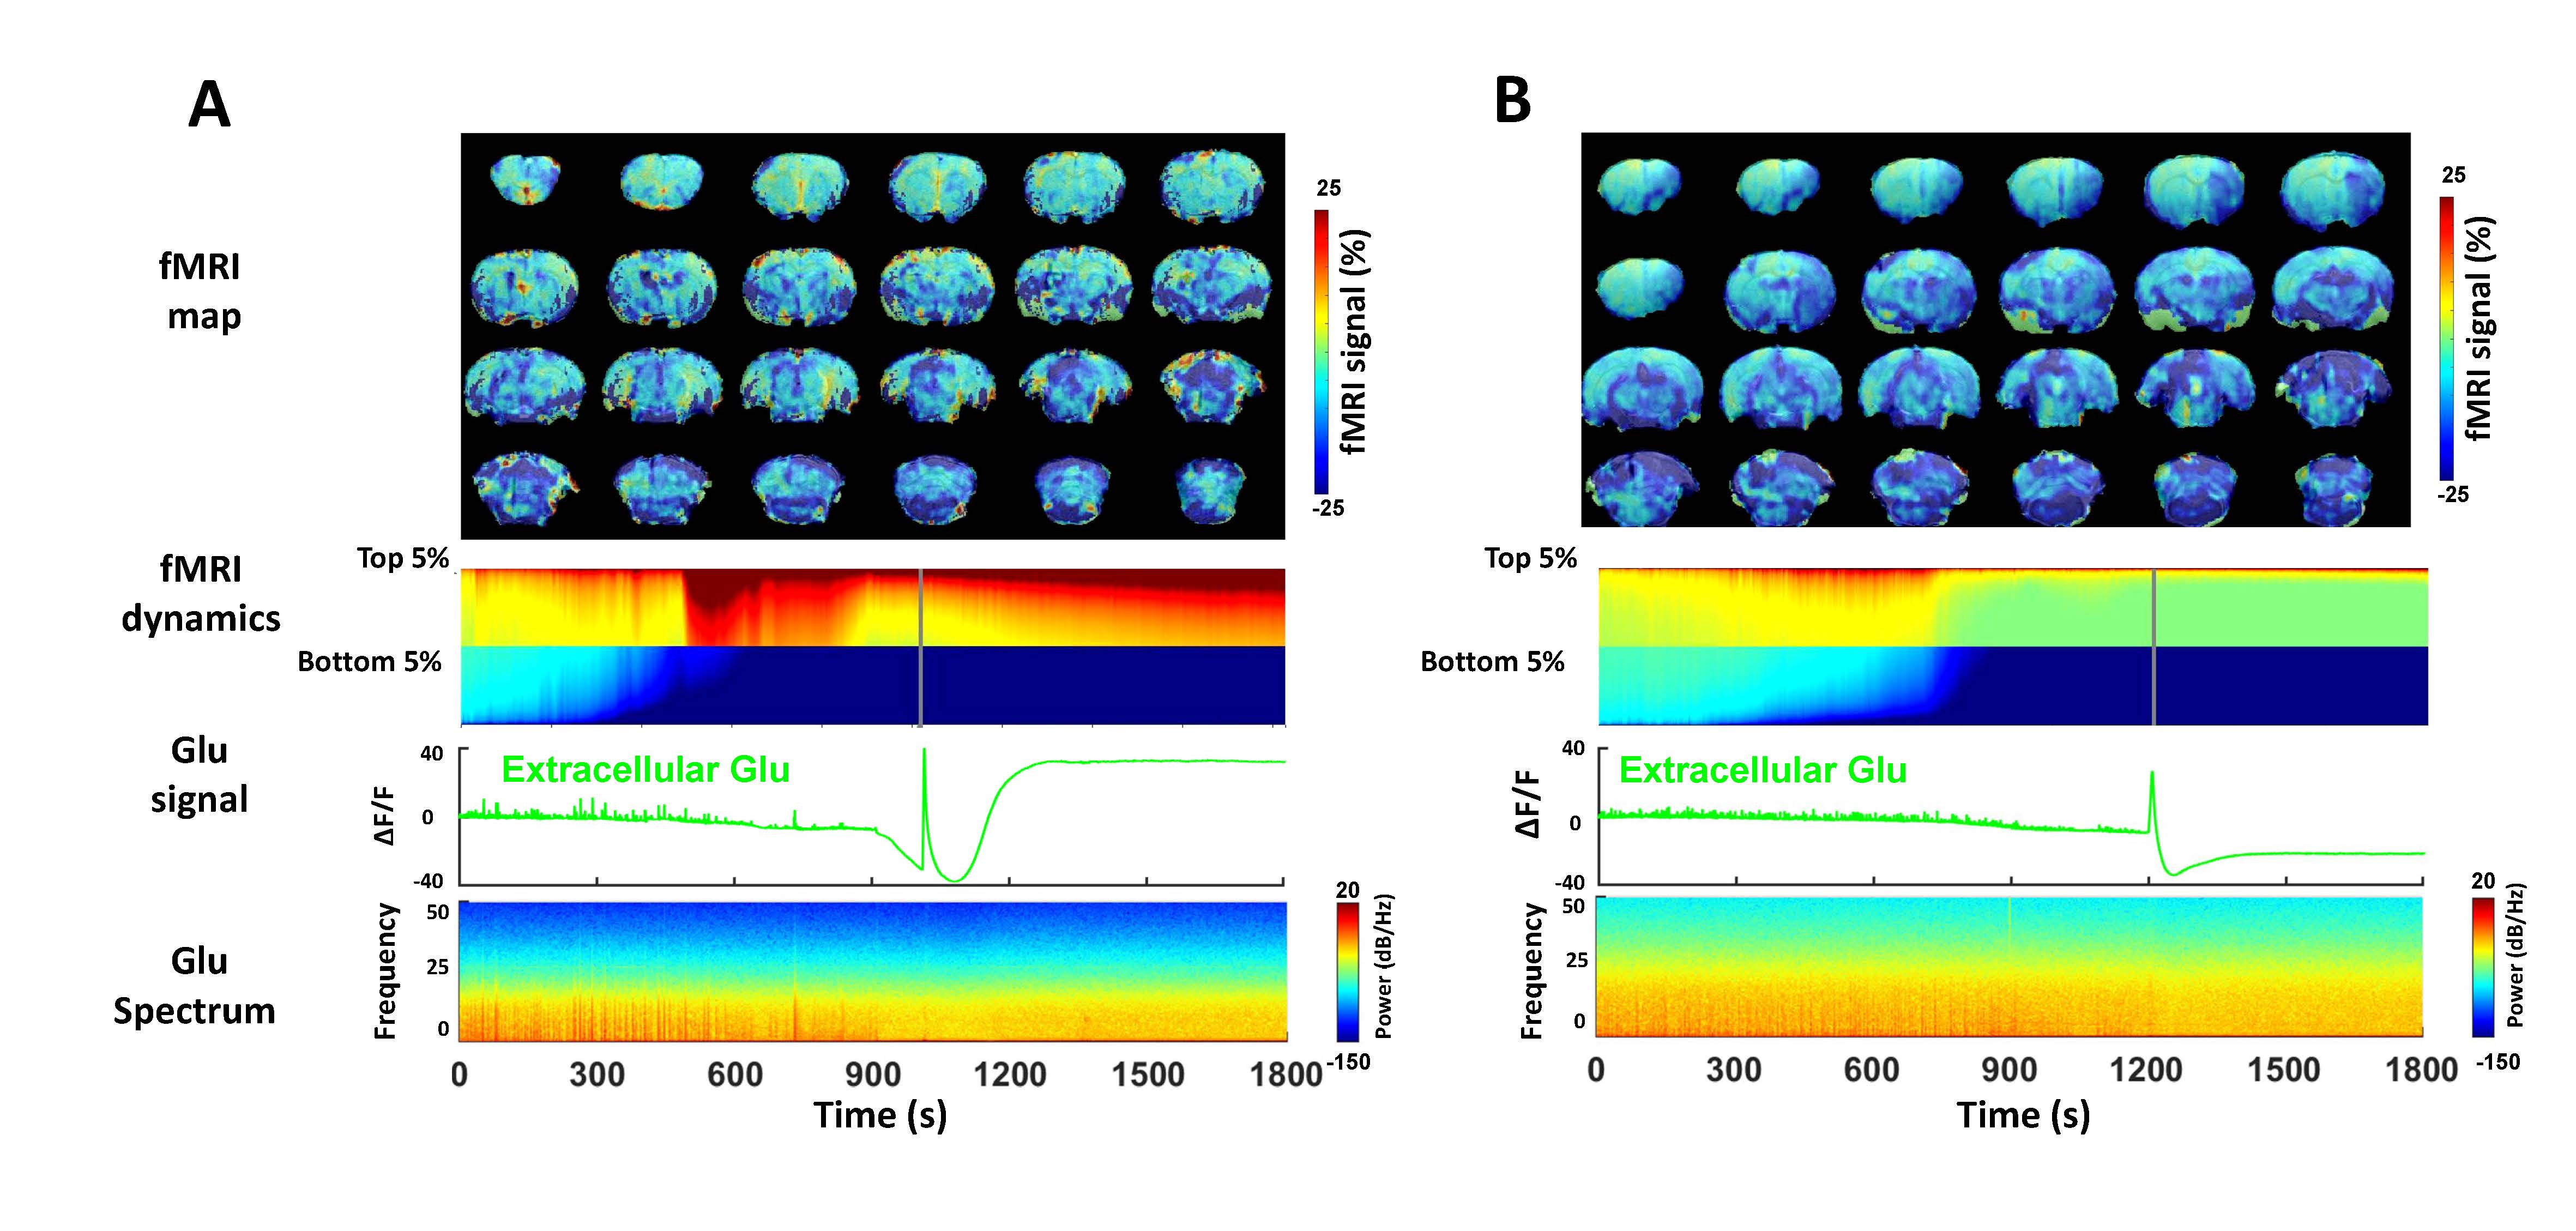
Figure 4. Representative correlation between Glu power spectrum and fMRI
signal change during the coma induction from different animals (A and B). The
dynamics of the top 5% and bottom 5% of fMRI volume were extracted to reflect
the most dramatic fMRI signal.
DOI: https://doi.org/10.58530/2023/3916