3888
Deep Learning Reconstruction for Magnetic Resonance Image Quality Improvement in Lumbar Endplate Inflammation1radiology department, West China Hospital,Sichuan University, Chengdu, China, 2MR Research, GE Healthcare, Beijing, China
Synopsis
Keywords: Machine Learning/Artificial Intelligence, Image Reconstruction
Magnetic resonance imaging (MRI) is a useful tool to diagnose lumbar endplate inflammation. It is thus important to improve diagnostic accuracy by improving image quality. In this study, we compared signal-to-noise ratio (SNR), contrast noise ratio (CNR) and subjective scores between original images and deep learning reconstruction (DL Recon) images in 31 patients diagnosed with lumbar endplate inflammation. It was observed that the deep learning reconstructed images outperformed conventional images in terms of both subjective scores and objective values.Introduction
Lumbar endplate inflammation is one of the main causes of back and leg pain1,2. This disease manifests as changes in MRI signal adjacent to the endplates and the vertebral body3.4. MRI shows good definition of the lesion area, bone changes and ligament thickness. With recent progress of artificial intelligence, a deep learning reconstruction (DL Recon) based on convolutional neural networks (CNN) has been incorporated into routine scanning pipeline. The DL Recon can reduce noise levels in MR images and maintain image contrasts5. Preliminary studies have been conducted in musculoskeletal MRI6-8, the goal of this work was to investigate the use of DL Recon in lumbar spine MRI.Methods
From July 2022 to October 2022, 31 patients diagnosed with lumbar endplate inflammation by MRI were included in the study. The images were acquired at 3 T MRI scanner (SIGNA™ Architect, GE Healthcare). A 40-channel Spine Posterior Coil (GE Healthcare ,USA) was used. The examination of the lumbar spine includes sagittal fast spin-echo (FSE) T1-weighted, sagittal FSE T2-weighted fat saturated (FS) with following parameters: FSE T1WI TR/TE=653/13.4ms, FSE T2WI FS TR/TE=2074/90ms, thickness=3mm, field of view=300×300mm, matrix=352×224 and slices=11 or 13. Both deep learning reconstruction (AIR Recon DL) and conventional reconstructions were performed.To quantitatively assess image quality, the SNR and the CNR for both image sets were measured. Regions of interest (ROIs) were placed in the center regions of the lumbar vertebral on midline regions of sagittal from L1-L4, the five corresponding intervertebral discs, each lesion and muscle to define the signal intensity (SI). ROIs were also placed on background to define the noise as the standard deviation (SD). The SNR and CNR were calculated as:$$SNR=\frac{SI_{(interested\space tissue)}}{SD_{(background)}}$$$$CNR=\frac{|SI_{(interested\space tissue)}-SI_{muscle}|}{SD_{(background)}}$$Two independent radiologists (with 3 and 9 years of experience in MRI diagnosis) who were blinded to the clinical information and sequence identifiers assessed the image quality in a random order. The image quality of original and DL Recon groups was assessed separately for vertebral body, intervertebral disc, spinal cord, ligament, muscle, lesion using a 4-point Likert scale (1-poor, 2-ordinary, 3-good,4-perfect). When there was difference in scoring, two radiologists reached consensus after negotiation. All statistical analyses were performed by SPSS software (version 20.0). All findings of image quality were compared between original and DL Recon groups using Wilcoxon signed-rank test. P<0.05 was considered statistically significant.
Results
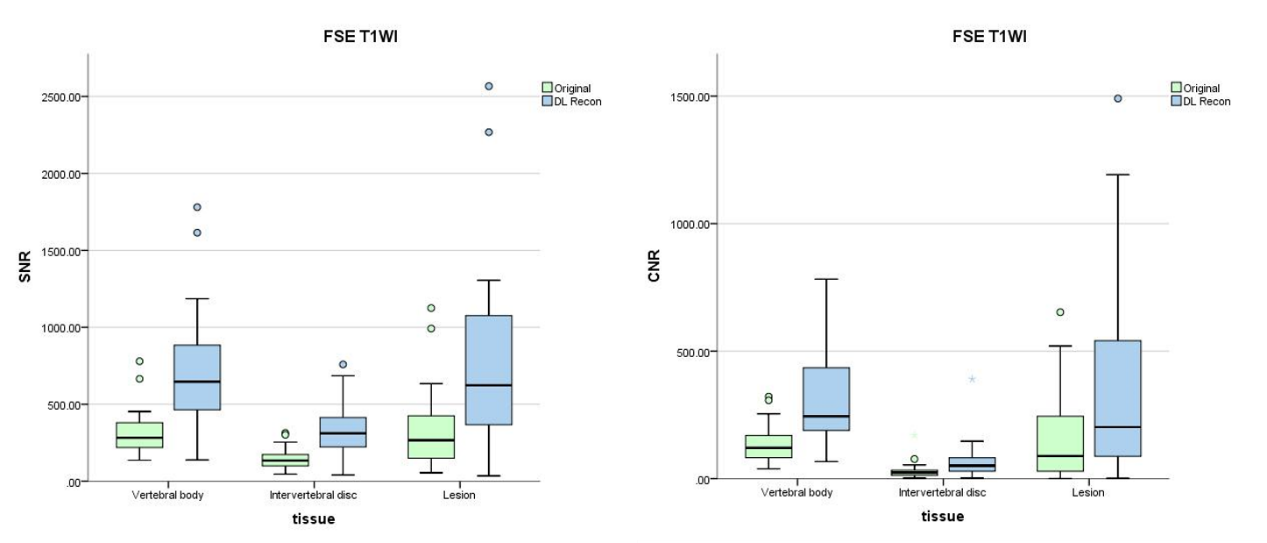
In total, 31 patients (15M/16F, mean age= 58.87±11.90, age range= [30-81]) with 50 lesions were included in the study.In the FSE T1WI sequence, the average SNR of original and DL Recon images for vertebral body was 311.0±142.2 and 710.8±359.8, for intervertebral disc was 144.9±63.1 and 331.7±158.6, for lesion was 314.7±219.4 and 724.1±506.5, respectively. The average CNR of original and DL Recon images for vertebral body was 137.0±69.5 and 312.6±173.7, for intervertebral disc was 29.8±31.2 and 67.5±71.5, for lesion was 147.2±148.2 and 335.3±341.9, respectively.
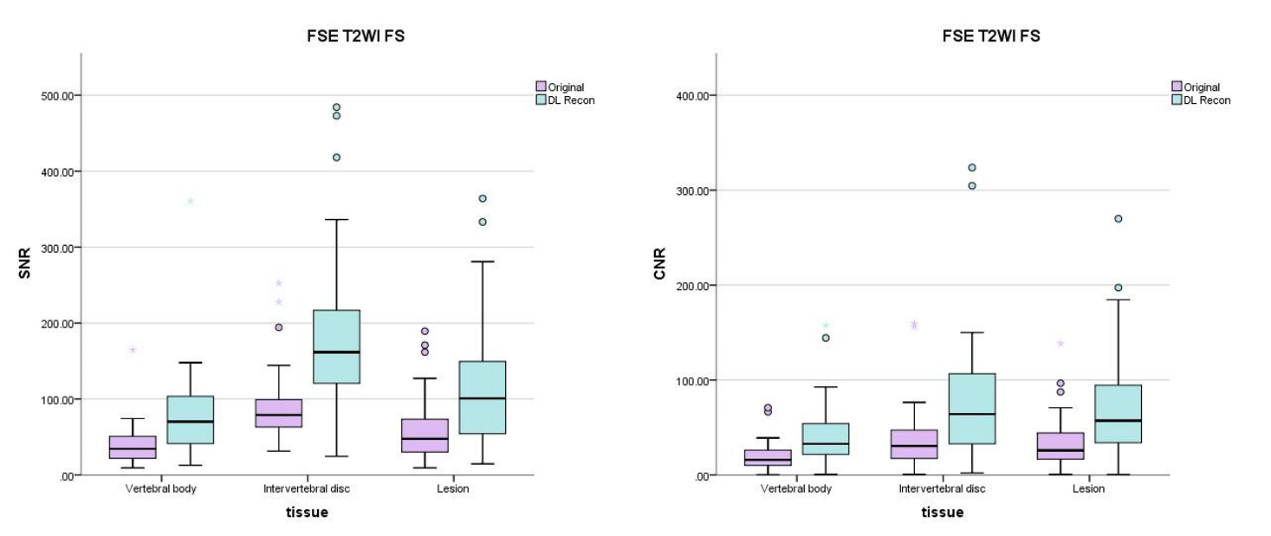
In the FSE T2WI FS sequence, the average SNR of original and DL Recon images for vertebral body was 40.4±28.7 and 81.4±63.1, for intervertebral disc was 92.5±51.8 and 188.1±110.3, for lesion was 58.3±41.3 and 116.9±81.5, respectively. The average CNR of original and DL Recon images for vertebral body was 20.0±16.9 and 42.8±36.9, for intervertebral disc was 39.5±36.8 and 81.1±74.0, for lesion was 33.7±26.6 and 69.1±53.5.
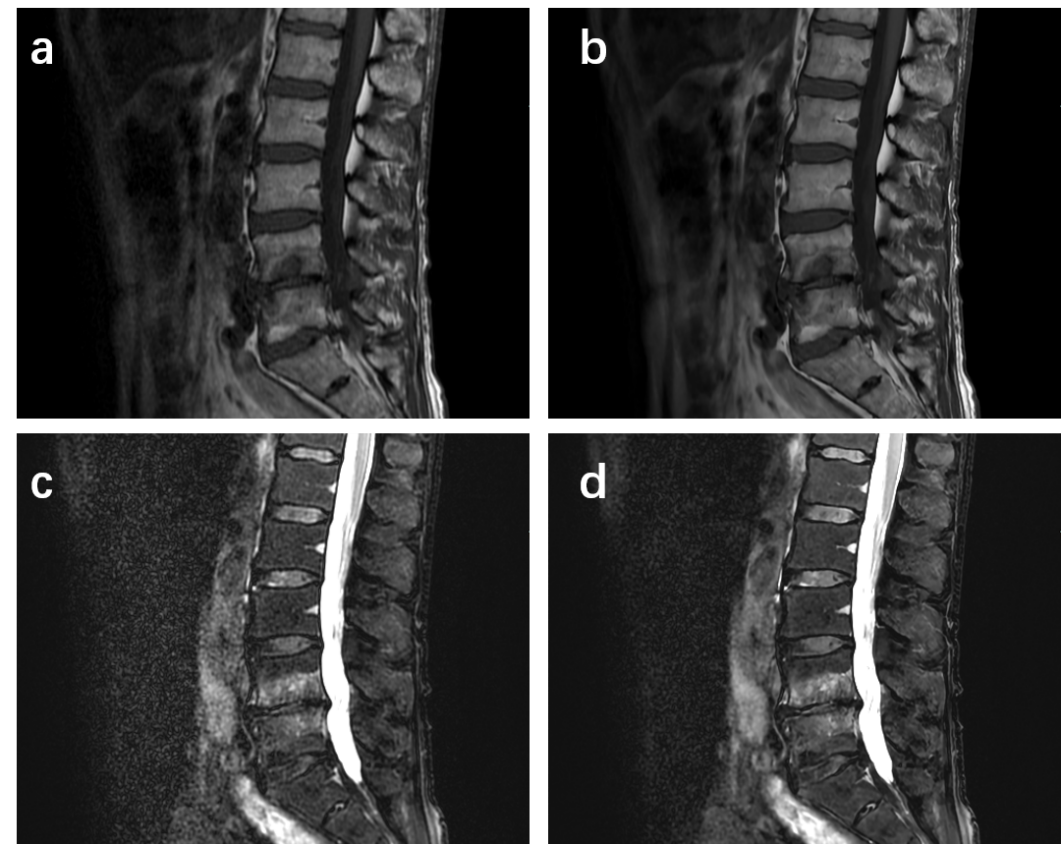
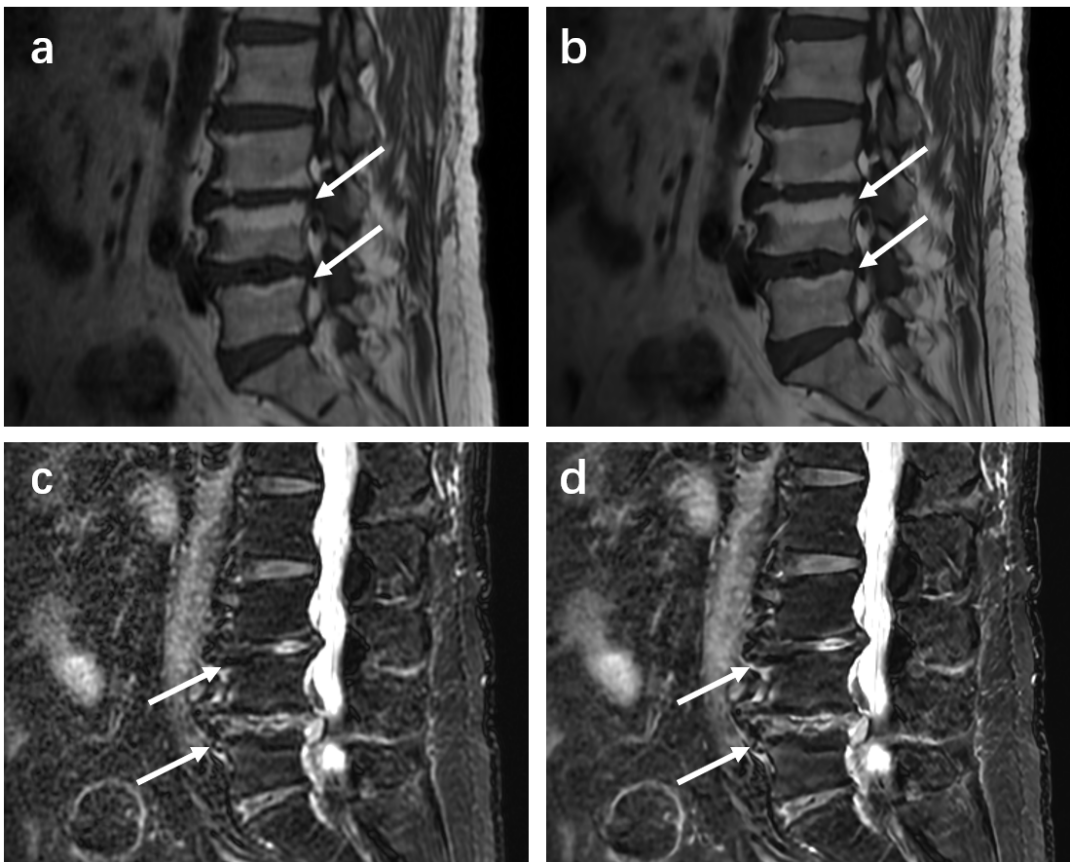
The SNR and CNR of DL FSE T1W1 group and DL T2 FS FSE group were higher than those of original image group (Figure 1 and Figure 2). The differences are statistically significant (P< 0.001). The subjective evaluation results of DL Recon images in the two sequences were better than the original images (Figure 3). The differences were also statistically significant (P< 0.001). The representative images were demonstrated in Figure 4 and Figure 5.
Discussion and Conclusions
The diagnostic value of spinal MRI is influenced by the SNR and clarity of the lesions. In this work, deep learning reconstructed FSE T1WI and DL FSE T2WI FS images showed improved SNR and CNR of lumbar vertebra compared to the conventionally reconstructed images. Deep learning reconstruction also received improved subjective assessment of the image quality and enabled clearer visualization of lesions in Lumbar Endplate Inflammation. Deep learning reconstruction may have potential value in routine examinations of lumbar spine magnetic resonance imaging.Acknowledgements
No acknowledgement found.References
1. Albert HB, Briggs AM, Kent P, Byrhagen A, Hansen C, Kjaergaard K. The prevalence of MRI-defined spinal pathoanatomies and their association with modic changes in individuals seeking care for low back pain. Eur Spine J. 2011;20(8):1355-1362. doi:10.1007/s00586-011-1794-6
2. Jensen RK, Leboeuf-Yde C, Wedderkopp N, Sorensen JS, Jensen TS, Manniche C. Is the development of Modic changes associated with clinical symptoms? A 14-month cohort study with MRI. Eur Spine J. 2012;21(11):2271-2279. doi:10.1007/s00586-012-2309-9
3. Modic MT, Masaryk TJ, Ross JS, Carter JR. Imaging of degenerative disk disease. Radiology. 1988;168(1):177-186. doi:10.1148/radiology.168.1.3289089
4. Modic MT, Steinberg PM, Ross JS, Masaryk TJ, Carter JR. Degenerative disk disease: assessment of changes in vertebral body marrow with MR imaging. Radiology. 1988;166(1 Pt 1):193-199. doi:10.1148/radiology.166.1.3336678
5. Koch KM, Sherafati M, Arpinar VE, Bhave S, Ausman R, Nencka AS, Lebel RM, McKinnon G, Kaushik SS, Vierck D, Stetz MR, Fernando S, Mannem R. Analysis and Evaluation of a Deep Learning Reconstruction Approach with Denoising for Orthopedic MRI. Radiol Artif Intell. 2021 Aug 11;3(6):e200278. doi: 10.1148/ryai.2021200278. PMID: 34870214; PMCID: PMC8637471.
6. Recht MP, Zbontar J, Sodickson DK, et al. Using Deep Learning to Accelerate Knee MRI at 3 T: Results of an Interchangeability Study. AJR Am J Roentgenol. 2020;215(6):1421-1429. doi:10.2214/AJR.20.23313
7. Chaudhari AS, Grissom MJ, Fang Z, et al. Diagnostic Accuracy of Quantitative Multicontrast 5-Minute Knee MRI Using Prospective Artificial Intelligence Image Quality Enhancement. AJR Am J Roentgenol. 2021;216(6):1614-1625. doi:10.2214/AJR.20.24172
8. Hahn S, Yi J, Lee HJ, et al. Image Quality and Diagnostic Performance of Accelerated Shoulder MRI With Deep Learning-Based Reconstruction. AJR Am J Roentgenol. 2022;218(3):506-516. doi:10.2214/AJR.21.26577
Figures