3874
Comparison the metabolism of [2H2]glucose,[2H7]glucose and [2H5]glucose in rat C6 glioma cells1Lauterbur Imaging Research Center, Shenzhen Institute of Advanced Technology, Chinese Acamedy of Sciences, Shenzhen, China, 2Southern University of Science and Technology, Shenzhen, China, 3Key Laboratory for Magnetic Resonance and Multimodality Imaging of Guangdong Province, Shenzhen, China, 4Department of Biomedical Engineering, State University of New York at Buffalo, Buffalo, NY, United States
Synopsis
Keywords: Deuterium, Deuterium
Deuterium MRS(I) has emerged as a novel metabolic imaging method, which can effectively reflect the increased aerobic glycolysis of tumors. Recently, [2,3,4,6,6-2H5] glucose has been shown to be a cost-effective deuterium-labeled substrate for studying glycolysis in tumors. However, the effects of different deuterium-labeled substrates on metabolism require further comparison. In this study, we compared the differences between [6,6-2H2] glucose, [1,2,3,4,5,6,6’-2H7] glucose, and [2,3,4,6,6-2H5] glucose in rat C6 glioma cells.Introduction
Recently, Deuterium MRS(I) was proposed as a simple and powerful MR-based method for mapping metabolism with high temporal/spatial resolution1. In recent deuterium MRS(I) studies, deuterated glucose was the most commonly used deuterated substrate1-3. However, the deuterated substrates, such as [6,6’-2H2]glucose and [1,2,3,4,5,6,6’-2H7] glucose4, are expensive. Recently, [2,3,4,6,6-2H5] glucose has been considered a cost-effective alternative to deuterium-labeled glucose 5. In this study, we compared [6,6'-2H2] glucose,[2,3,4,6,6-2H5] glucose and [1,2,3,4,5,6,6’-2H7] glucose in rat C6 glioma cells through ex vivo experiments.Materials and Methods
Cell culture:Cell culture:Rat C6 glioma cells were purchased from the American Type Culture Collection (ATCC, Manassas, VA, USA). C6 cells were cultured in a complete growth medium composed of DMEM with 10% FBS and 1% (v/v) streptomycin–penicillin. Cell lines were cultured at 37 ℃ in a 95% air and 5% CO2 atmosphere in an air-jacketed incubator. The growth medium was replenished every 3 days and once at 80% confluent cells were cultured into six 100 mm OD cell culture plates(~106 cells). When all cell lines were grown to 70–80% confluency and washed once with warm PBS and incubated with 1 mL each of either DMEM with 5mM of three kinds of deuterated glucose for 6h. During the 6 h treatment, 500 µL aliquots were collected at 0 hr, 1 hr, 2 hrs, 4 hrs , and 6 hrs for NMR analysis. All experiments were repeated three times.NMR sample preparation:Cell media samples were prepared without extraction. Pyrazine-D4 was added to each sample as an internal reference with a final concentration of 1mM. For the purpose of collecting NMR data, 500 µL of the cell media sample from each time point was placed into 5 mm NMR sample tubes.
2H-NMR scan: The experiments were conducted on a Bruker AVANCE III HD 600MHz NMR system (Bruker, Ettlingen, Germany). The acquisition parameters were:TR=3000ms, flip angle = 90°, and acquisition bandwidth=11 ppm with 2172 points.
Data processing: The 2H-NMR data analysis was performed using MestReNova v14.0.1-23284 (Mestrelab Research S.L.). The FID was zero-filled to 4096 points before Fourier transform (FT), and the 2H-NMR spectra were processed using an exponential window function of 0.3 Hz. Each spectrum was manually phase-corrected, followed by an automatic spline baseline correction. Finally, the corrected spectra were all fitted to the Lorentz-Gaussian model.
Results
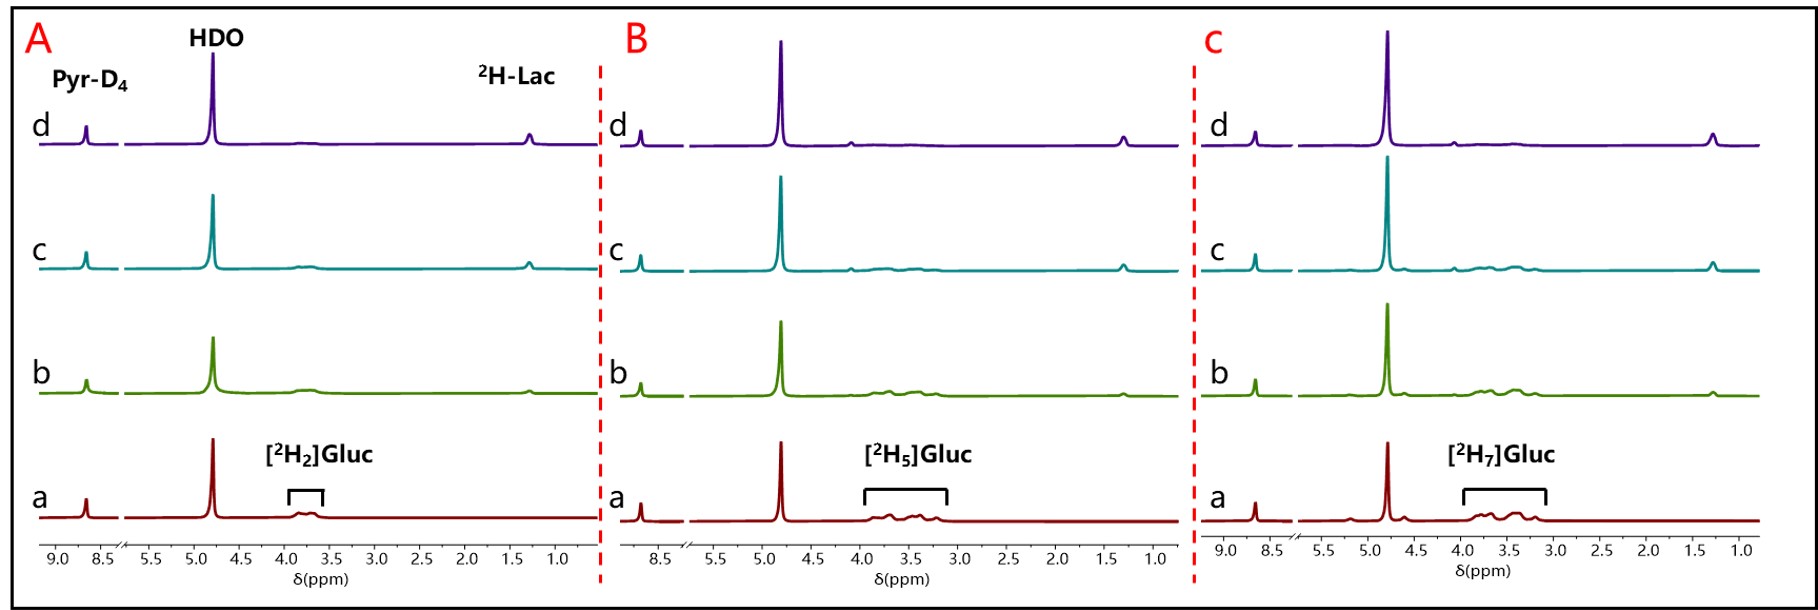
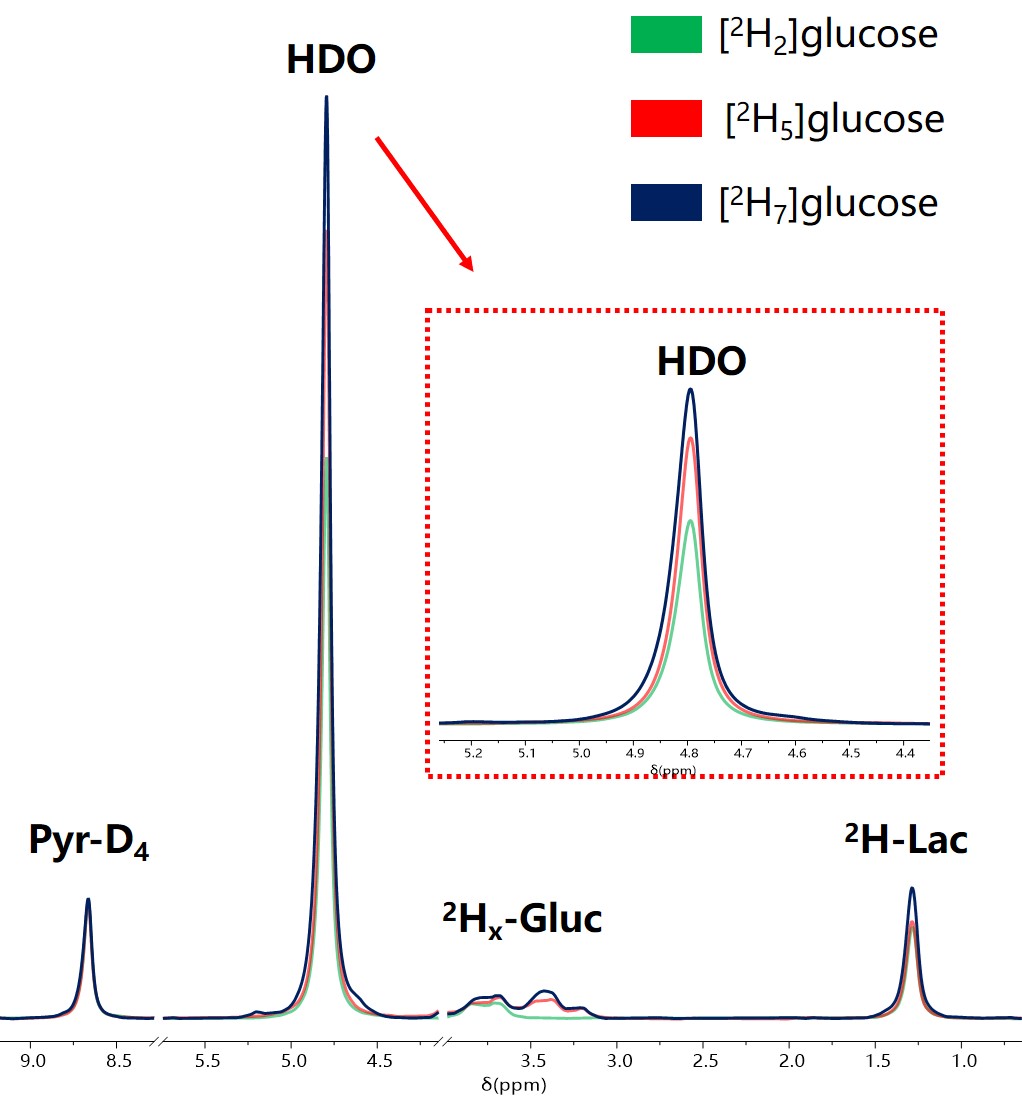
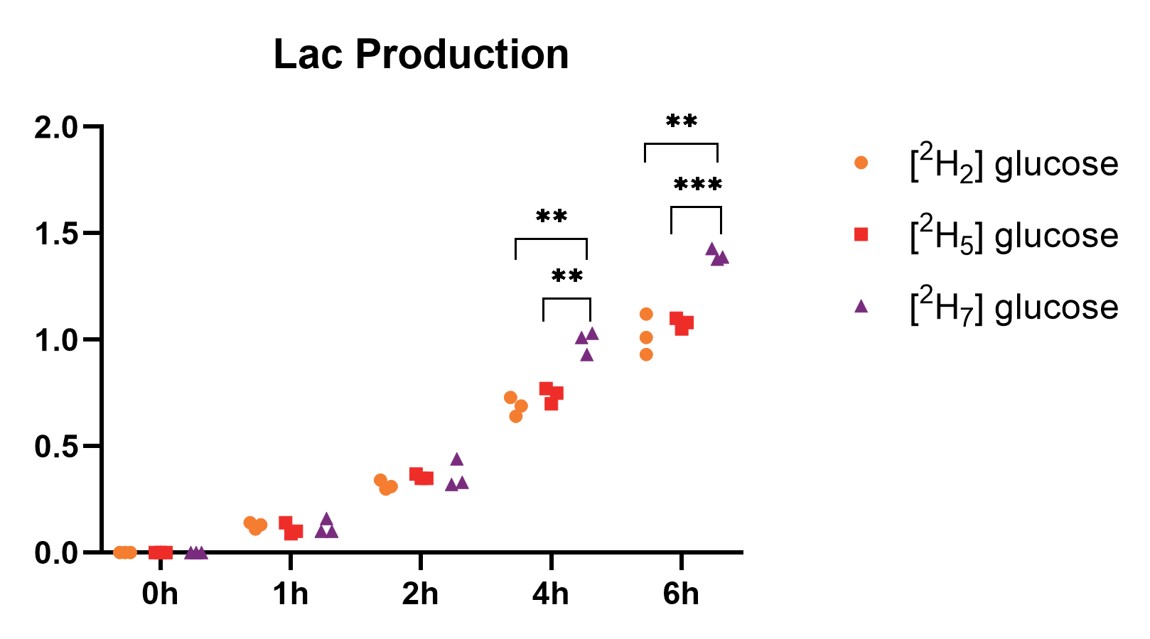
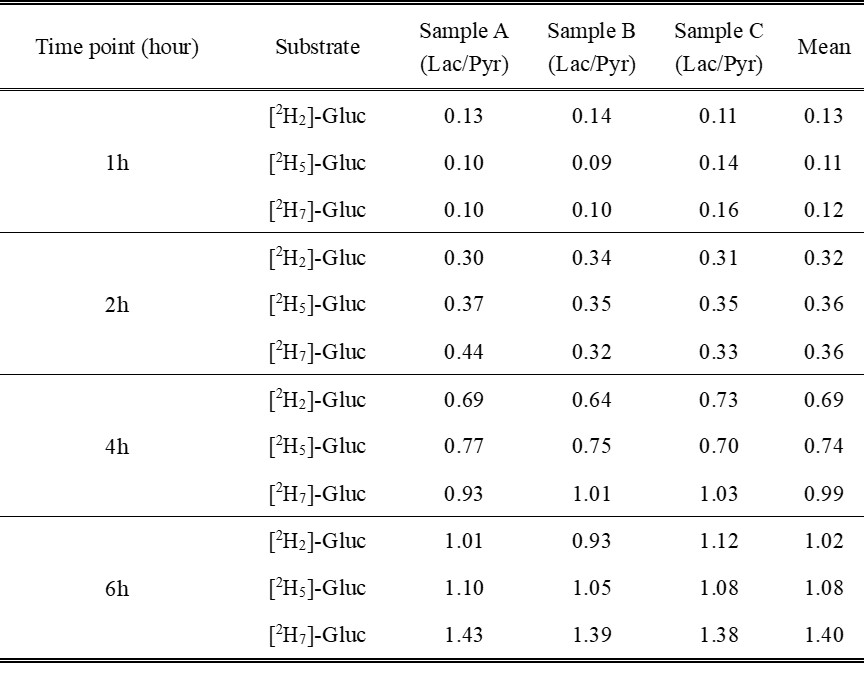
The 2H spectra acquired at multiple time points in C6 cells are shown in Figure 1. All three 2H substrates showed significant lactate production, reflecting the Warburg effect in tumor cells. Figure 2 shows the 2H spectra of the different substrates at 6 h. HDO production was higher in [2H5] glucose and [2H7] glucose compared to [2H2] glucose, as more deuterons at the C2-C5 positions were totally lost during glycolysis to the water pool. Figure 3 compares the lactate production of the different substrates at all time points. The lactate production of [2H2]glucose and [2H5]glucose was almost the same, while [2H7]glucose yields the highest lactate level due to the transfer of the deuterons at C1 into the lactate during glycolysis. Table 1 summarizes the lactate production for the three deuterated substrates, normalized using the integral of pyrazine-D4 in the spectrum. At 4 and 6 hours, the average level of lactate from [2H7]glucose was approximately 1.4 times that of [2H2]glucose and [2H5]glucose.Discussion and Conclusion
This study compared three deuterated glucoses in an ex vivo tumor cells experiment. Compared to [2H2]glucose, [2H5]glucose showed similar characteristics in describing the glycolysis metabolism in cell culture with a significant reduction in synthesis cost. Further studies will include comparisons of glucose metabolism in a larger number of cell samples and further investigate the differences in metabolism in vivo. In conclusion, this study showed that [2H5]glucose is a cost-effective alternative to [2H2]glucose and [2H7]glucose for studying glucose metabolism in tumor cells.Acknowledgements
This work is supported by National Key Research and Development Program of China, 2021YFE0204400; The Strategic Priority Research Program of Chinese Academy of Sciences, XDB25000000; National Natural Science Foundation of China, U22A20344; Youth Innovation Promotion Association of CAS No. Y2021098; Key Laboratory Project of Guangdong Province, 2020B1212060051; Shenzhen Municipal Scientific Program, JCYJ20200109110612375; Shenzhen city grant, RCYX20200714114735123.References
[1] De Feyter H M, Behar K L, Corbin Z A, et al. Deuterium metabolic imaging (DMI) for MRI-based 3D mapping of metabolism in vivo [J]. Science Advances, 2018, 4(8).
[2] Riis-Vestergaard M J, Laustsen C, Mariager C O, et al. Glucose metabolism in brown adipose tissue determined by deuterium metabolic imaging in rats [J]. International Journal of Obesity, 2020, 44(6) : 1417-27.
[3] Lu M, Zhu X-H, Zhang Y, et al. Quantitative assessment of brain glucose metabolic rates using in vivo deuterium magnetic resonance spectroscopy [J]. Journal of Cerebral Blood Flow and Metabolism, 2017, 37(11) : 3518-30.
[4] Mahar R, Donabedian P L, Merritt M E. HDO production from H-2(7) glucose Quantitatively Identifies Warburg Metabolism [J]. Scientific Reports, 2020, 10(1).
[5] Chao Zou, Yingheng Ruan, Qian Wan, et al. Deuterium metabolic imaging for glioma in rat model using [2,3,4,6,6’-2H5]glucose; proceedings of the Joint Annual Meeting ISMRM-ESMRMB & ISMRT 31st Annual Meeting, London, England, United Kingdom, F, 2022 [C].
Figures