3872
Direct comparison of deuterium 2H MRSI at 3T vs 7T1University of Cambridge, Cambridge, United Kingdom, 2Radiology, University of Cambridge, Cambridge, United Kingdom
Synopsis
Keywords: Deuterium, Deuterium
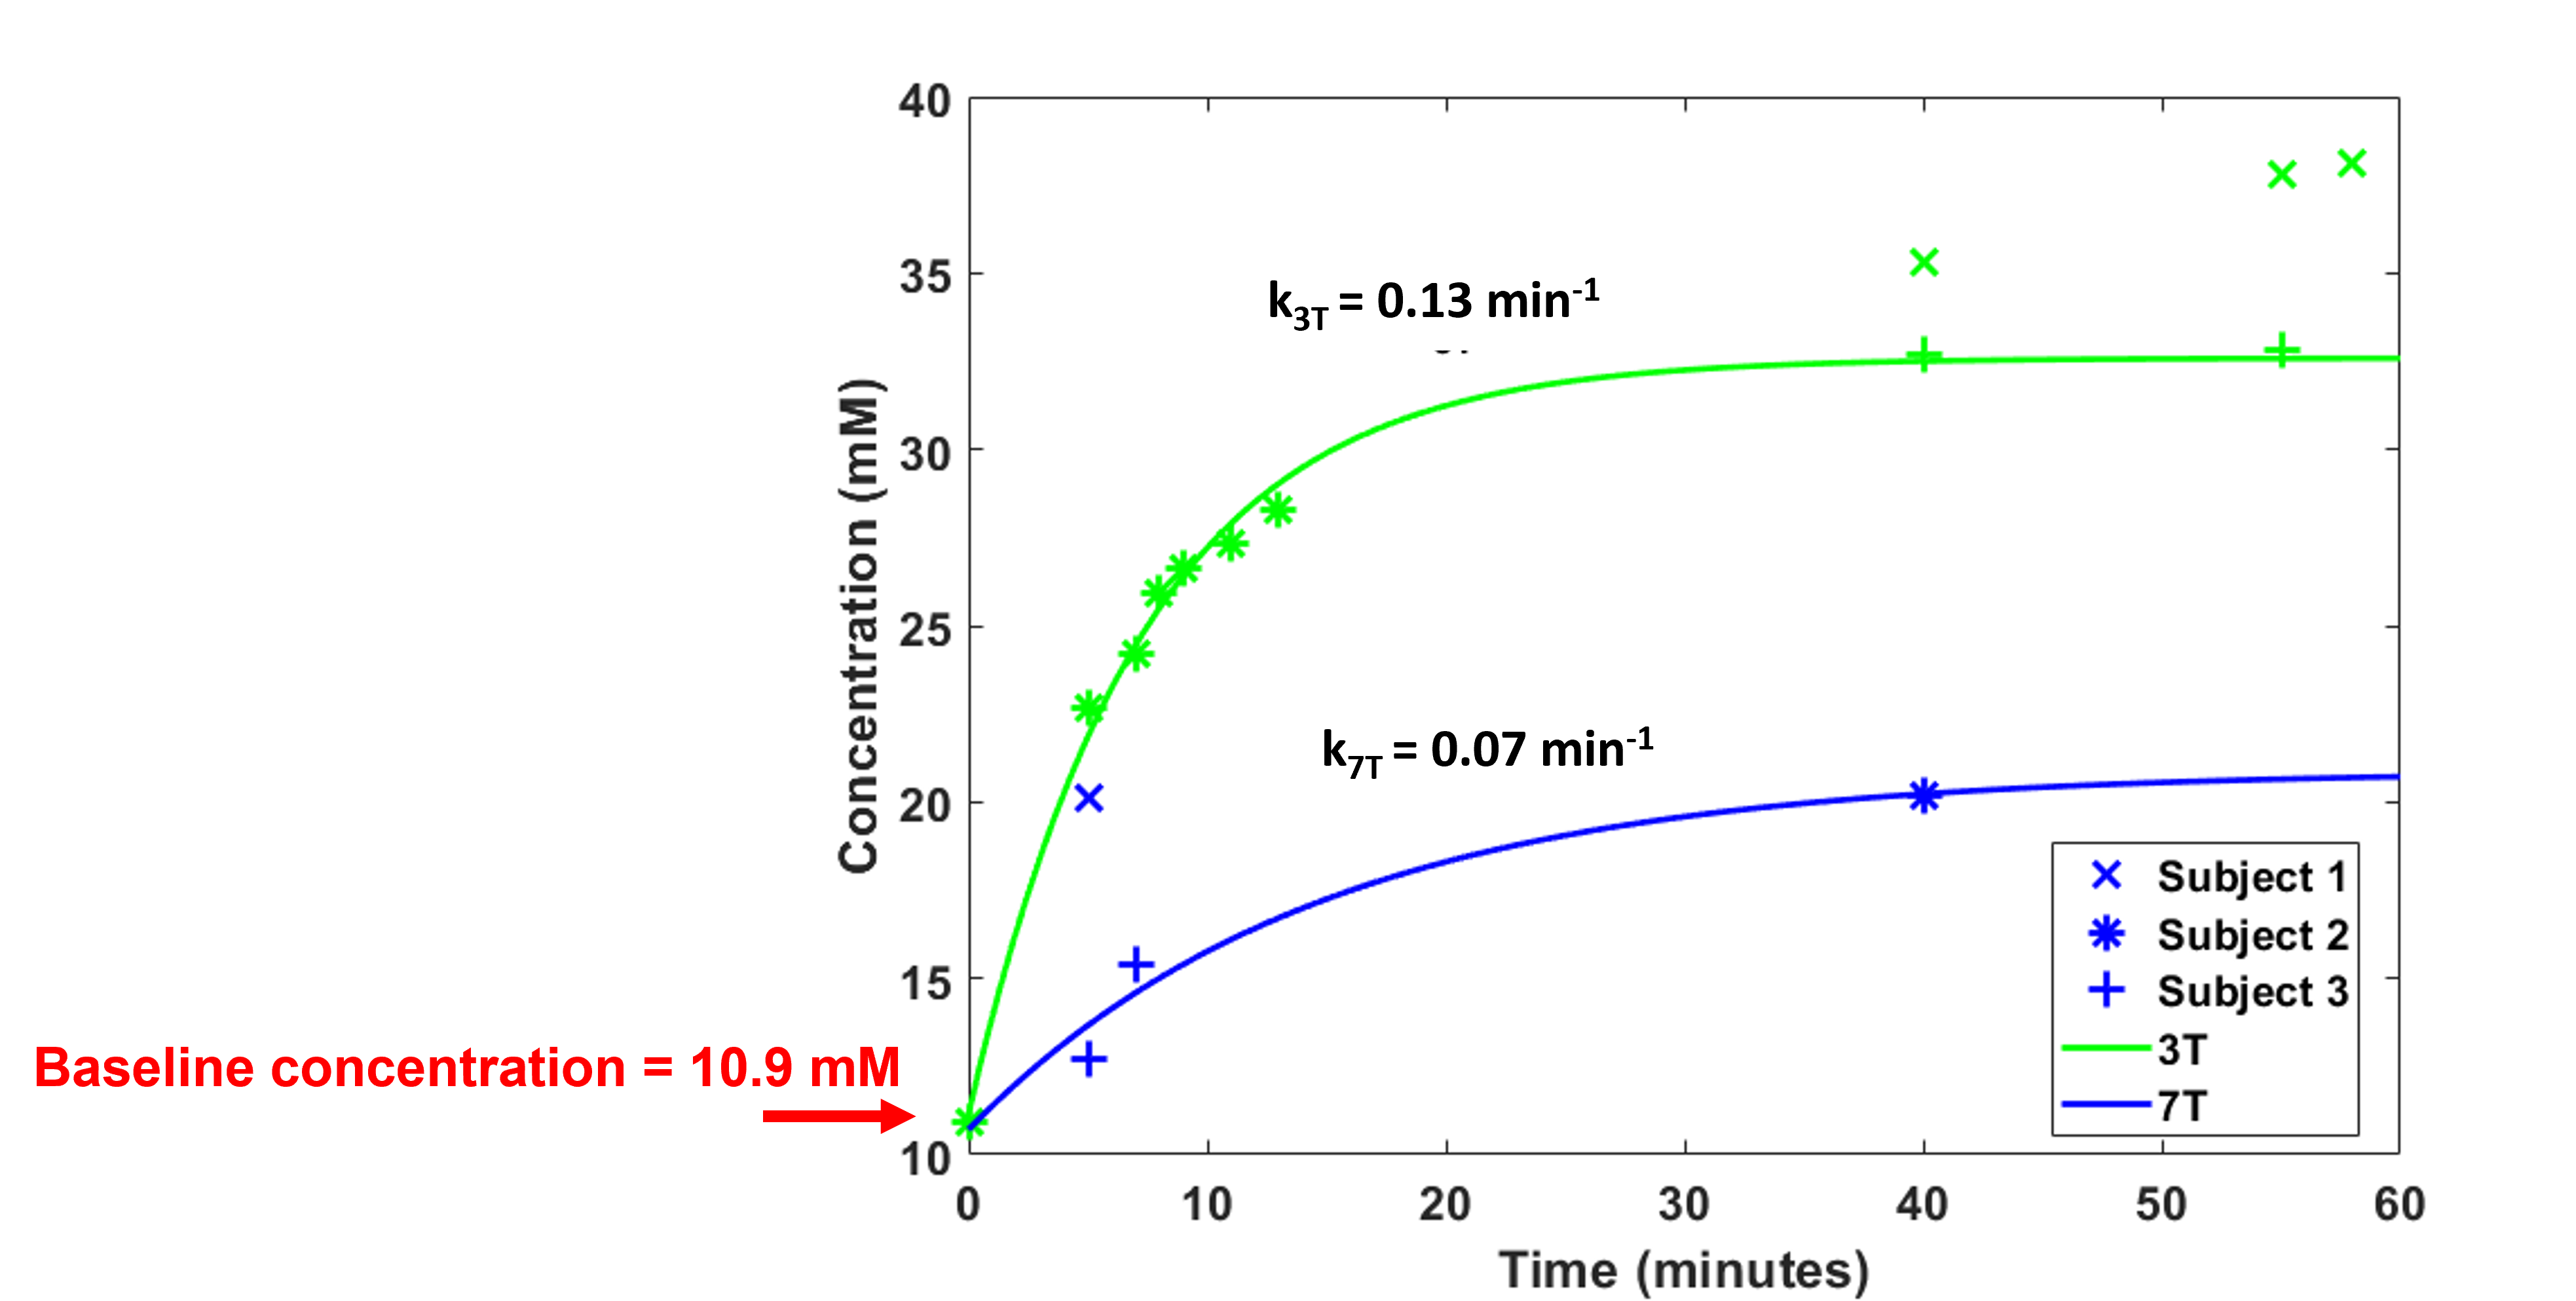
Deuterium metabolic imaging (DMI) is a new method to probe brain metabolism. Theory predicts higher SNR at higher field strength, but clinical translation is easier at lower field strength. We undertook 2H MRSI in 3 healthy volunteers at 3T and 7T sequentially. Acquisition was undertaken at baseline and after 11.1g oral D2O consumption. Data quality was acceptable in all scans. SNR was 3x higher at 7T, in agreement with theory. D2O cerebral uptake rate was similar between field strengths (0.13 min-1 at 3T vs 0.07 min-1 at 7T).Introduction
Deuterium metabolic imaging (DMI) is an emerging method to probe metabolism in vivo. The technique has been investigated at 3T [Kaggie et al, 2022, Niess et. al., 2022], 4T [De Feyter, et. al., 2018], 7T [De Graaf et. al., 2019], and 9.4T [Ruhm et. al., 2021]. MRI physics predicts enhanced signal-to-noise from systems operating at ultra-high field which would motivate using high field strengths to scan. Yet the availability of ultra-high field MRI systems is limited with only around 100 systems globally compared to approximately 30,000 3T MRI systems. It is important to understand in practical terms whether 3T is sufficient for human in vivo DMI. We report results from a direct sequential comparison of 2H MRSI scans run at 3T and 7T in phantoms and healthy volunteers using volume head coils [Peronnet et al. 2012].Methods
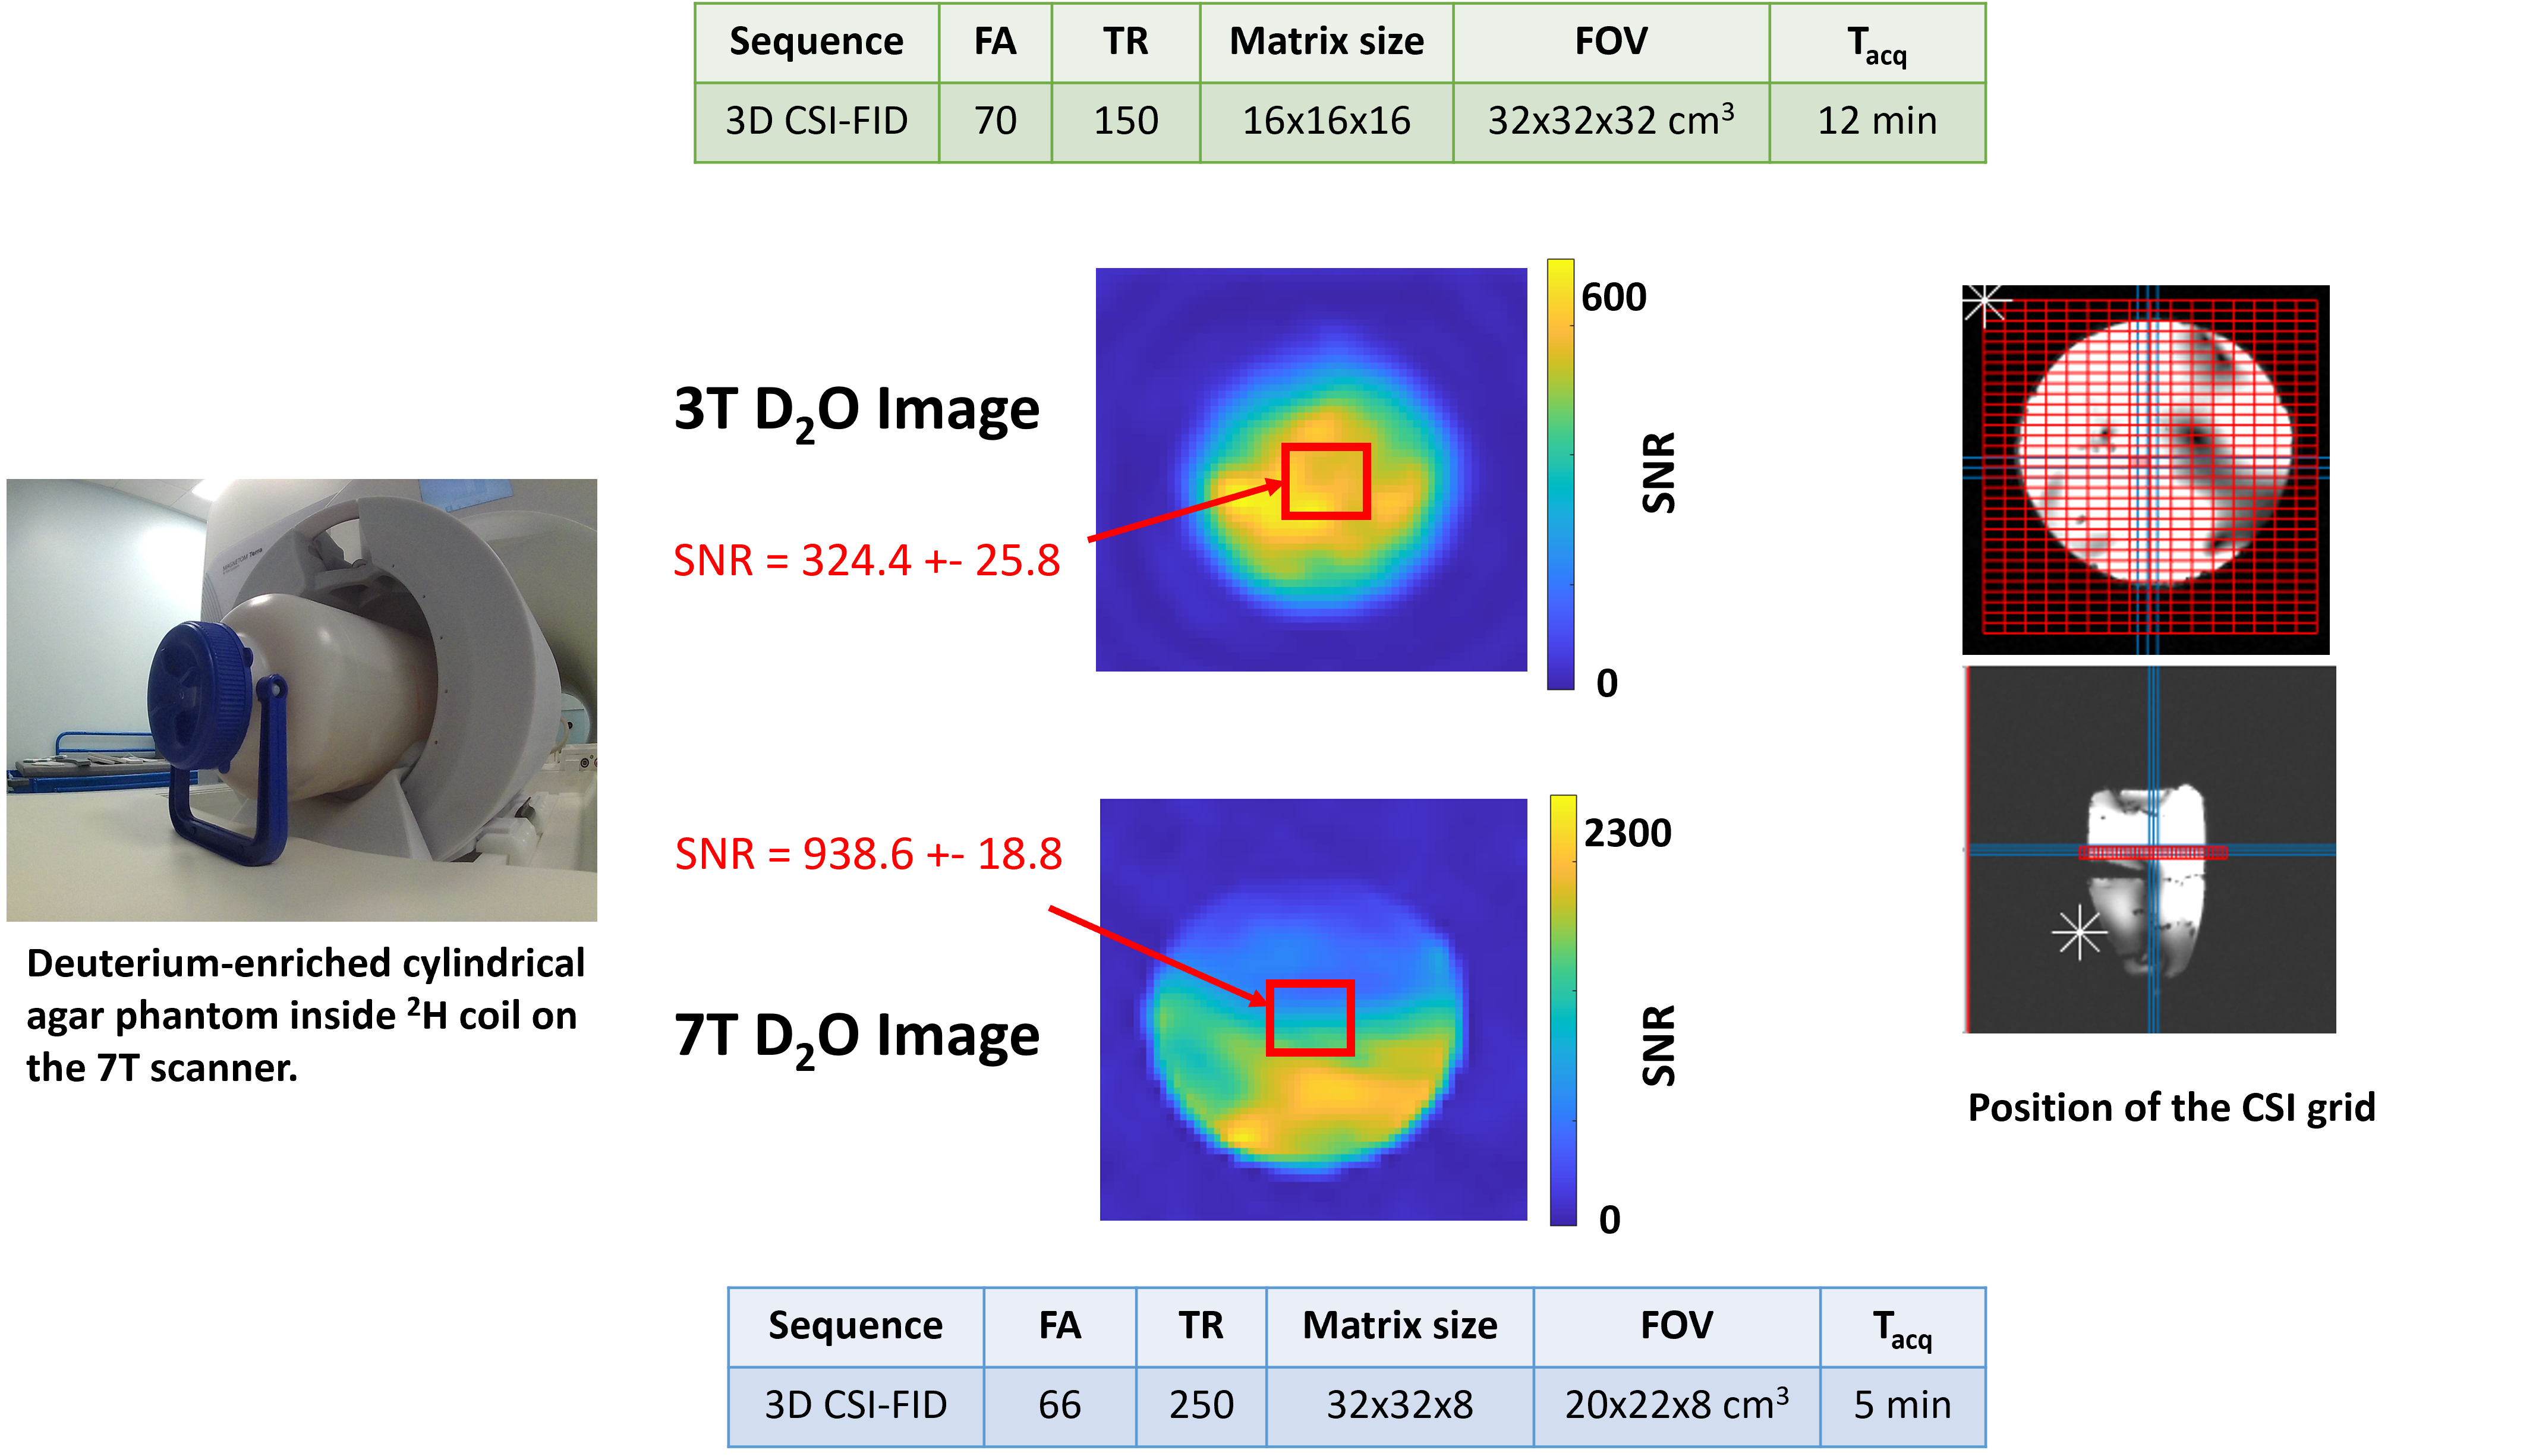
Data were acquired using a 3T Signa MRI (MR750, Ge Healthcare, USA) quadrature volume 2H transmit-receive head coil built locally [Kaggie et al, 2022] and a 7T Terra MRI (Siemens) with a 2H/1H head coil comprising 2x 1H transmit-receive channels, 2x 2H transmit-receive channels forming a TEM resonator and 16x 2H receive loops (Virtumed LLC, MN, USA).Phantom scans were performed on a cylindrical phantom containing agar jelly and water with 2% deuterium enrichment (Figure 2). NaCl was added for a conductivity of 1.0 S/m and Dotarem was added to yield T1 of 1100 ms for 1H at 7 T and 360 ms for 2H.
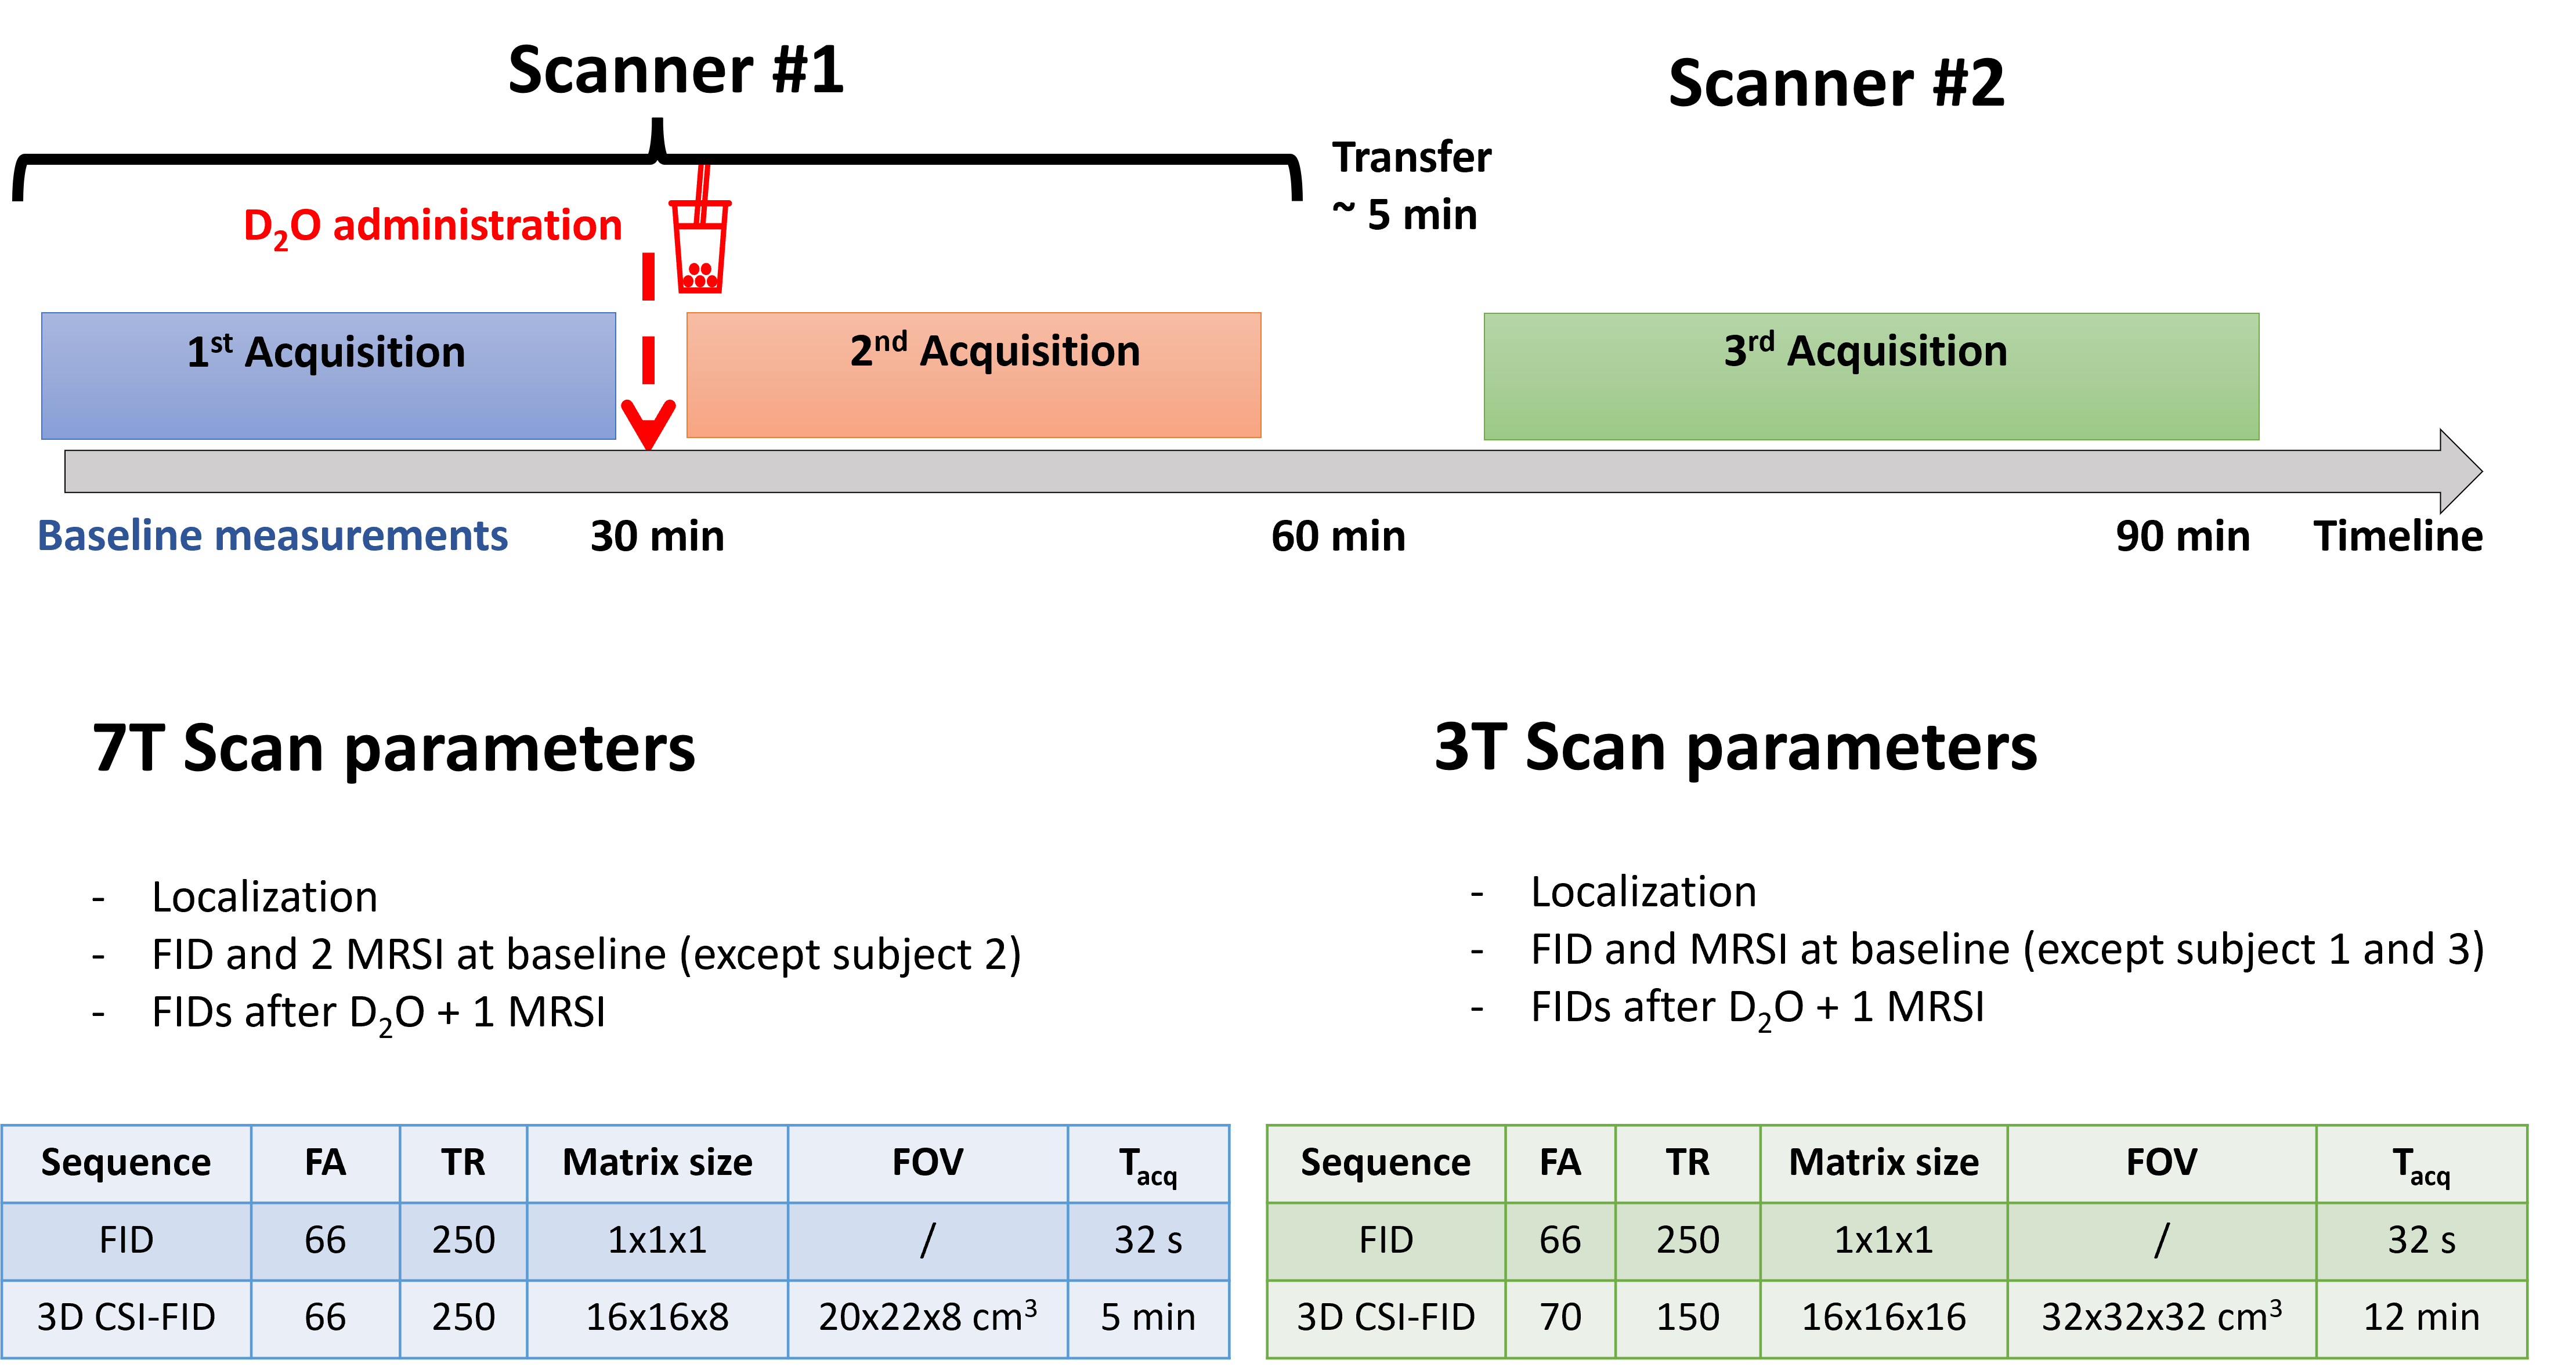
Three healthy volunteers (3 males, age 25-31 years, BMI 21.5-22.8 kg/m2) gave written consent and were scanned using the protocol in Figure 1. Briefly, baseline scans (i.e. without deuterium enrichment) were made at one scanner. Then the subject drank 11.1 g D2O diluted with 240 mL potable water before a second follow up on the same scanner. The subject then walked to the second scanner for their third scan taking ~5 min. The starting field strength was alternated. Measurements at baseline and after the administration of D2O consisted of localizers, B0-maps and non-localized 2H FIDs and localized acquisition weighted 3D CSI (Figure 1).
Data were loaded into Matlab using our OXSA [Purvis. et. al., 2017] toolbox for 7T data and GE data reading scripts provided by Rolf Schulte (General Electric) for 3T data. Raw k-space data were Hamming filtered, zero padded and Fourier transformed to image space. The single-channel 7T results were combined using WSVD. Spectra were fitted with AMARES in OXSA.
Results are compared in terms of the signal-to-noise ratio (defined as the ratio of max signal amplitude by the standard deviation of the noise from a frequency region without any signal), linewidth, and quantitative HDO concentration after calibration to the natural abundance baseline scan .
Results
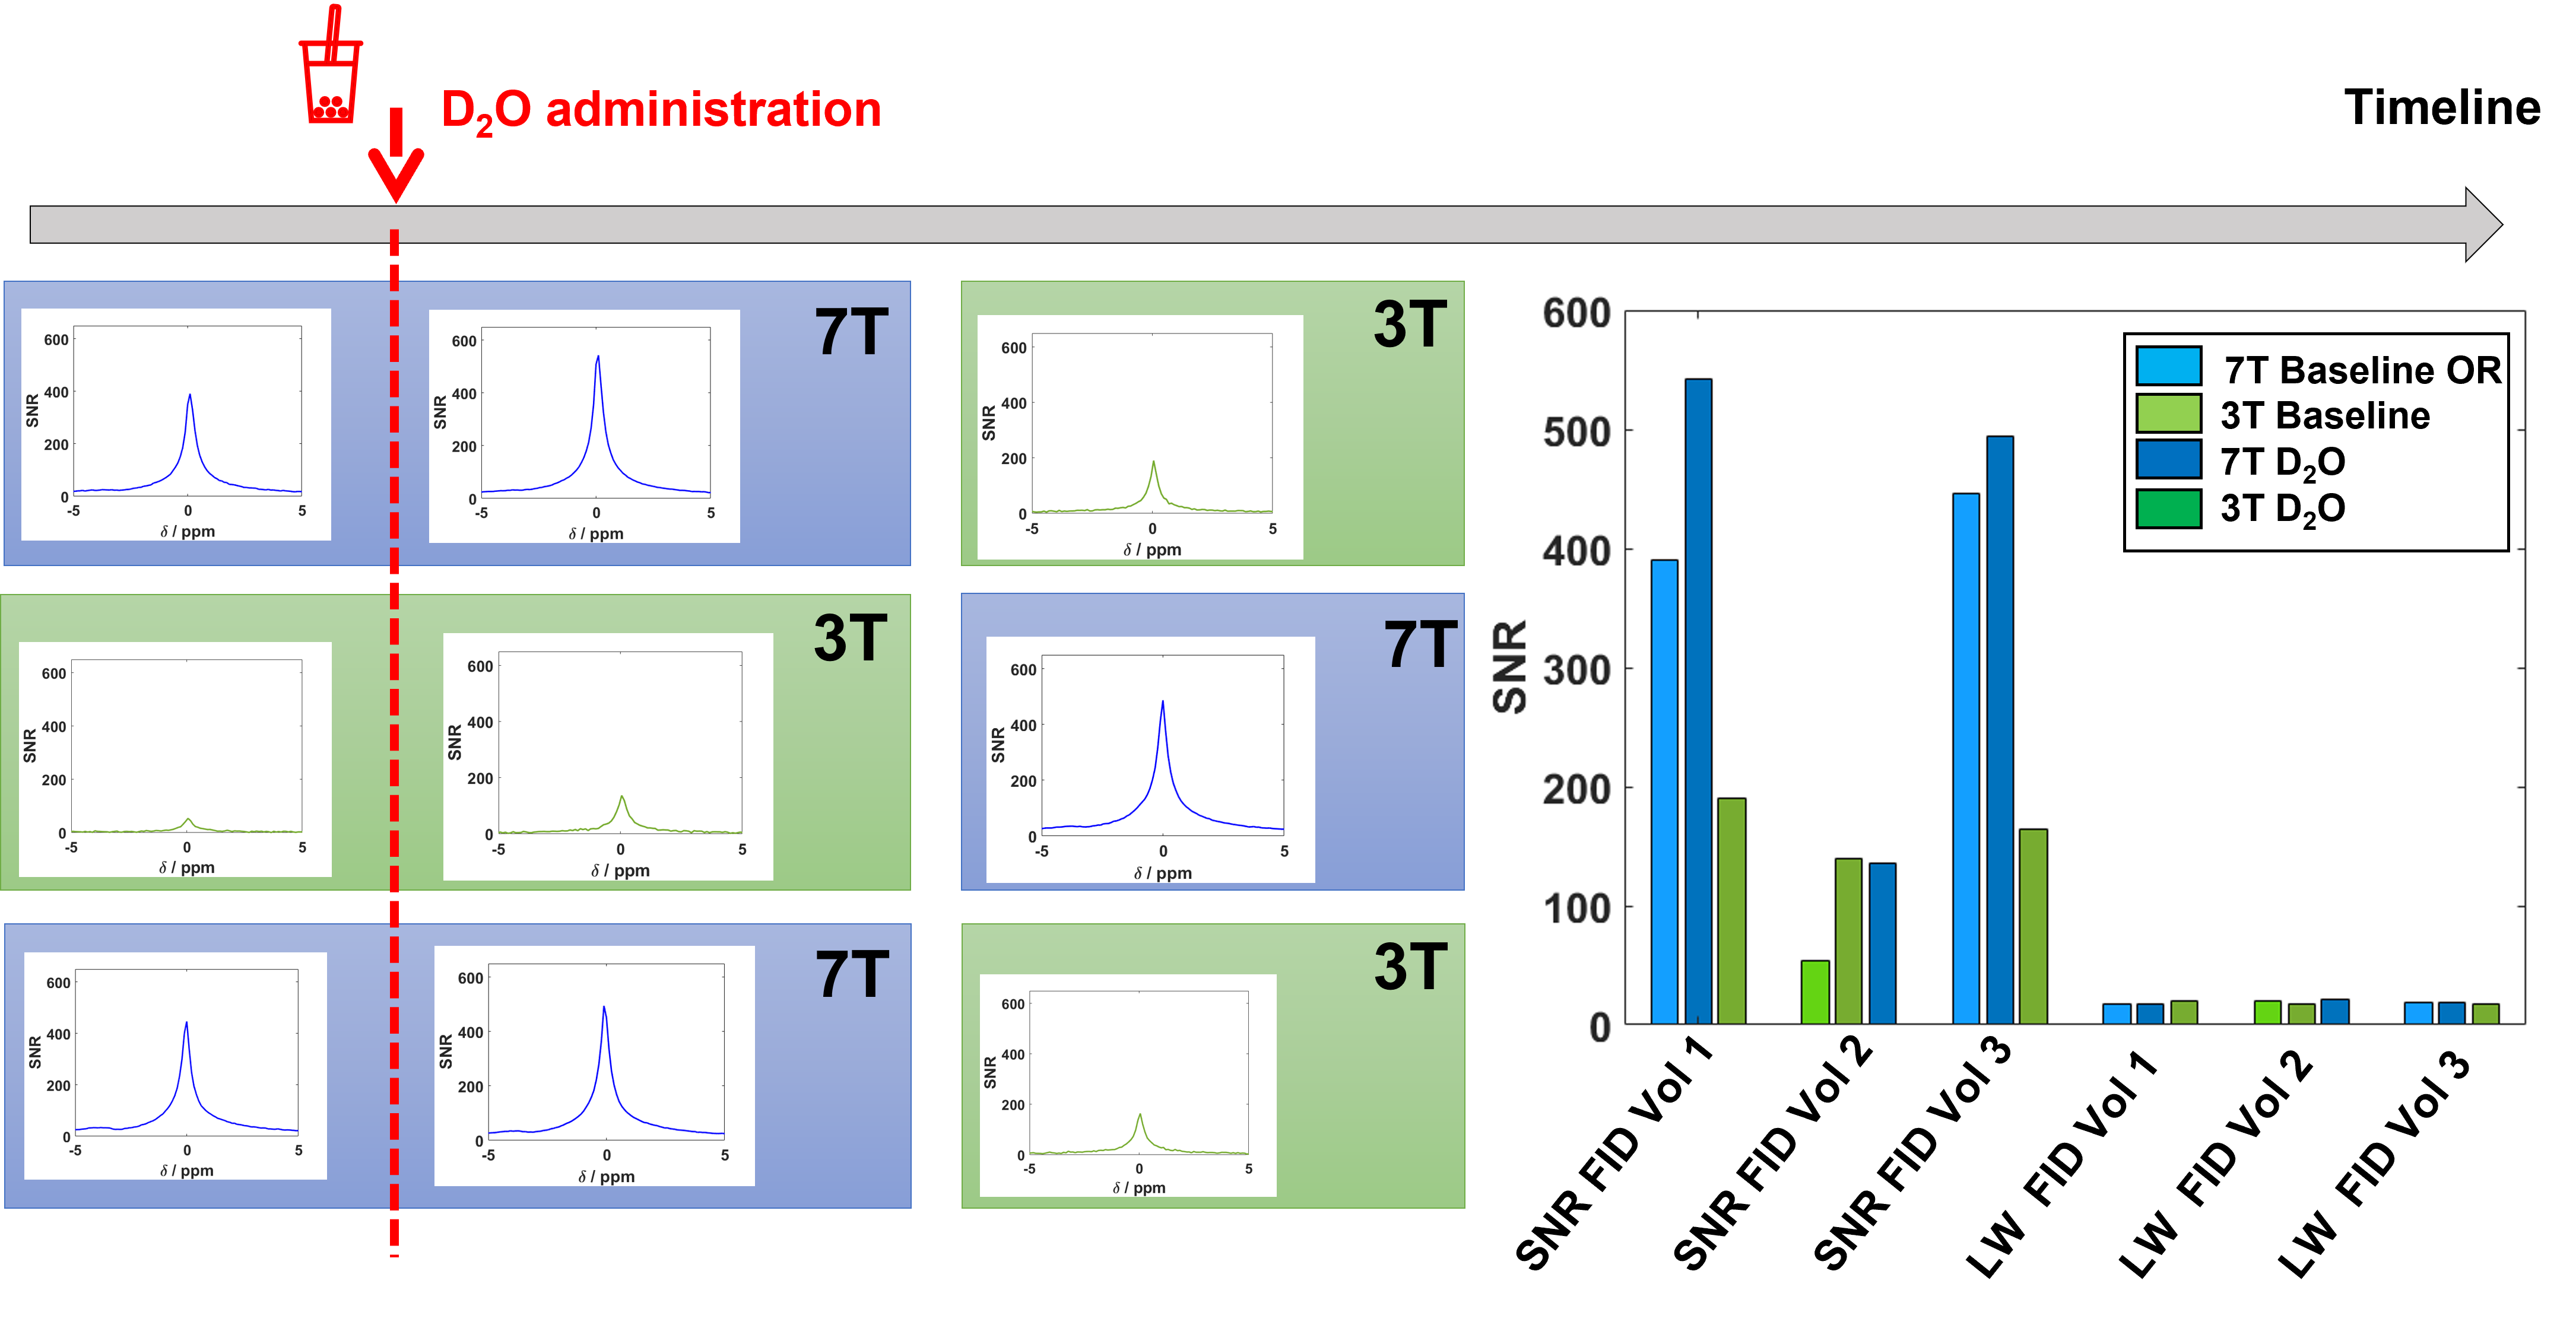
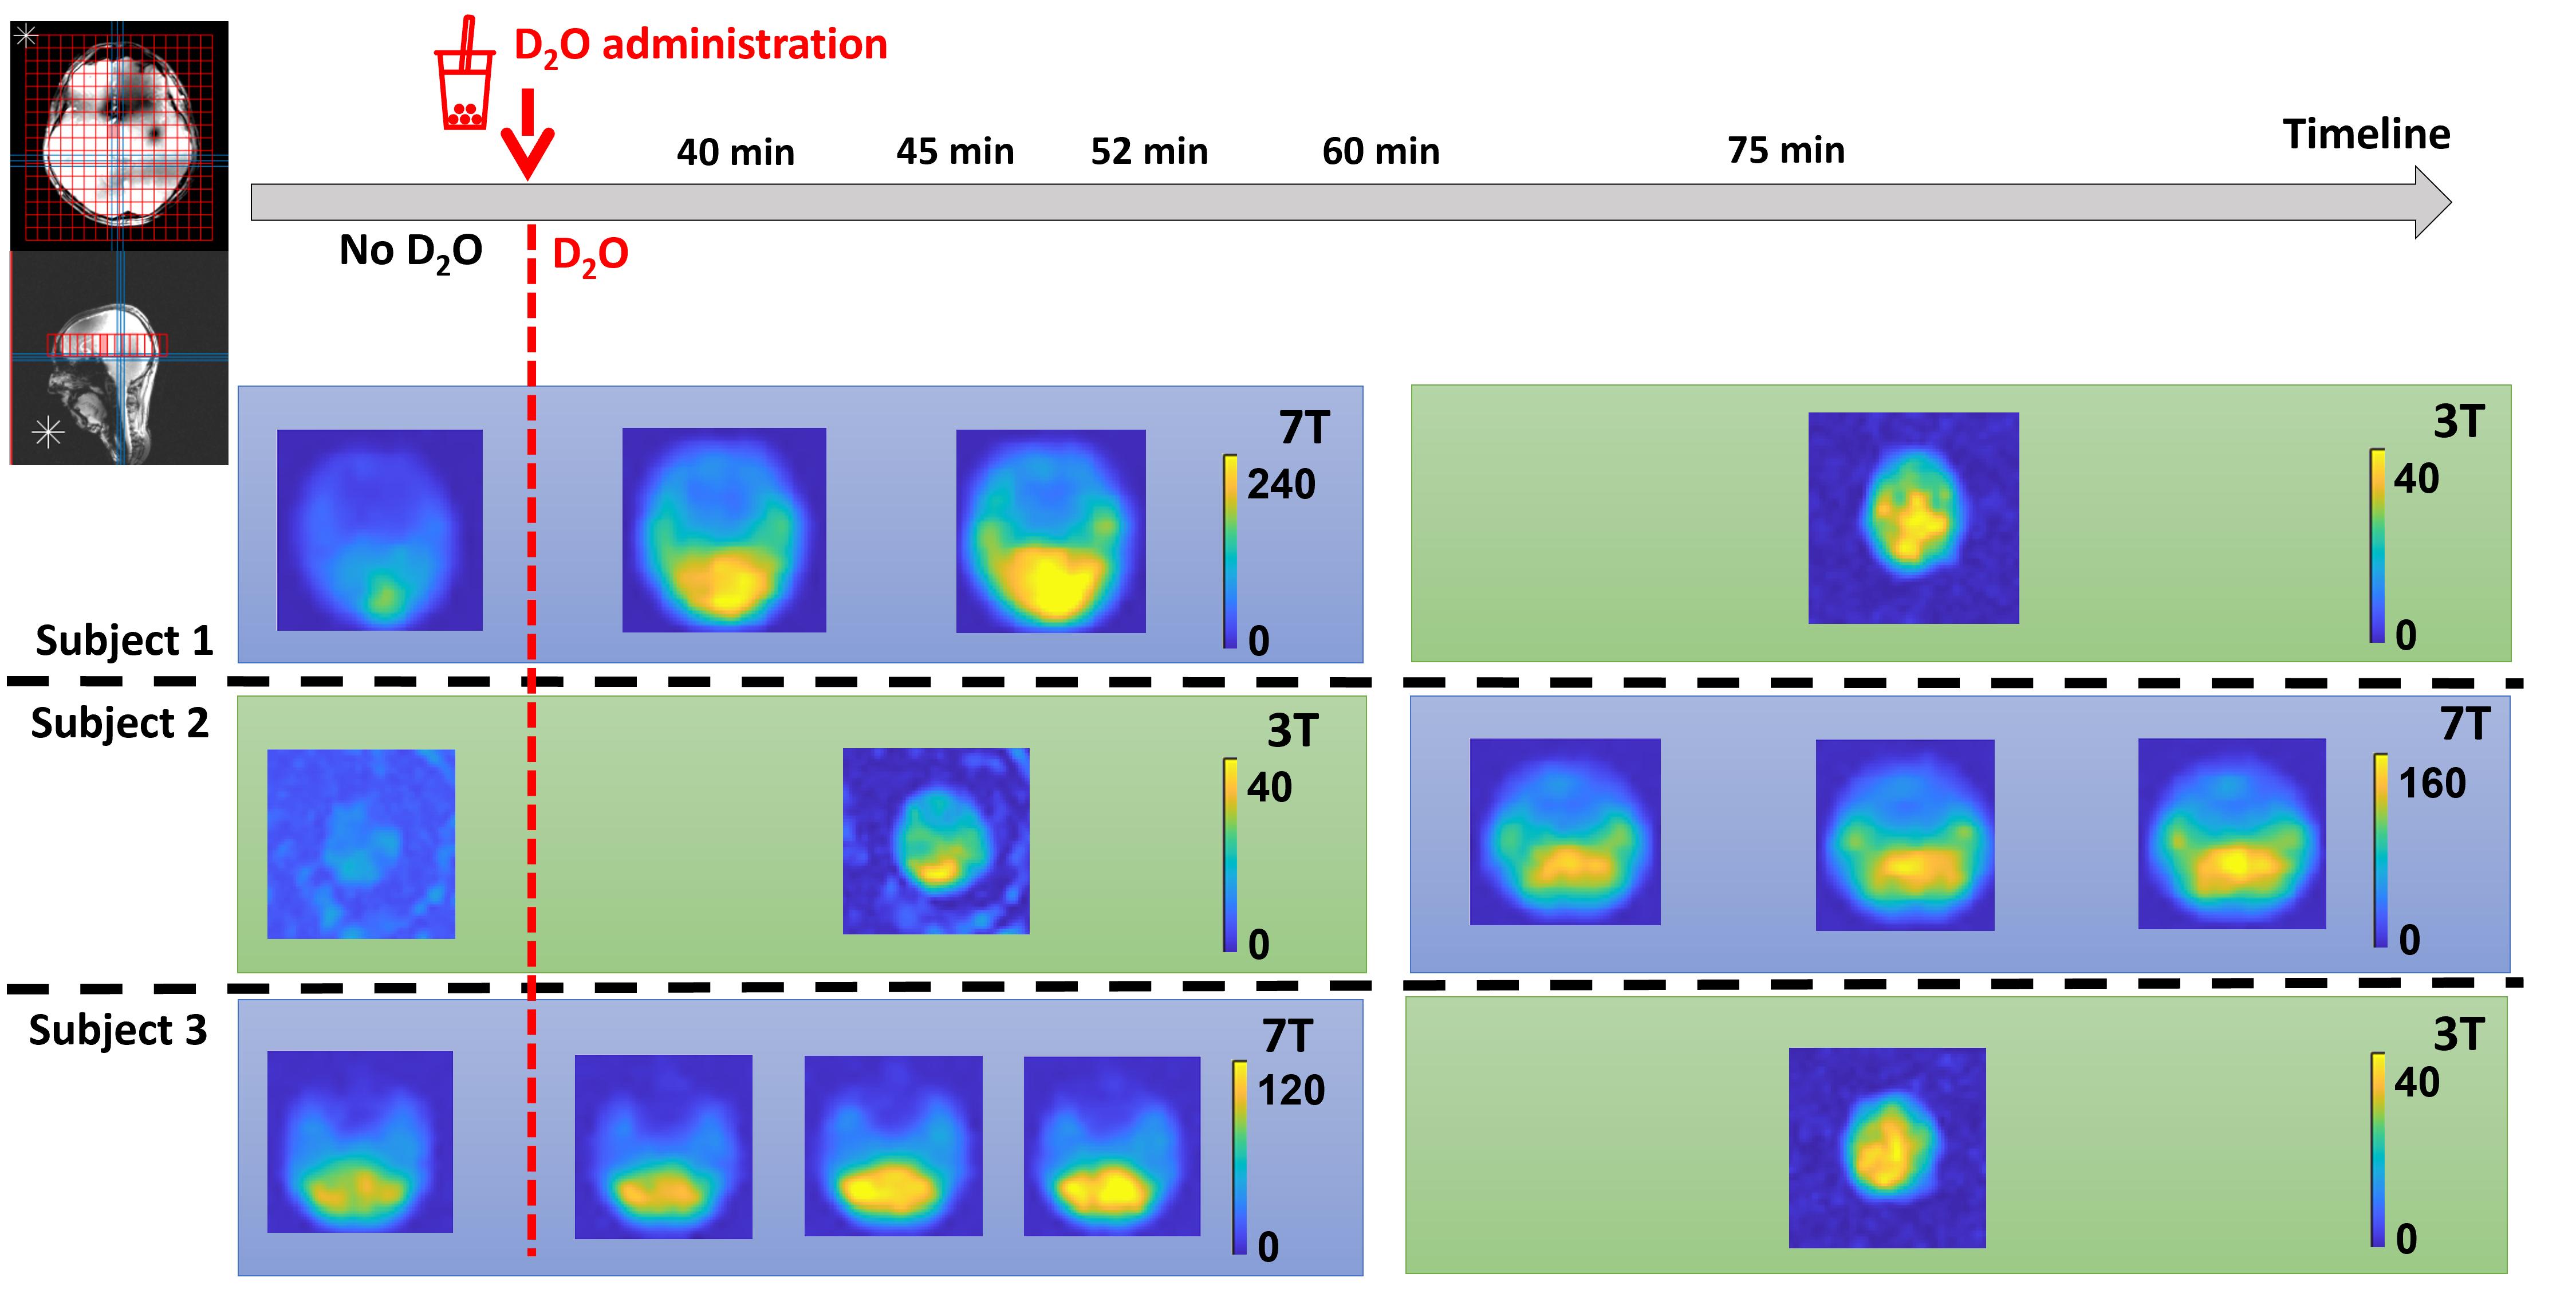
Figure 2 shows the phantom results of the CSI acquisitions performed on the 2 sites. Figure 3 shows the in vivo non localized FID results comparison between before and after D2O administration and between sites. Figure 4 is an illustration of the D2O time course for all 3 volunteers that have participated to this study. Figure 5 shows the D2O concentration time course based on literature values [Kaggie et. al., 2022].Discussion & Conclusion
Both 3T and 7T scanners at our site can detect HDO signals after ingestion of 11.1g D2O. Linewidths in Hz are comparable, meaning that metabolites detected in a scan with 6,6’-[2H2]-glucose will be approximately 2.3x better separated at 7T compared to 3T.The signal uniformity is different between the 2 sites because of the different coil designs. Indeed, at 7T, the head coil has transmitters at the bottom of the coil and the back of the head lies closely on the receivers loops.
The ratio of post/pre signal appears stronger at 3T than at 7T. These figures will aid the comparison of DMI between field strengths.
Acknowledgements
Jabrane Karkouri was supported by the EU Horizon 2020 program under grant agreement #801075 “NICI” and by Innovate UK (10032205) under the Guarantee Scheme relating to the EU Horizon Europe project MITI (101058229). This research was supported by the NIHR Cambridge Biomedical Research Centre (BRC-1215-20014). The views expressed are those of the author(s) and not necessarily those of the NIHR or the Department of Health and Social Care. We acknowledge support from Cancer Research UK, The Cambridge Experimental Cancer Medicine Centre, the CRUK Cambridge Centre, NIHR Cambridge BRC, NIHR Cambridge Clinical Research Facility, Addenbrooke’s Charitable Trust, the Evelyn Trust, and the MS Society. Minghao Zhang is supported by the Medical Research Council (MR N013433-1) and the Cambridge Trust.References
Kaggie JD, Khan AS, Matys T, Schulte RF, Locke MJ, Grimmer A, Frary A, Menih IH, Latimer E, Graves MJ, McLean MA, Gallagher FA. Deuterium metabolic imaging and hyperpolarized 13C-MRI of the normal human brain at clinical field strength reveals differential cerebral metabolism. Neuroimage. 2022
Ruhm L, Avdievich N, Ziegs T, Nagel AM, De Feyter HM, de Graaf RA, Henning A. Deuterium metabolic imaging in the human brain at 9.4 Tesla with high spatial and temporal resolution. Neuroimage. 2021 Dec
de Graaf, RA, Hendriks, AD, Klomp, DWJ, et al. On the magnetic field dependence of deuterium metabolic imaging. NMR in Biomedicine. 2020;
Serés Roig E, De Feyter HM, Nixon TW, Ruhm L, Nikulin AV, Scheffler K, Avdievich NI, Henning A, de Graaf RA. Deuterium metabolic imaging of the human brain in vivo at 7 T. Magn Reson Med. 2023
Philip Adamson et. al., Deuterium Metabolic Imaging for 3D Mapping of Human Brain Metabolism at 3T, ISMRM 2022
Fabien Niess et. al., Non-invasive three-dimensional 1H-MR Spectroscopic Imaging of human brain glucose and neurotransmitter metabolism using deuterium labeling at 3T, medRXiv, 2022.
Henk de Feyter et. al., Deuterium metabolic imaging (DMI) for MRI-based 3D mapping of metabolism in vivo, Science advances, 2018. D. Bennett, “NaCl doping and the conductivity of agar phantoms,” Materials Science and Engineering: C, vol. 31, no. 2, pp. 494–498,2011.
Purvis LAB, Clarke WT, Biasiolli L, Valkovič L, Robson MD, Rodgers CT. OXSA: An open-source magnetic resonance spectroscopy analysis toolbox in MATLAB. PLoS One. 2017 Sep 22;12(9):e0185356. doi: 10.1371/journal.pone.0185356. PMID: 28938003; PMCID: PMC5609763.
Figures