3871
Time-resolved deuterium metabolic imaging of the human brain at 7T1Wolfson Brain Imaging Centre, University of Cambridge, Cambridge, United Kingdom
Synopsis
Keywords: Deuterium, Deuterium
Deuterium metabolic imaging (DMI) is a new way to track brain metabolism. We present initial results from 3 volunteers scanned with a new 18-element 2H + 2-element 1H array coil on a Siemens 7T Terra scanner. We utilised our array’s high SNR to track metabolism by whole-brain 3D DMI after drinking 6,6’-[2H2]-glucose (Glc). Signals from HDO, Glc, Glx and Lac were visible over 2hrs at 5min temporal and 6.9mL spatial resolution. We also ran 2.9mL 3D DMI. We achieved HDO SNR of 43 in 13min, which compares favourably published SNR=13 in 10min at 9.4T1 and ~50 in 28min at 7T.2
Introduction
Deuterium metabolic imaging (DMI) is an emerging method to probe metabolism in vivo. In brief, subjects drink 0.75g/kg body weight of 6,6’-[2H2]-glucose (“Glc”). This is a stable isotope tracer, that is not radioactive. MR scans at the deuterium (2H) frequency (45.6MHz at 7T) then non-invasively track the Glc uptake and downstream metabolism into semi-labelled water (HDO), glutamine/glutamate (Glx) and lactate (Lac).1 HDO signal at baseline gives an intrinsic concentration reference for quantitative analysis. DMI can detect the partitioning of glucose between glycolysis (which elevates Lac/Glc ratio) and aerobic TCA cycle respiration (which elevates Glx/Glc ratio).DMI has significant potential clinically as a radiation-free complement to 18FDG-PET and for research into human brain (patho)physiology. To realise this potential, we need to improve the temporal and spatial resolution of DMI, which can be done using ultra-high field MRI1,2 and optimised RF coils.3
This study investigates the temporal and spatial resolution achievable for 3D DMI at 7T using an 18-element 2H array coil.
Methods
AcquisitionsData was acquired with a 7T Terra MRI (Siemens) and a 2H/1H dual tuned head coil (Virtumed LLC) comprising a TEM 2H transmit structure driven in quadrature and 16 receive loops and two pairs of 1H transmit-receive loops. Initial tests were run with a cylindrical agar phantom enriched to 2% HDO (singly-labelled water).
In vivo coil B1+ efficiency
FDTD simulations of the 1H and 2H transmit structures were performed as previously described.3 The B1+/VRMS calibration was measured in vivo with a non-localized FID sequence, with 4ms hard pulse excitation with voltages varying between 25V and 200V (N=4).
DMI protocol
Three healthy volunteers were scanned with oral 6,6’-[2H2]-glucose (Glc) tracer as follows.
Baseline: Subjects were asked to fast for 4 hours prior to scanning. They were scanned at baseline before Glc to capture the natural abundance HDO signal as an internal concentration reference. This scan comprised localizers, B0 shimming in “Brain” mode, GRE structural imaging and a 6.9mL resolution DMI scan (3D CSI, 16x16x8 matrix, 220x200x320mm3 field of view, acquisition weighting with 6 averages at k=0, 250ms TR, 1ms hard pulse at Ernst angle (66°), 5kHz readout bandwidth in a total of 4m59s).
Glucose: The bed was moved out of the scanner bore and subjects sat up to drink 0.75g/kg body weight (maximum 60g) 6,6’-[2H2]-glucose dissolved in approx. 200mL sterile “water for injection”.
6.9mL resolution DMI time-series: Subjects were immediately repositioned. B0 shimming and structural imaging was repeated. Two 6.9mL resolution DMI scans were run back-to-back to track any rapid deuterium uptake, then 6 further 6.9mL resolution DMI scans were started at 20 min intervals. The rest periods were a precaution requested by our coil safety committee during these initial human scans with this coil.
T1 measurement: In one rest period, we inserted a set of non-localized inversion recovery FIDs to measure T1. These had 1500ms TR and six TIs between 50ms and 1000ms.
2.9mL resolution DMI: In the final rest period, we inserted a “high resolution” 2.9mL resolution 3D DMI scan (parameters as above except with a 20x20x12 matrix in a total of 13m40s).
Analysis
Spectra were analysed in the OXSA Toolbox.4 WSVD-combined spectra were denoised with PCA patch denoising5 and then fitted with AMARES to a model with 4 Lorentzian peaks, one for each of HDO, Glc, Glx and Lac. No further spatial filtering is applied. A brain mask was defined as all voxels with HDO>25 at the final timepoint, eroded by 1 voxel to suppress scalp fat signals. This was used for all summary statistics.
Results and discussion
Localizer images show good qualitative agreement with proton B1+ simulations (Figure 1). The 2H FID B1+ calibration shows that mean B1+ = 0.13 µT/sqrt(W), consistent across subjects. This is lower than simulations, which is expected because we neglected losses in the simulations.Figure 2 shows sample spectra for the 6.9mL and 2.9mL resolution protocols. Mean SNR for HDO was 54 at 6.9mL and 43 at 2.9mL. The mean HDO linewidth was 16 Hz.
Figure 3 plots the time course for all metabolites and key ratios in subject 1. Figure 4 shows the corresponding mean values for voxels in the brain. Across all subjects the average change from t=0 to t=120min is +22% HDO, +1430% Glc, +3144% Glx, -40% Lac, +974% Glc/HDO and +2523% Glx/HDO. The “Lac” signal is strong in the skull, consistent with its attribution to scalp lipids by Ruhm et al.1
Figure 5 shows high resolution metabolite maps recorded at 2.9mL resolution in 13m40s.
A limitation of this study is that our coil safety committee required us to limit scan durations for initial human scans as a precaution. Future studies will not need these rest periods, allowing additional time points to better characterise the metabolic fluxes, or 2x more signal averaging for a sqrt(2)x SNR boost.
Conclusion
We have obtained excellent quality DMI data in volunteers through the combination of ultra-high field (7T), a high channel count array coil with TEM volume transmit/receive and PCA patch denoising. We are now ready to probe changes in brain metabolism in cancer and neurodegenerative disease.Acknowledgements
We thank our colleagues in the Department of Radiology and Cambridge University Hospitals NHS Trust Pharmacy for assistance storing the 6,6’-[2H2]-glucose used here.
This work was supported by the EU Horizon 2020 program under grant agreement #801075 “NICI” and by Innovate UK (10032205) under the Guarantee Scheme relating to the EU Horizon Europe project “MITI” #101058229. This research was supported by the NIHR Cambridge Biomedical Research Centre (BRC-1215-20014). The views expressed are those of the author(s) and not necessarily those of the NIHR or the Department of Health and Social Care. MZ is supported by the Medical Research Council (MR N013433-1) and the Cambridge Trust.
References
Ruhm L, Avdievich N, Ziegs T, Nagel AM, De Feyter HM, de Graaf RA, Henning A. Deuterium metabolic imaging in the human brain at 9.4 Tesla with high spatial and temporal resolution. Neuroimage. 2021 Dec 1;244:118639.Figures
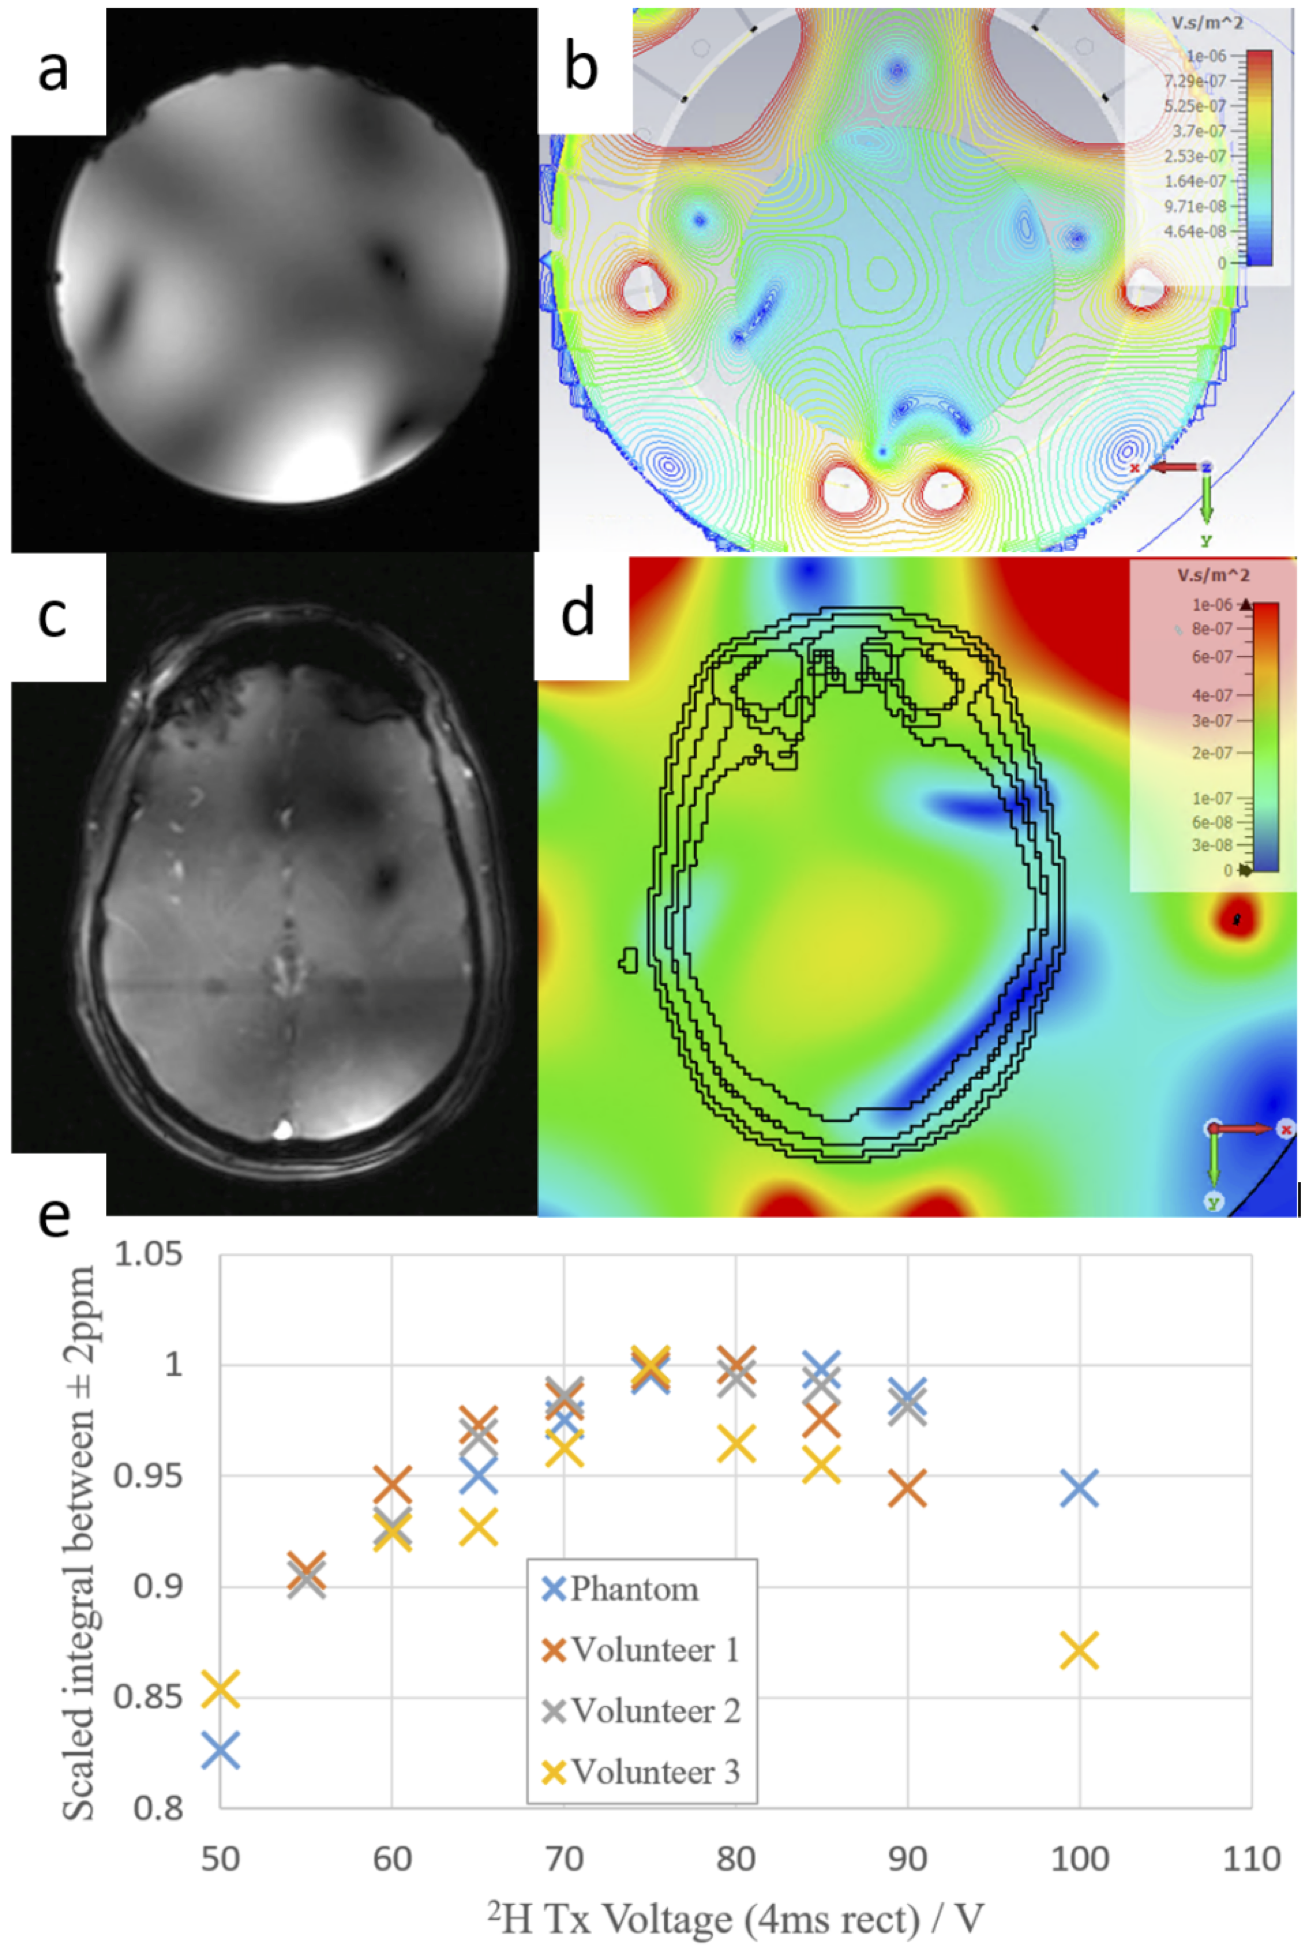
Figure 1: (a) Localizer proton image of an agar phantom. (b) Simulated B1+ of the updated 1H structure on a cylindrical phantom (conductivity 1.0 S/m). (c) Localizer proton image in vivo. (d) Simulated B1+ of the updated 1H structure on Gustav human voxel model. (e) Normalized peak integral for 2H non-localized FID voltage sweep in phantom and 3 healthy volunteers. Peak signal is achieved with voltage between 75V and 80V for all volunteers, which converts to 0.13 µT/sqrt(W) B1+ strength.
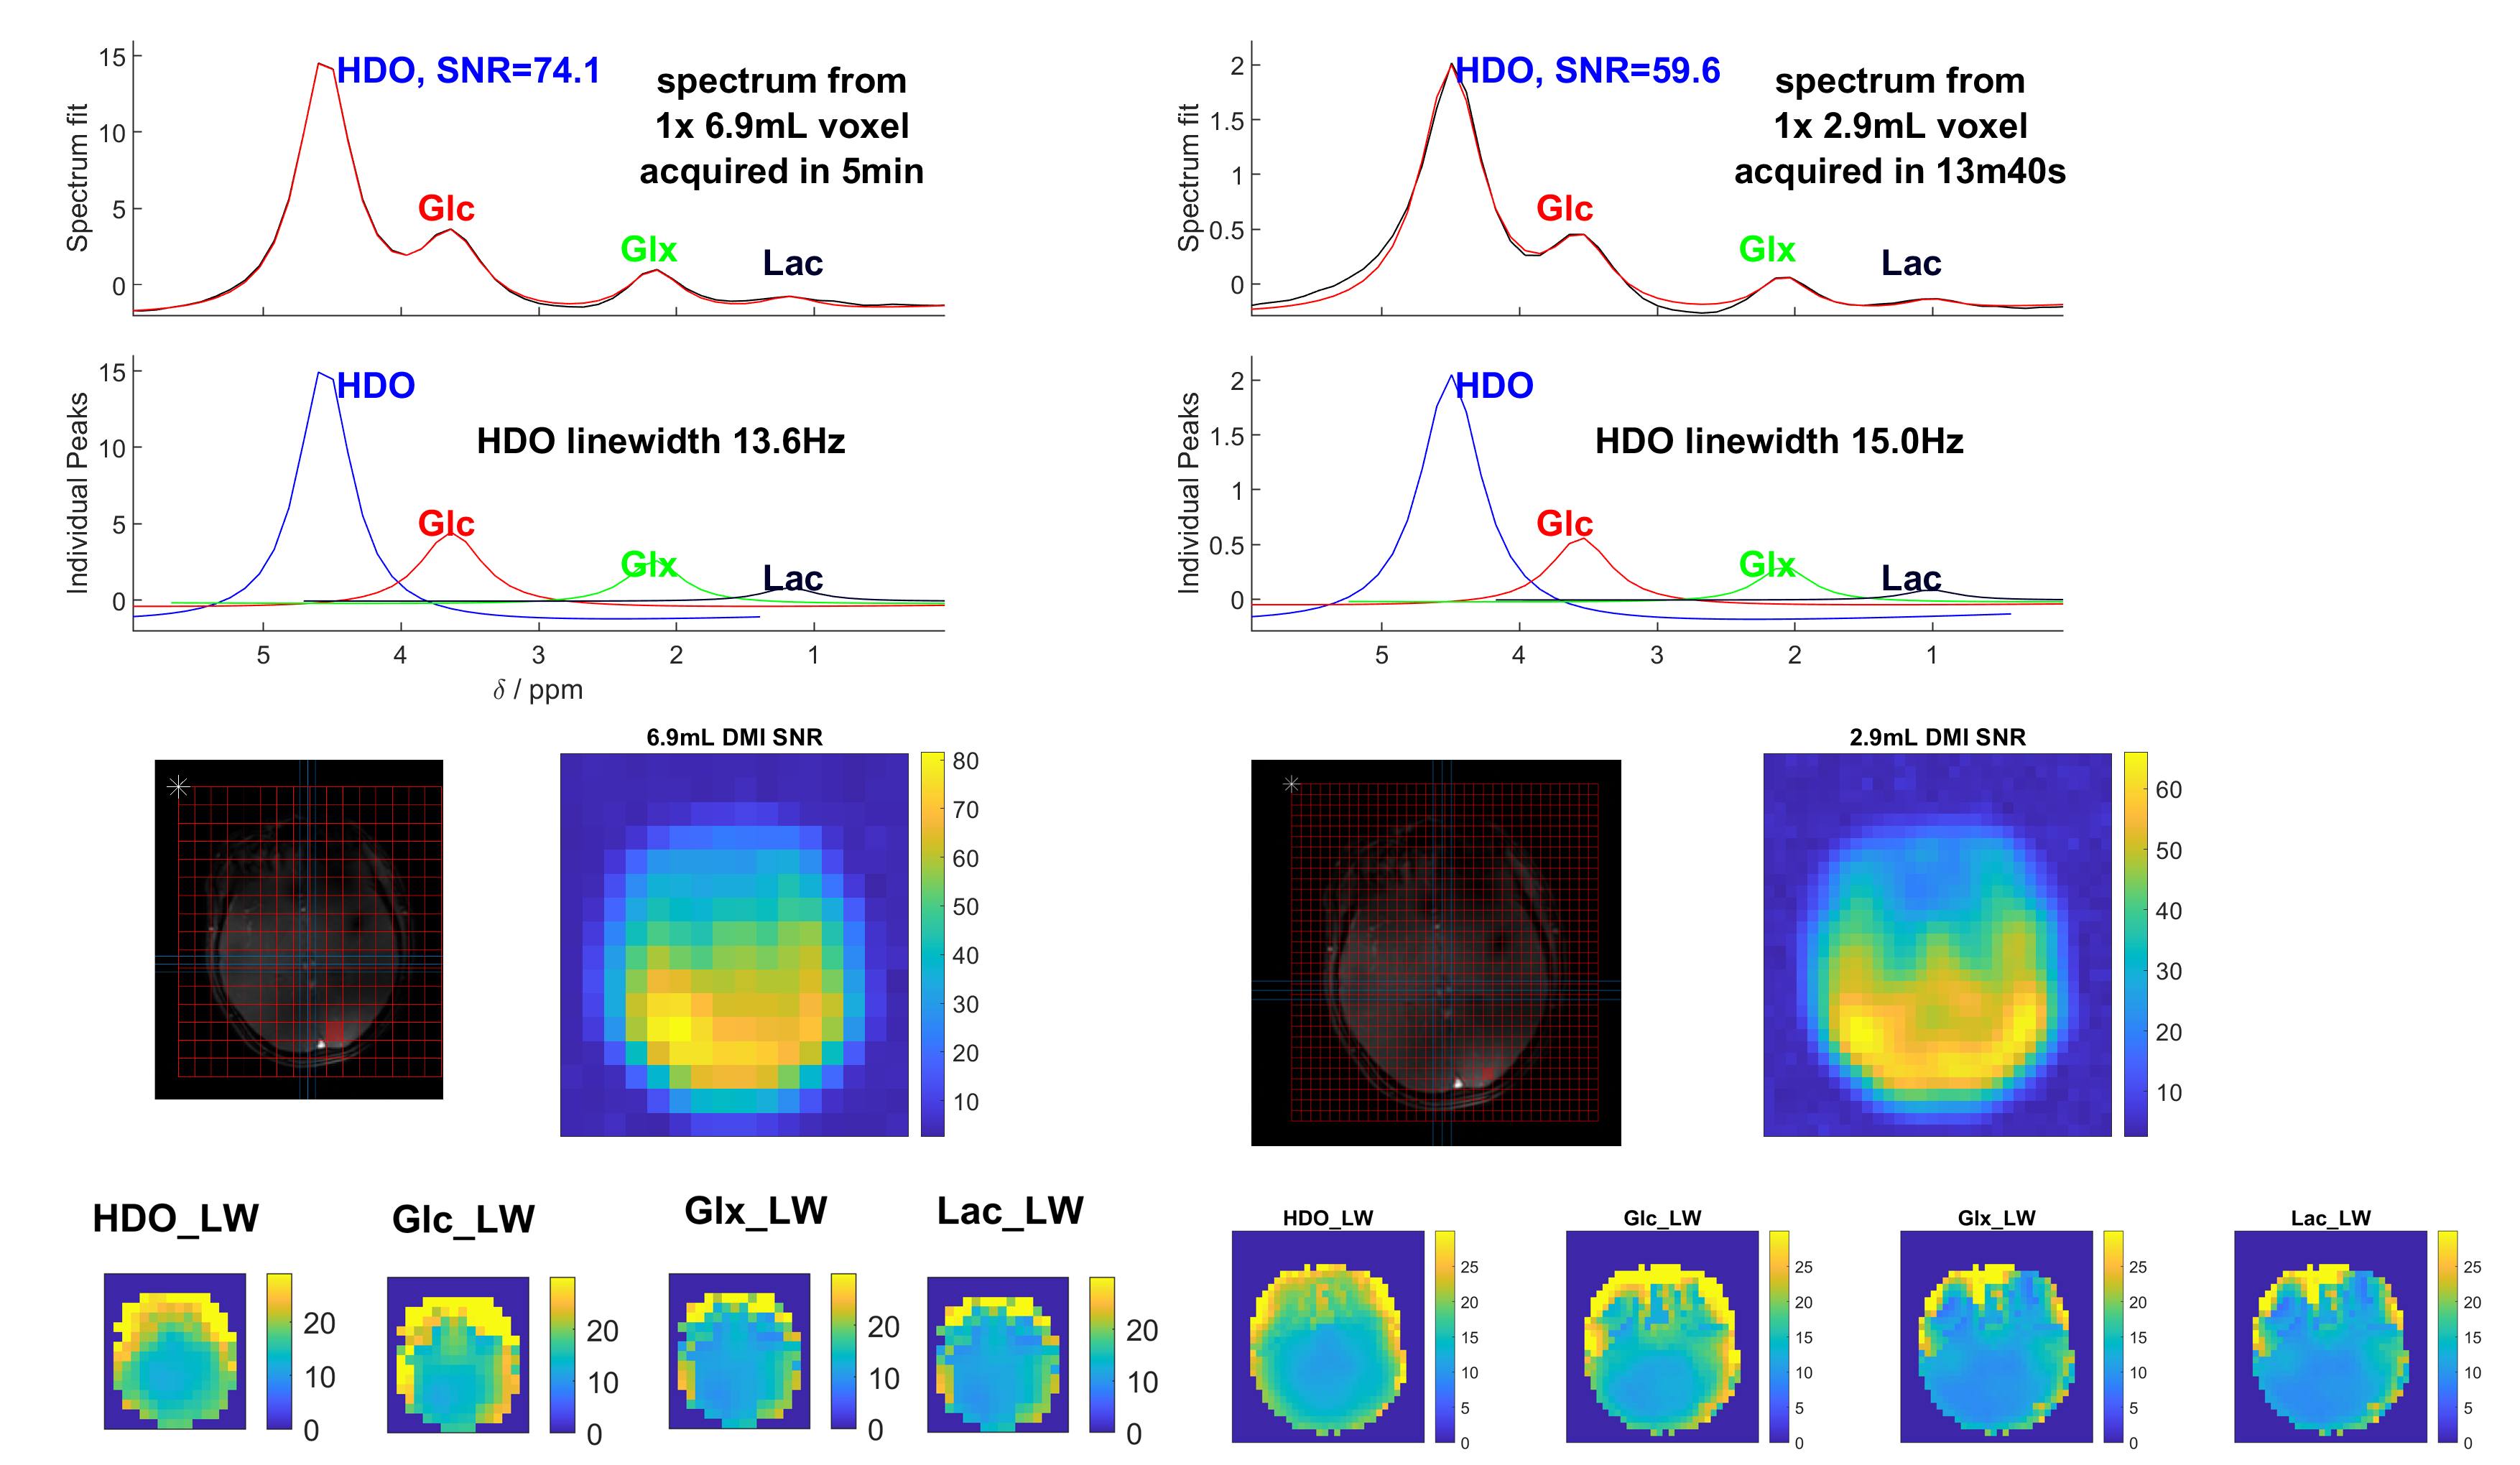
Figure 2: Example spectrum, linewidths and whole brain DMI SNR. (Left) Taken from 1x CSI voxel with nominal volume 6.9mL as part of the 3D CSI acquired in 5min from Subject 1. (Right) From 1x CSI voxel with nominal volume 2.9mL as part of the 3D CSI acquired in 13m40s from Subject 1.
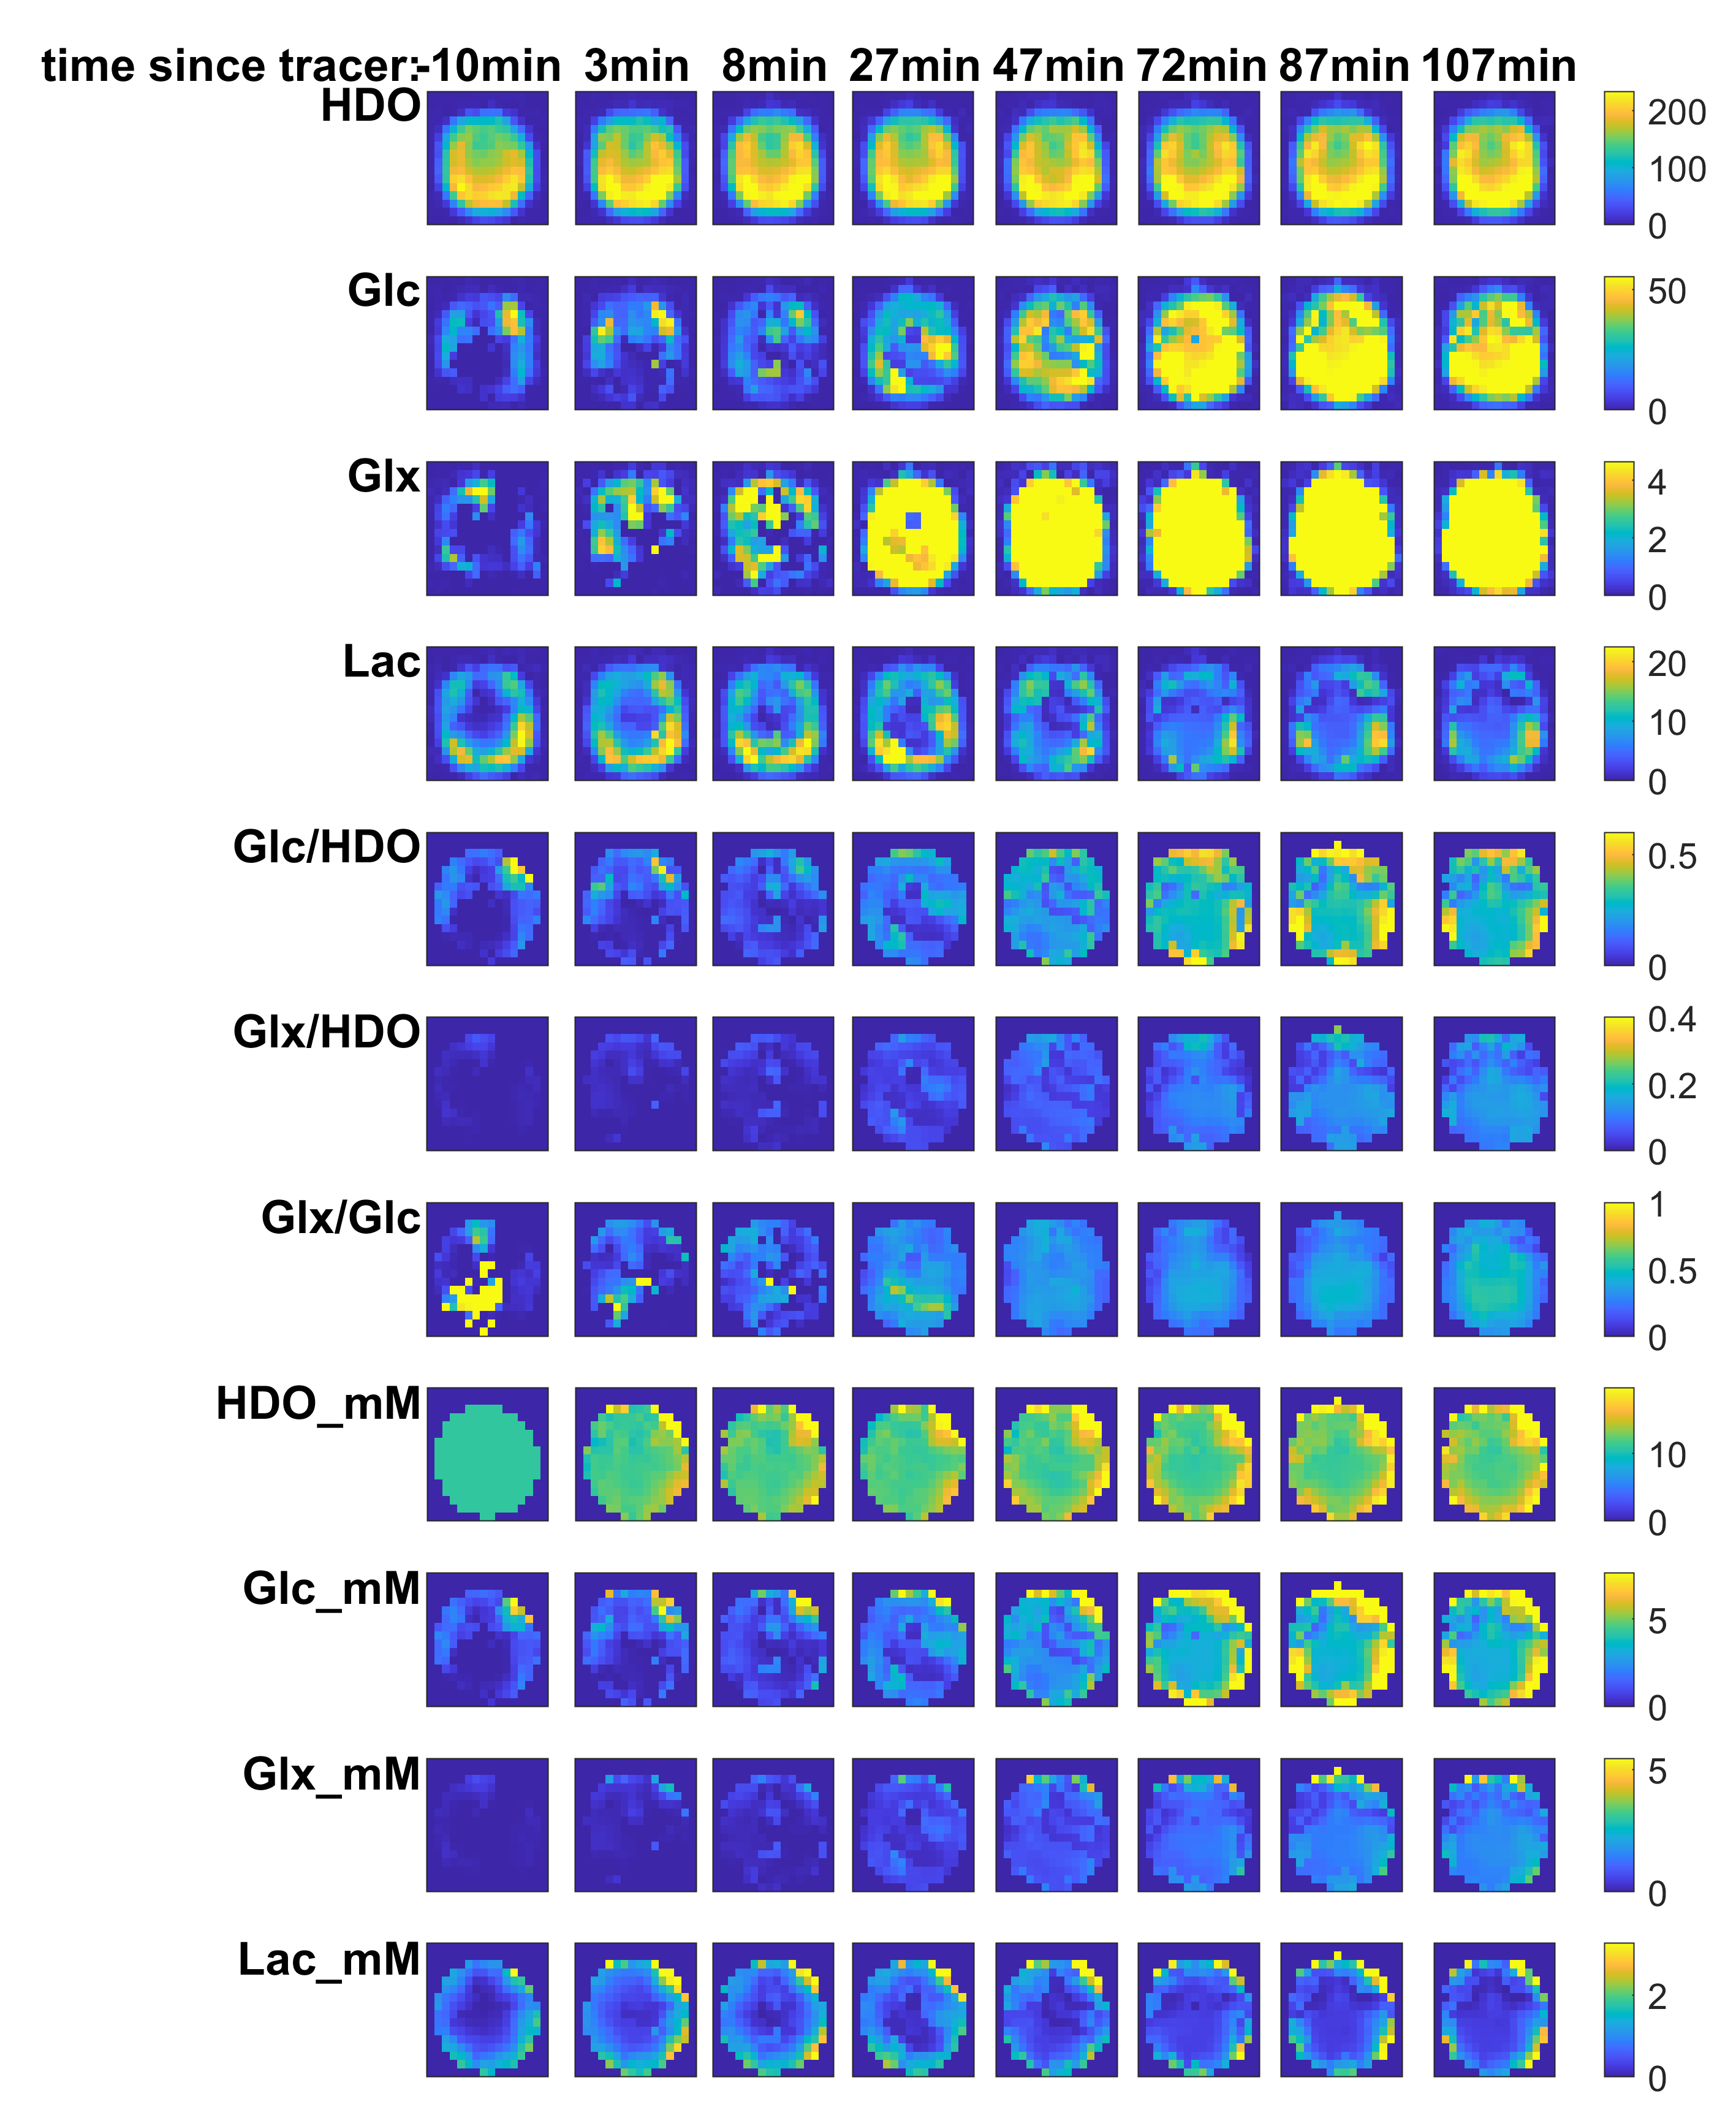
Figure 3: Metabolite maps plotted for a mid-transverse slice from the full 3D CSI datasets for Subject 1. Each column shows a different 3D CSI scan acquired for 5 minutes starting at the times indicated. The matrix was 16x16x8 for a nominal voxel volume of 6.9mL. The 6,6’-[2H2]-glucose was consumed at approximately t=10min. SNR is high due to our 18-element receive array, especially in the posterior periphery which is closest to the coil. Spectra in each voxel were fitted with AMARES in our OXSA Matlab toolbox.
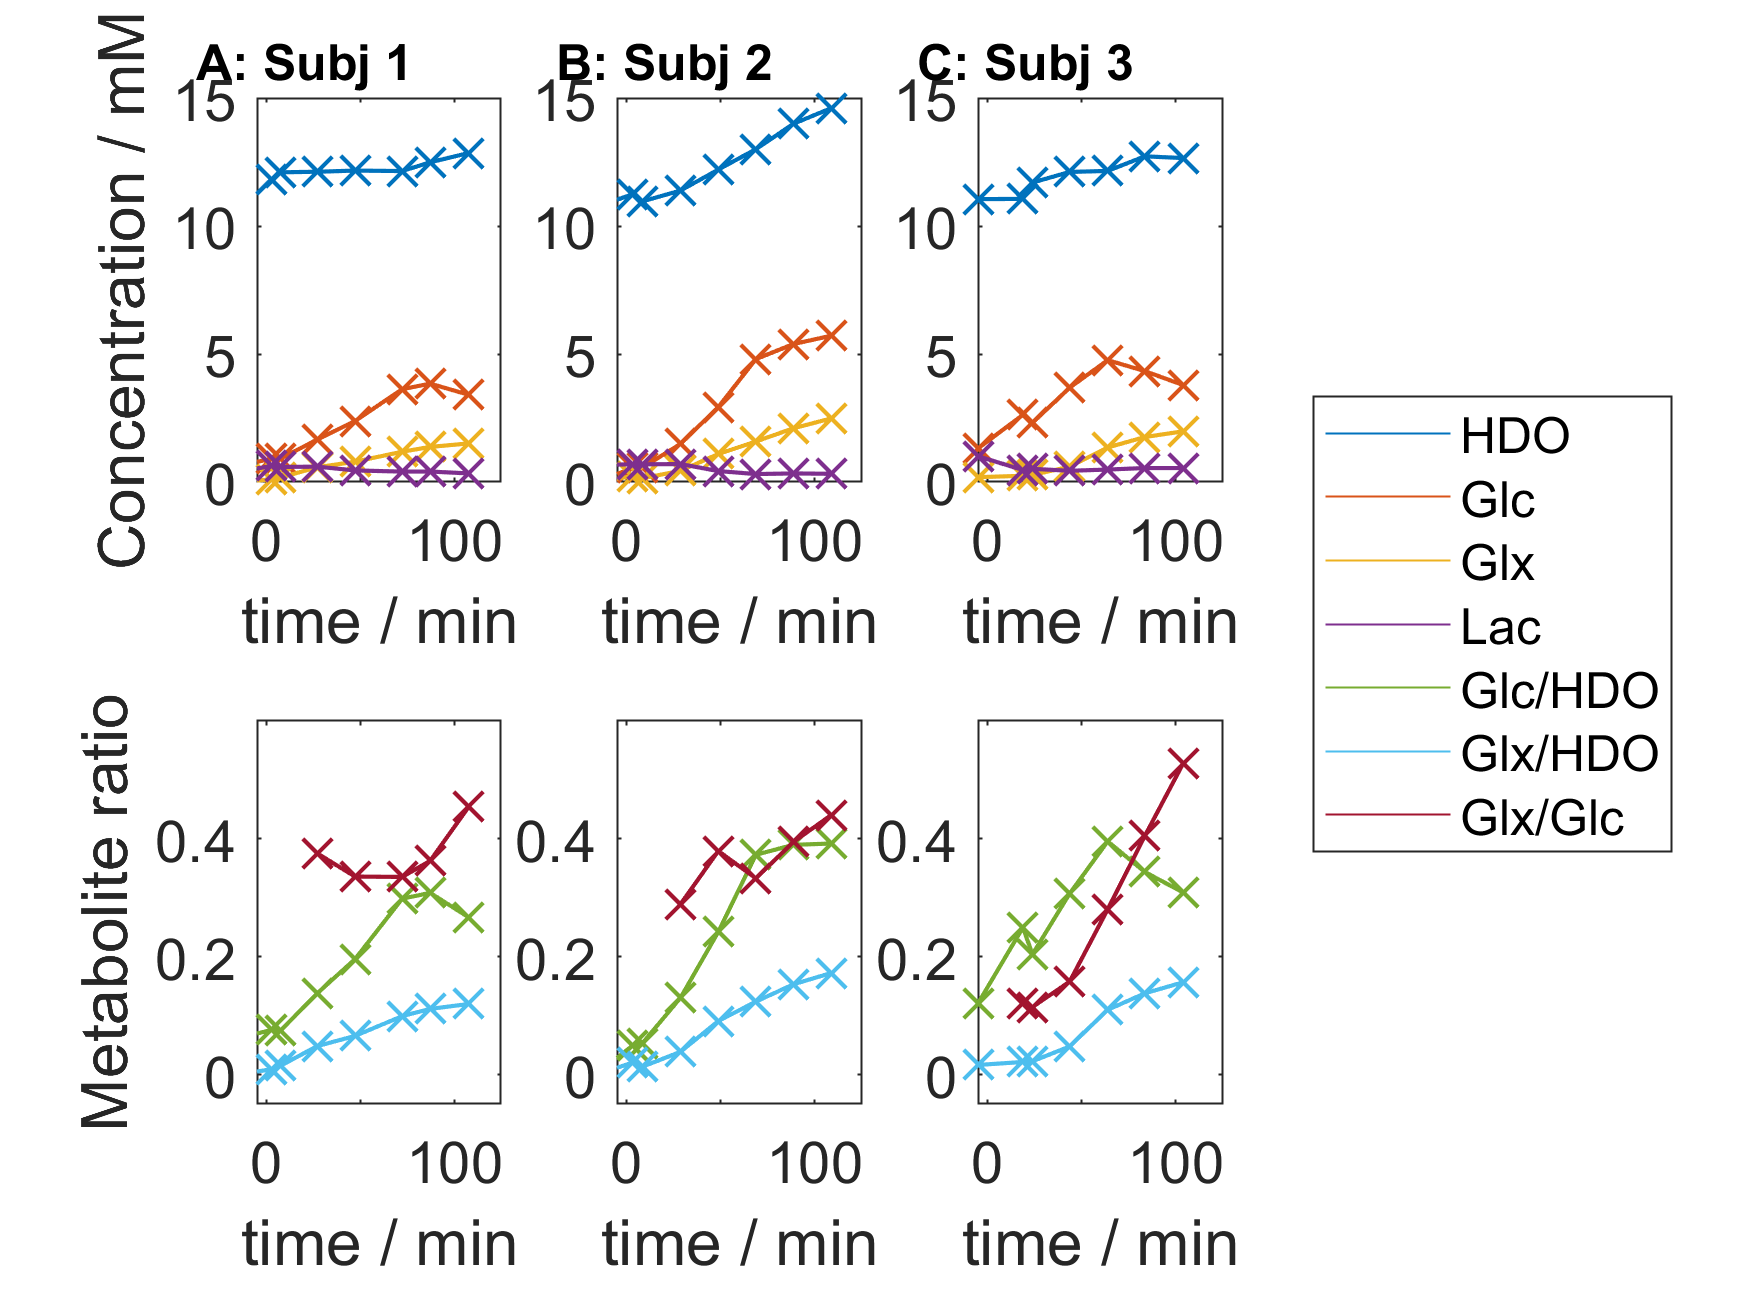
Figure 4: Mean values for the metabolites and metabolite ratios from the mid-transverse slices of the full 3D CSI datasets. Column A corresponds to the maps shown in Figure 2. In this 2-hour session, glucose appears in the brain and plateaus after around 75-120 minutes. Glx increases throughout the scan. Negligible lactate is seen in these are healthy volunteers. The “Lac” signal near 1.4ppm at early times is mainly localised by the skull and has been attributed to lipids by Ruhm et al.1
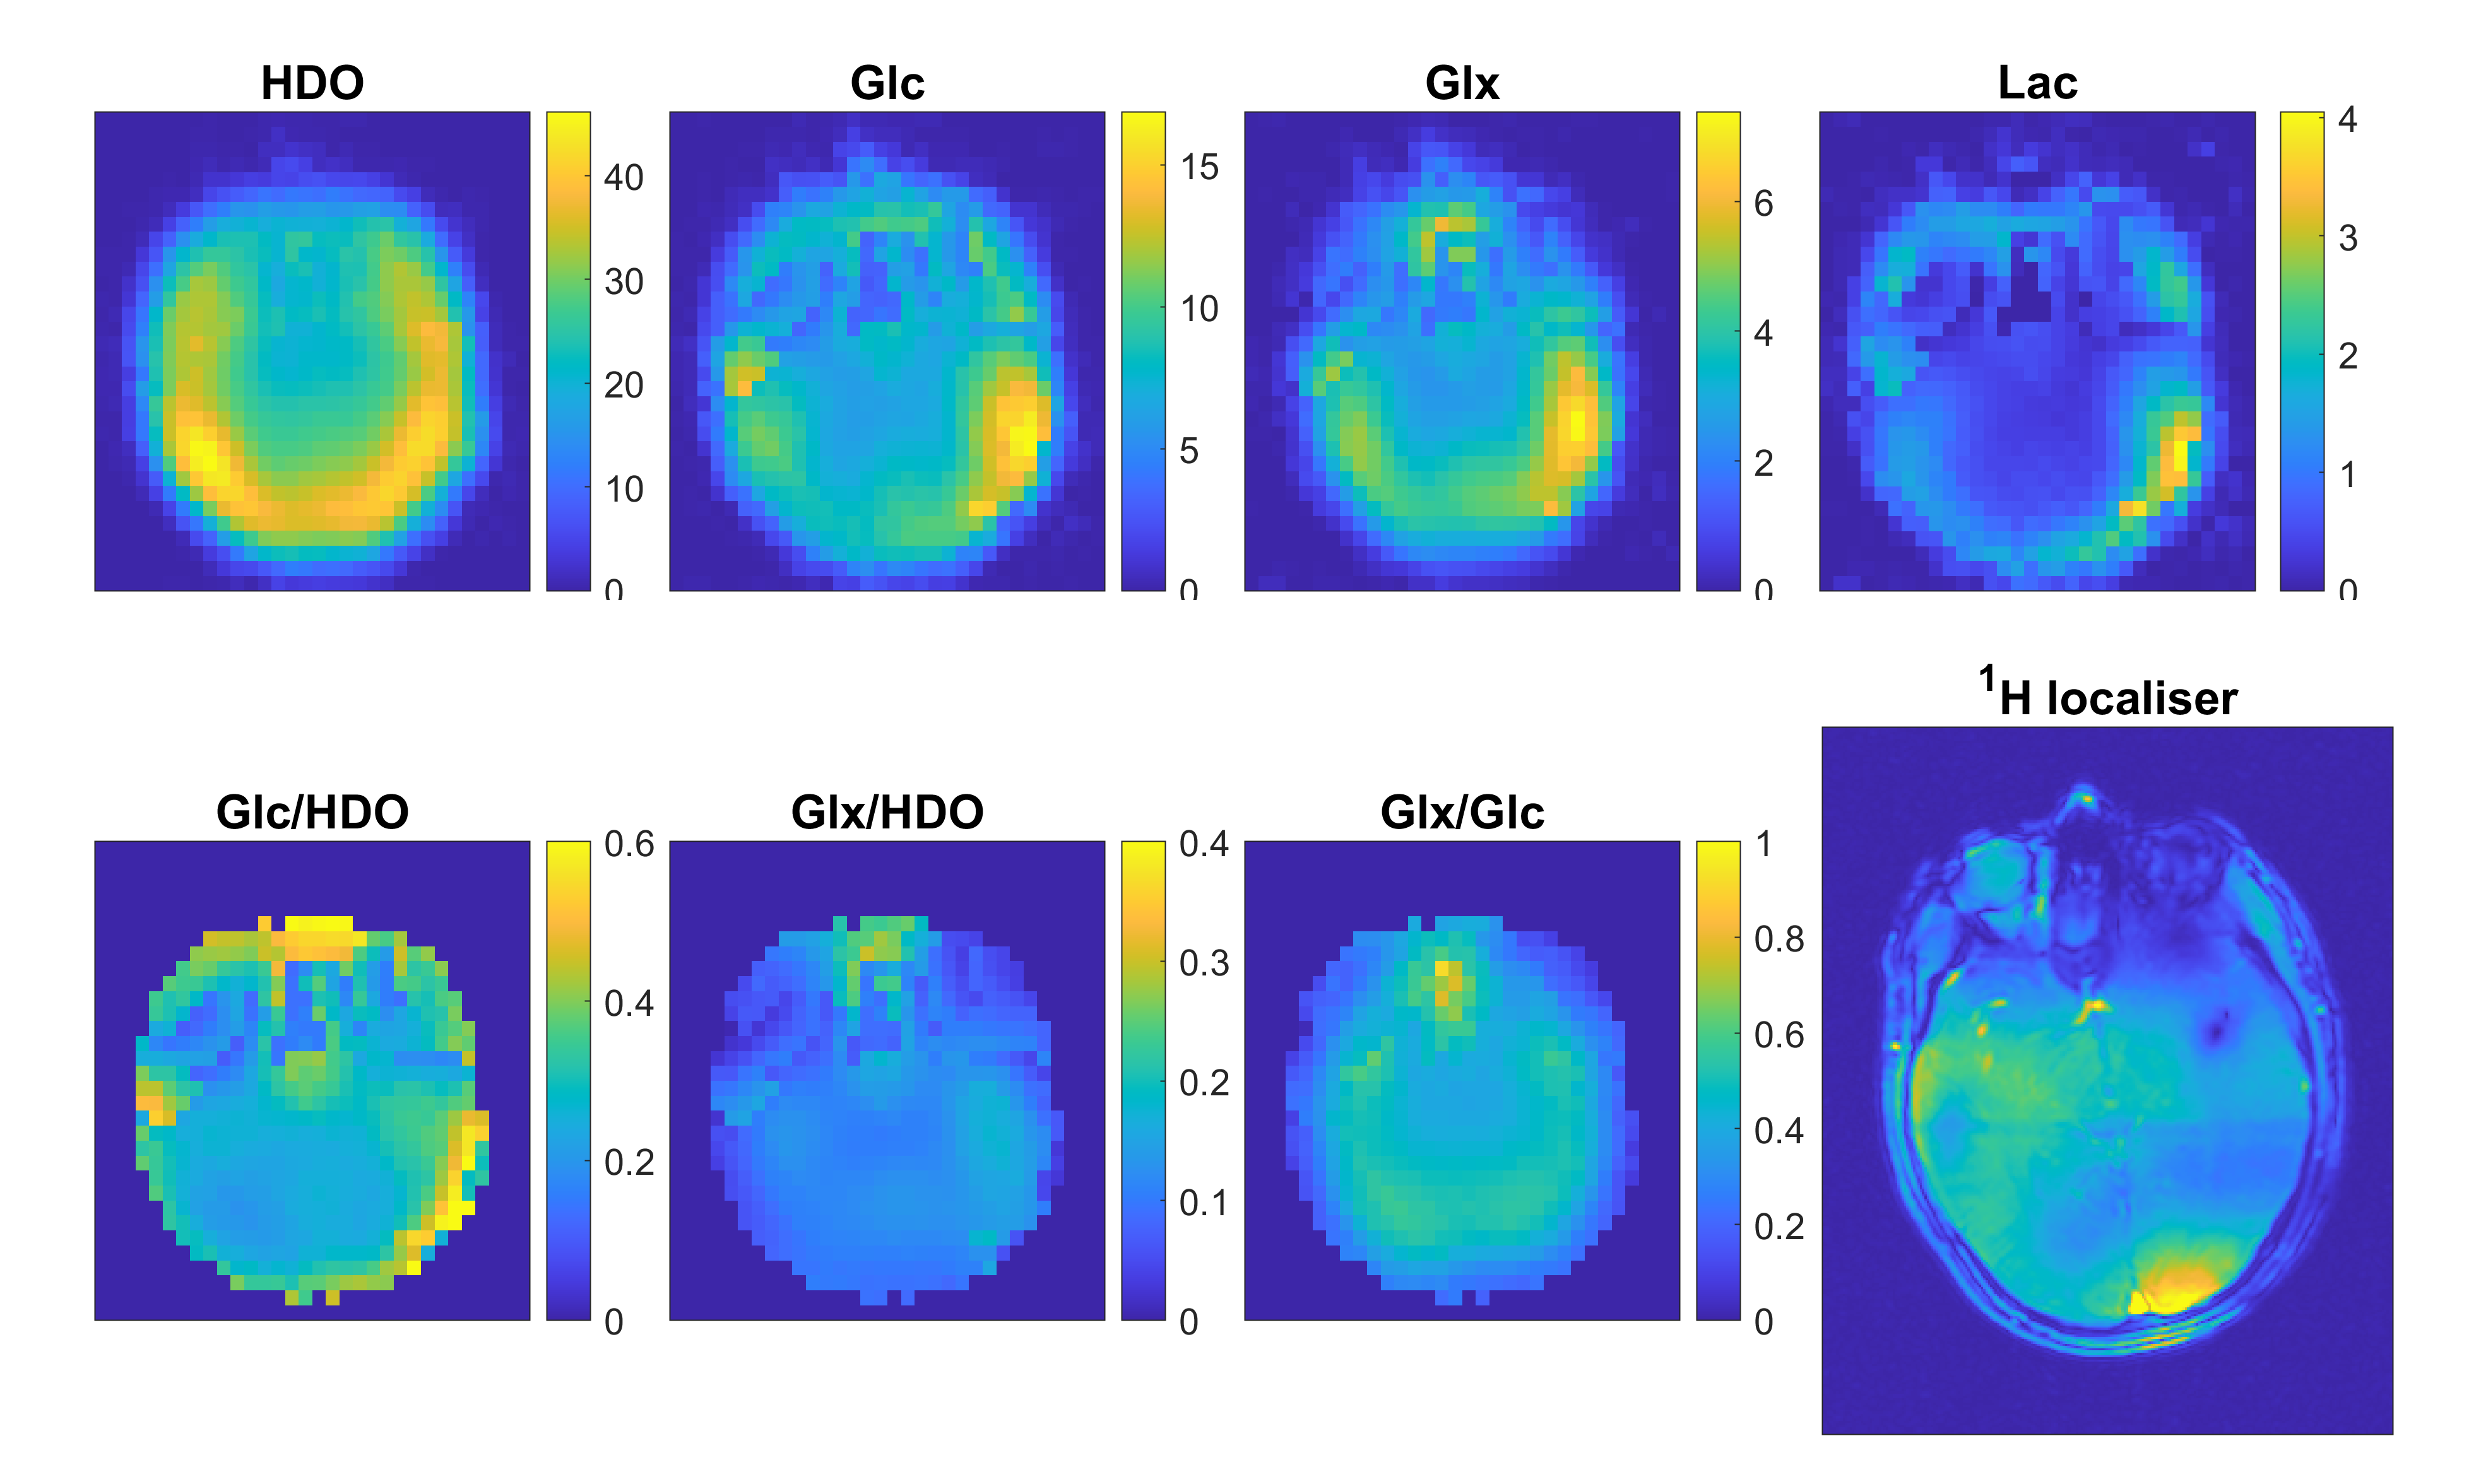
Figure 5: Mid slice from a 3D CSI dataset acquired after around 100 minutes in Subject 1. The acquisition matrix was 20x20x12 with a nominal voxel volume of 2.9mL. These maps were interpolated to 32x32x16 during reconstruction. Scan time was 13m40s.