3869
Improving SNR in deuterium metabolic imaging of cancer: spatial denoising, joint spectral/metabolic-kinetics processing, and beyond1Weizmann, Rehovot, Israel, 2Chinese Academy of Sciences, Wuhan, China, 3University of Twente, Enschede, Netherlands, 4Yale School of Medicine, New Haven, CT, United States
Synopsis
Keywords: Deuterium, Cancer, MRSI
As DMI is a promising cancer screening approach but is challenged by low sensitivity, this study assesses multiple approaches to increase its SNR. Some of these –apodization, Compressed Sensing Multiplicative (CoSeM), Block-matching/3D filtering (BM3D)– involve image denoising. Others take into account the metabolic kinetics, and include it as dimension to be denoised. This can be achieved by smoothing the kinetic data axis via regularization, or by using subspace-constrained representations to concurrently solve for the 4D spatial/spectral/kinetics set. These methods can be further denoised –e.g., by CoSeM– leading to much clearer observations of lactate generated by in vivo tumor models.Introduction
DMI is a promising approach whereby, following administration of [6,6’-2H2]-glucose, the formation of [3,3’-2H2]-lactate in tumors is followed as a function of time.1-4 This metabolic imaging is challenged by low SNR. It was recently shown that multi-echo balanced steady-state free precession (ME-bSSFP) acquisitions followed by an IDEAL-adapted recon based on a priori known chemical shifts,5 can increase ≈3x DMI’s SNR over regular CSI.4 This work assesses a number of approaches to increase further the sensitivity of lactate detection. These include denoising the IDEAL-provided images, and including the metabolic kinetics as a dimension to be reconstructed. In vivo DMI series processed by either of these approaches evidenced marked SNR improvements, as demonstrated by in vivo pancreatic cancer studies.Methods
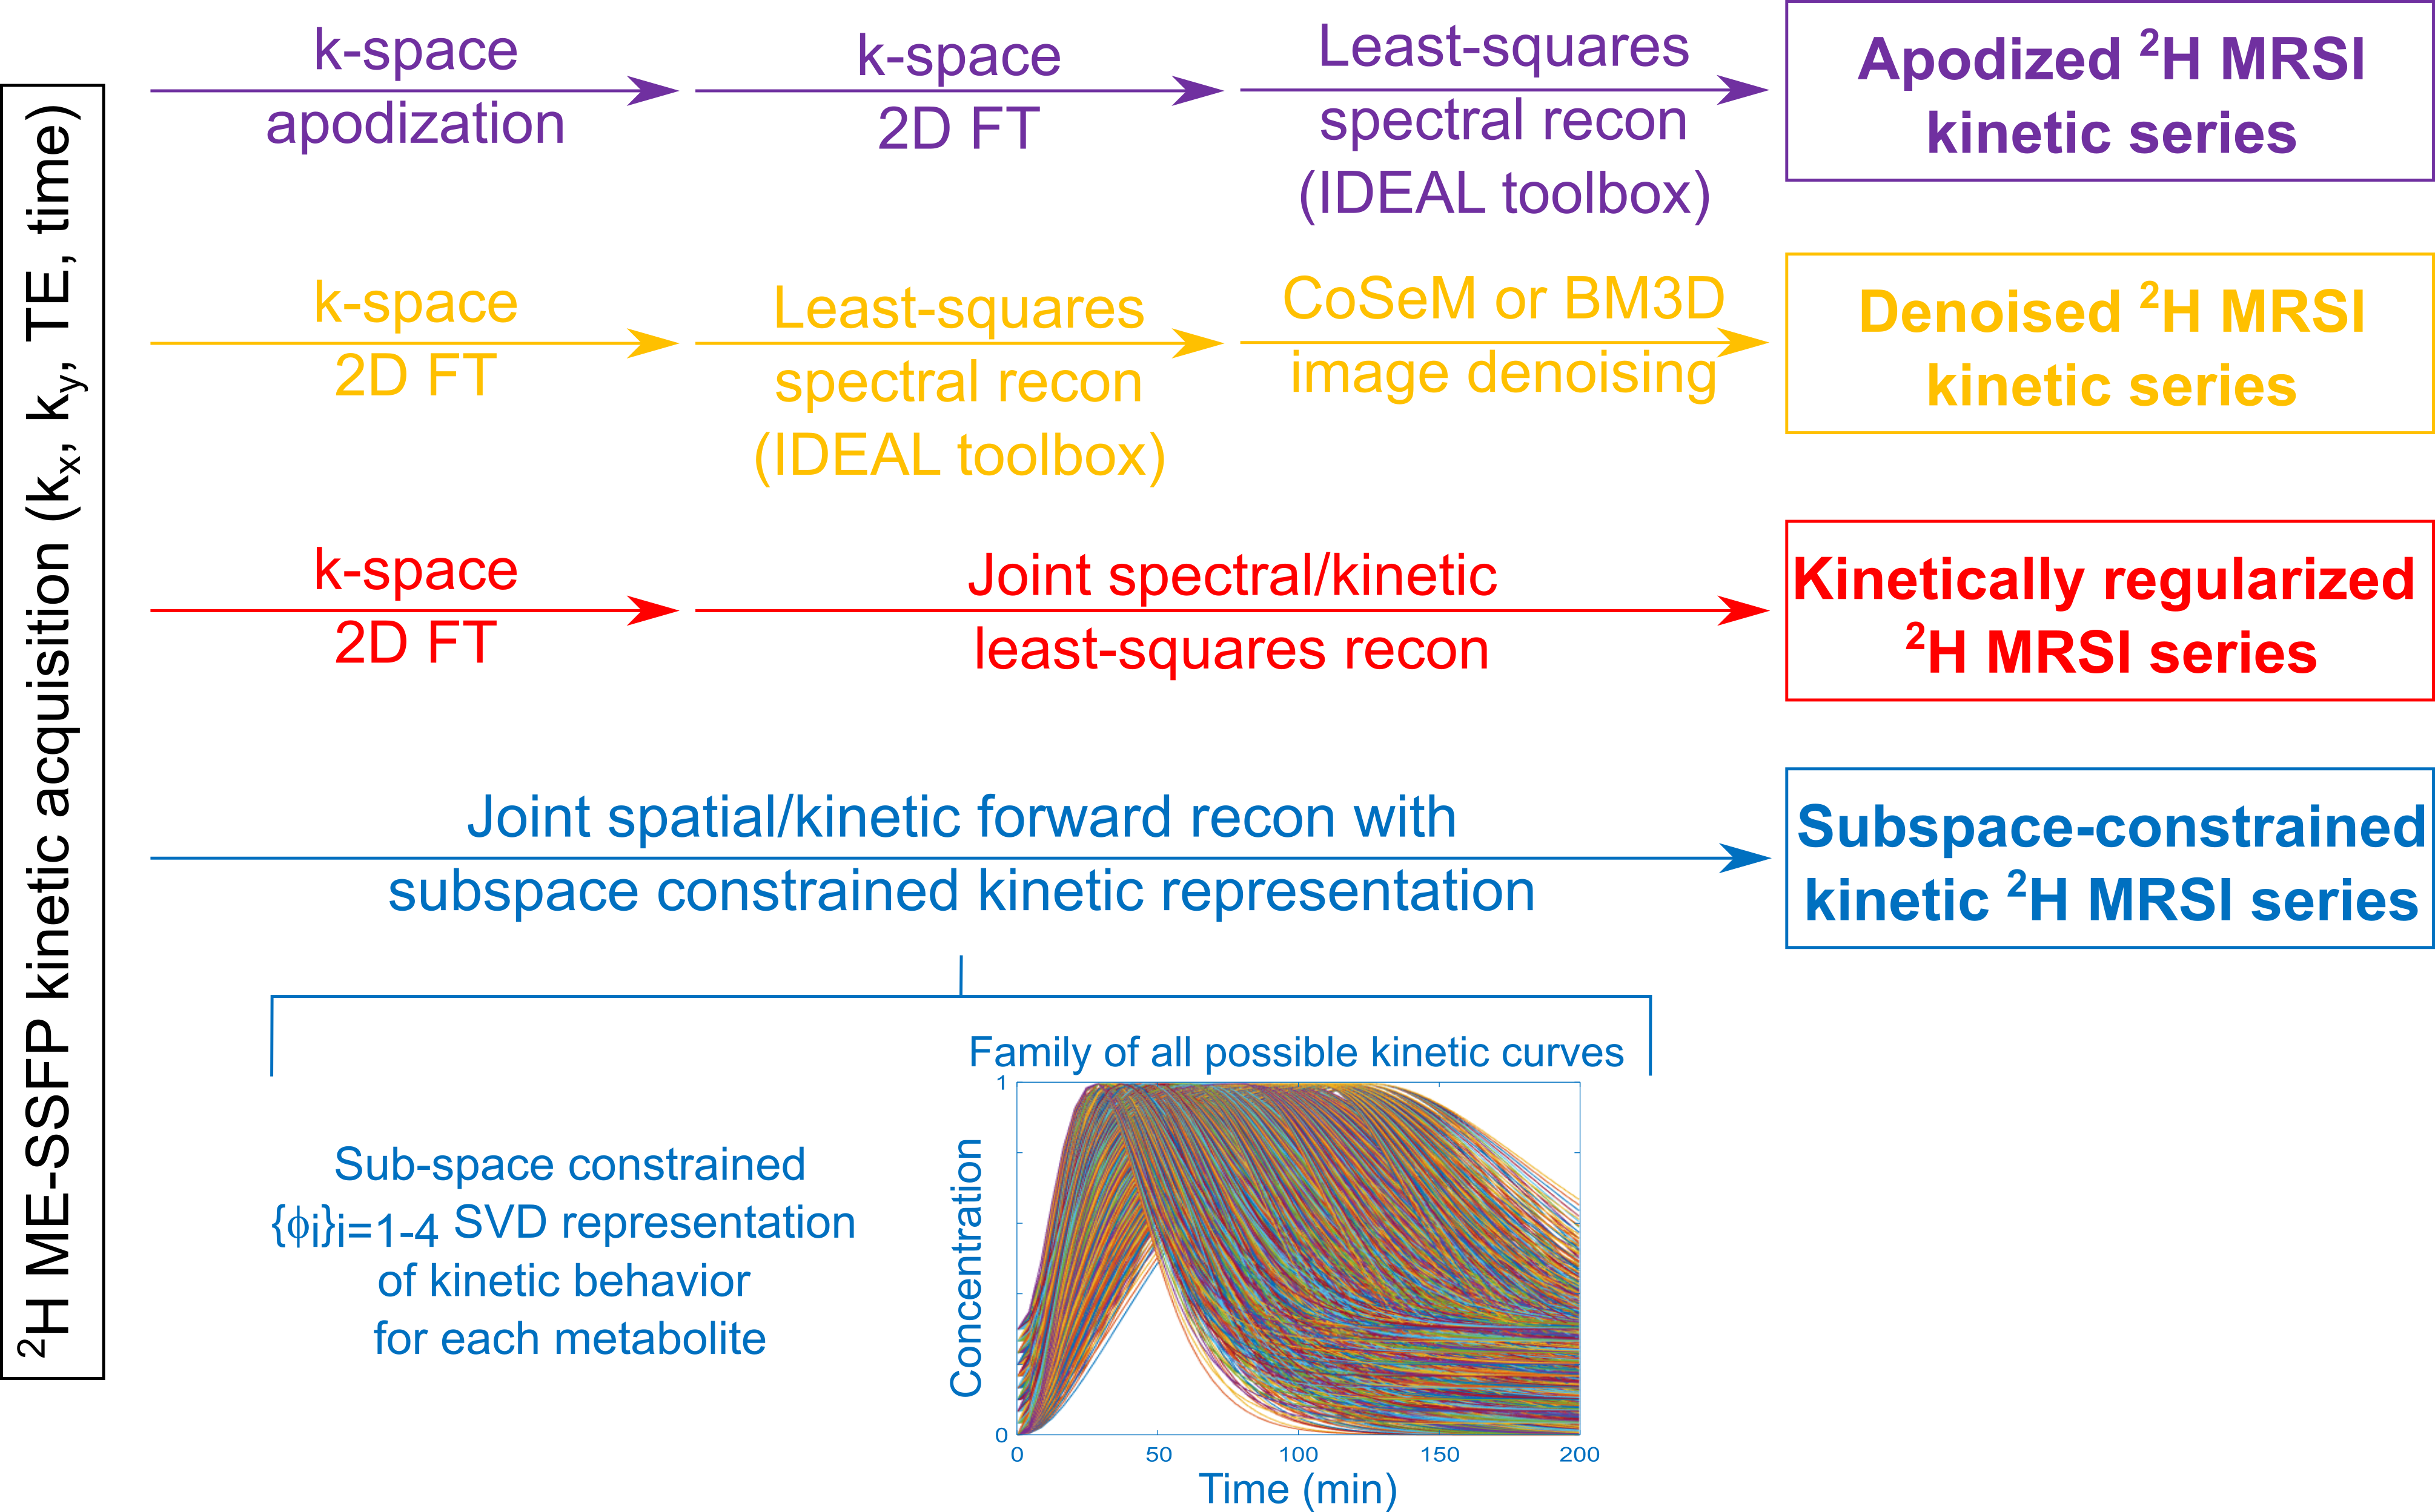
In vivo DMI experiments (approved by Weizmann’s IACUC) were performed on C57black mice implanted with KPC-derived PDAC,3,4 after injecting ~4 g/kg body weight of deuterated glucose in PBS via the tail vein. 2H ME-bSSFP data was acquired on a 15.2T Bruker using surface coils tuned to 650 (1H) and 99.8MHz (2H), and optimized ME-bSSFP parameters as follows: TR=11.48ms, five TEs with 2.1ms echo spacings, 60° flip angle, ~6 min signal averaging per image, 32x32 matrix sizes, FOV=40x40mm2, ≈10mm slices accommodating the full tumors. 1H imaging: TurboRARE, 10 slices, 0.8mm thickness, FOV as ME-bSSFP, 512x512 matrix.ME-bSSFP k-space data were zero-filled to 64x64; further reconstruction followed all the methods described in Figure 1. These tests included two denoising methods after the IDEAL-based separation: Compressed Sensing Multiplicative denoising6 (CoSeM, 2000 renditions, lambda=0.4, threshold=0.05), a method which works on complex images; and BM3D, which works on magnitude images and was here applied on real and imaginary components separately (σ = twice standard deviation of the noise calculated from the image border; “sigma_psd” in the BM3D script7) and then subsequently combined. These methods were compared against k-space apodization (13mm FWHM Gaussian) before FT reconstruction.
Two new reconstruction methods were also developed. The kinetically regularized reconstruction extends the IDEAL recon to include a smoothness of the metabolic images along the kinetic dimension. To do so the ME spectral/kinetic recon problem was cast as
$$\vec{s}=A(\omega)\vec{\rho}\qquad\qquad(1)$$
where $$$\vec{s}=[s_{11}s_{12}s_{13}s_{14}s_{15}s_{21}s_{22}s_{23}...s_{in}...]^{T}$$$ are the signals recorded for the various $$$\{TE_i\}_{i=1-5}$$$ in the different kinetic series $$$n=\{1,2,…\}$$$, $$$\vec{\rho}=[\rho_{a1}\rho_{b1}\rho_{c1}\rho_{b2}\rho_{a2}...\rho_{mn}...]^{T}$$$ are the images of the various $$$\{a,b,c\}$$$ metabolites expected in the kinetic series $$$n=\{1,2,…\}$$$, and
$$A\left(\omega\right)=\left(\begin{matrix}\begin{matrix}e^{i\omega_a{TE}_1}&e^{i\omega_b{TE}_1}&\ldots\\e^{i\omega_a{TE}_2}&e^{i\omega_b{TE}_2}&\ldots\\\vdots&\vdots&\ddots\\\end{matrix}&\begin{matrix}0&0&\cdots\\0&0&\cdots\\\vdots&\vdots&\ddots\\\end{matrix}\\\begin{matrix}0&0&\cdots\\0&0&\cdots\\\vdots&\vdots&\ddots\\\end{matrix}&\begin{matrix}e^{i\omega_a{TE}_1}&e^{i\omega_b{TE}_1}&\ldots\\e^{i\omega_a{TE}_2}&e^{i\omega_b{TE}_2}&\ldots\\\vdots&\vdots&\ddots\\\end{matrix}\\\end{matrix}\right)\qquad\qquad(2)$$
accounts for the phase and kinetic evolutions. The metabolic time-series $$$\vec{\rho}$$$ was then obtained by a least-square estimation regularized by an $$$\alpha$$$-parameter ensuring smoothness of the kinetic evolution; i.e., by iteratively solving
$$\mathrm{argmin}\{||{\vec{s}}_0-A\vec{p}||_2+\alpha\sum_{m=a,b,c}\sum_{n=1,2,..}\left(p_{m\left(n+1\right)}-p_{mn}\right)^2\}\qquad\qquad(3)$$The subspace-constrained reconstruction model represented the kinetic evolution of each metabolite $$$m$$$ by its own $$$\phi_m=[\phi_{m,1}...\phi_{m,4}]$$$ SVD-based representation,8 where the $$$\{\phi_{n,m}(t)\}$$$ ’s describe all reasonable $$$m$$$-concentrations as function of time. The time-dependent map $$$x_m$$$ of any metabolite can thus be defined by $$$\{\beta_{n,m}\}_{n=1-4}$$$ coefficients multiplying this temporal basis $$$x_m=\phi_m\beta_m$$$. To solve for these while resolving for the metabolites encoded by the $$$\{TE_i\}_{i=1-5}$$$, the problem was cast as a forward search seeking to minimize$$\mathrm{argmin}\{\sum_{m=a,b,c}\sum_{i=1-5}{||e^{i2\pi\omega_m{TE}_i}FT\left(x_m\right)-s_{{TE}_i}||}_2^2+\sum_{m=a,b,c}{\lambda_m{||R\left(x_m\right)||}_1}\}\qquad\qquad(4)$$
where $$$R$$$ is a sparsifying transform. Obtaining the $$$\phi_m$$$ also required adopting a model for each metabolite, which we based on Kety models of arterial input functions,9 whose curves were reduced for to a four-element subspace by SVD. Equation (4) was solved by adapting the Dixon-RAVE method10 to include a kinetic dimension, three metabolites (glucose, water, lactate) and Cartesian sampling.
All methods were run on a standard desktop.
Results & Discussion
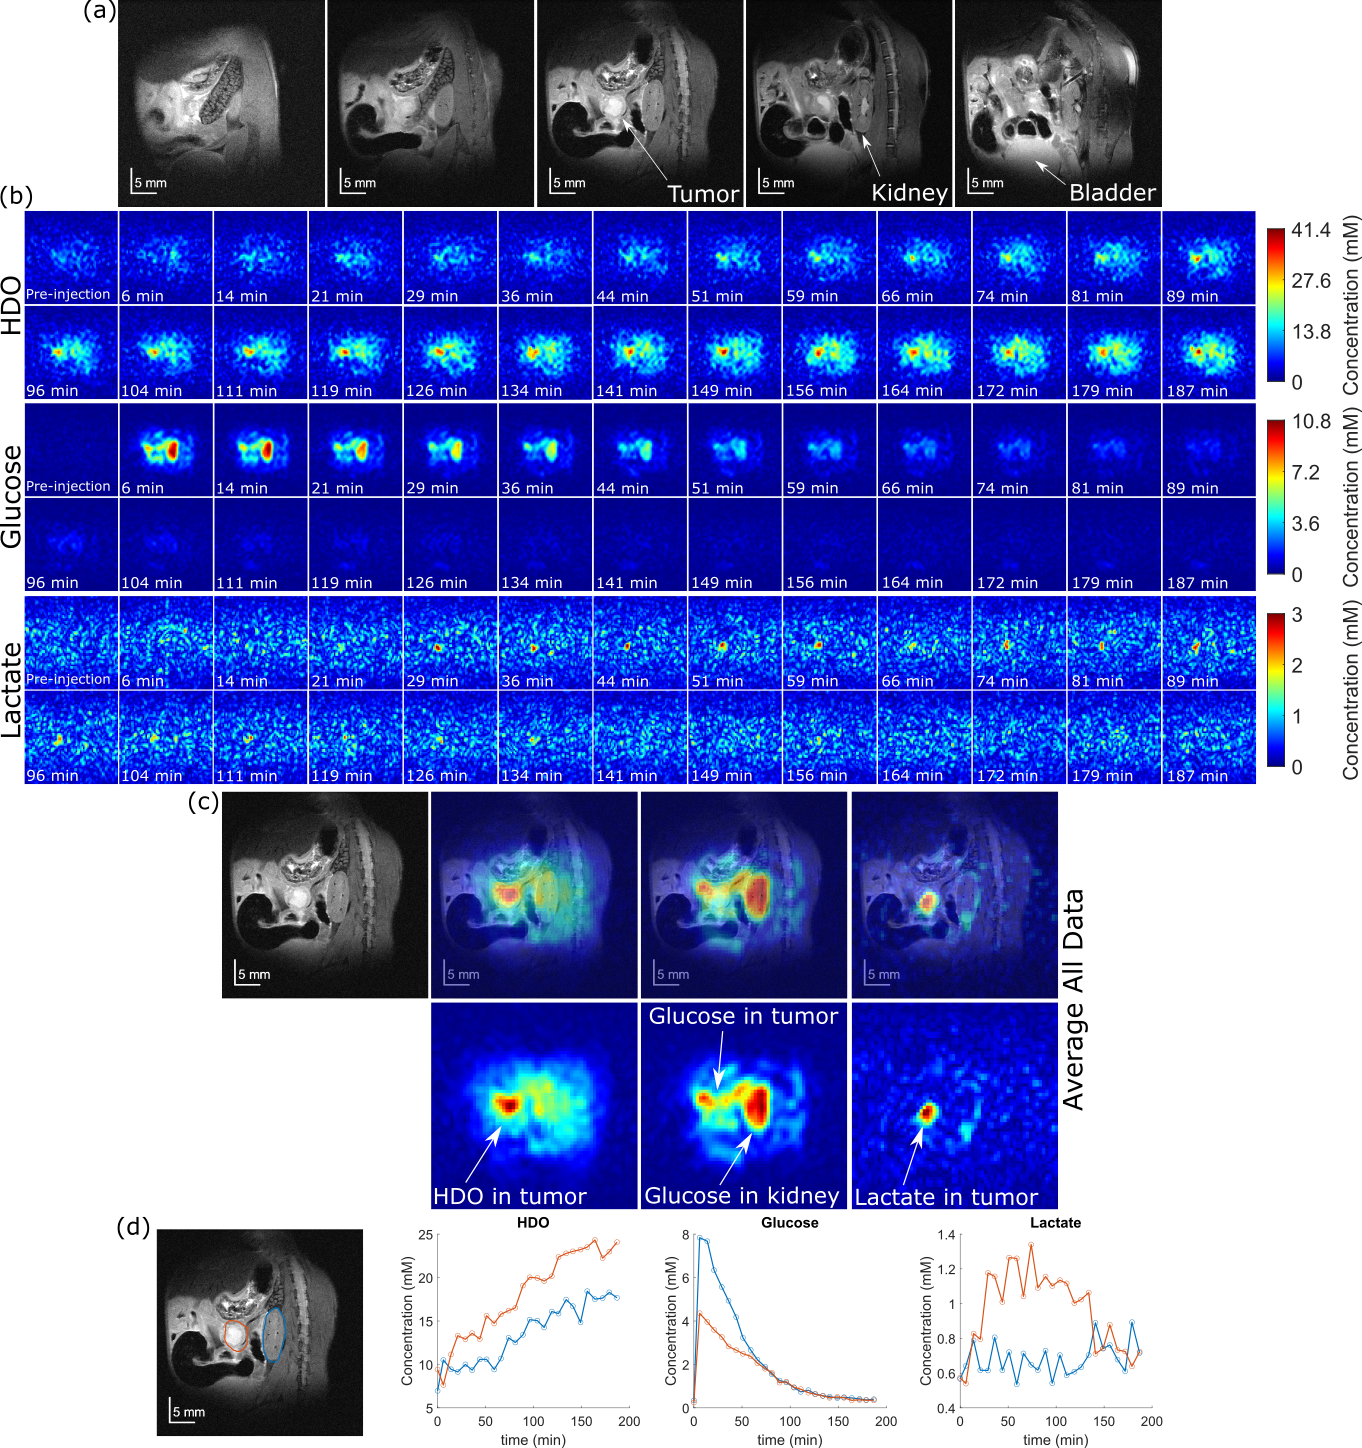
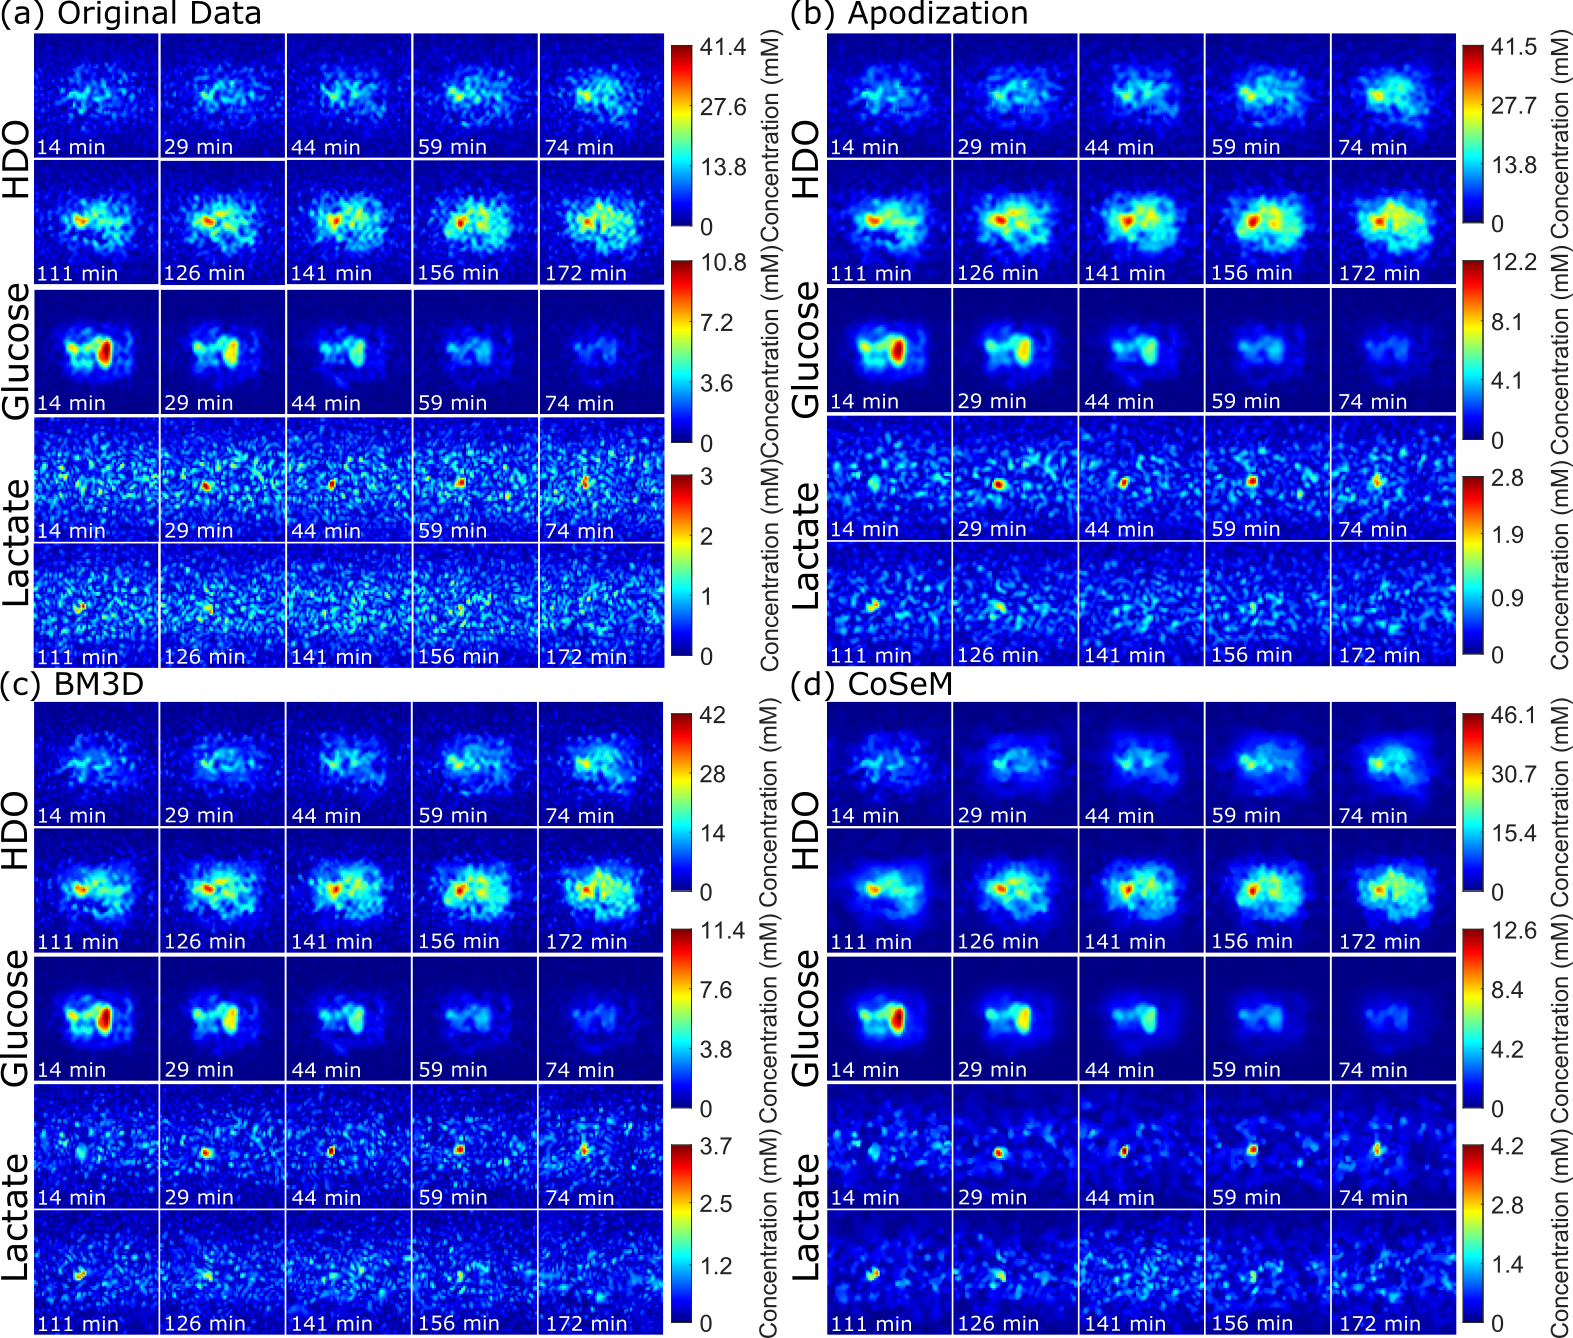
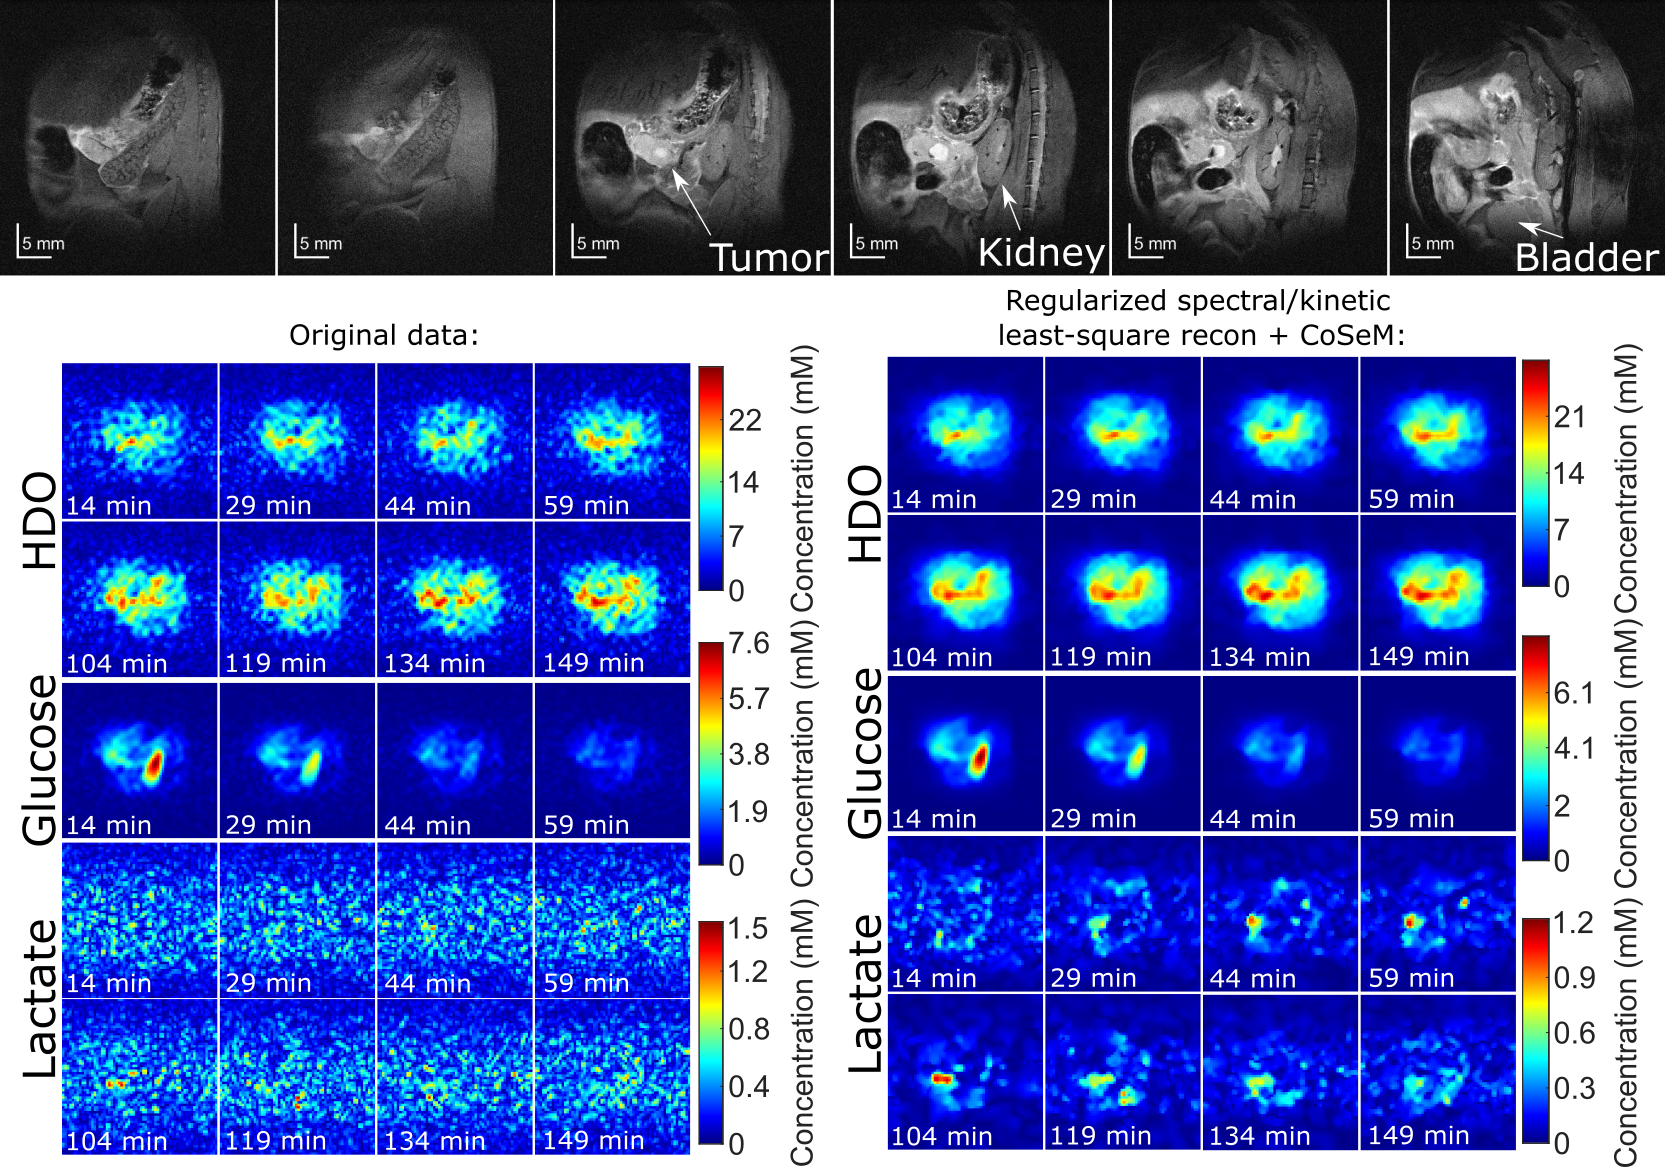
Figure 2 shows 1H and DMI images collected on a PDAC-implanted mouse, as a function of time post glucose injection. This ME-bSSFP DMI data was separated for HDO, glucose and lactate using the IDEAL method.5 Notice the initial rise of glucose in the kidney and surrounding the tumor followed by a rapid decay, as HDO and lactate increase and accumulate in the tumor –as well as the noisiness of the maps and time courses.Figure 3 compares these DMI images with denoised counterparts. All methods noticeable improve the SNR, but also introduce blurring effects. BM3D and CoSeM introduce less blurring than apodization, with equal or better denoising performances.
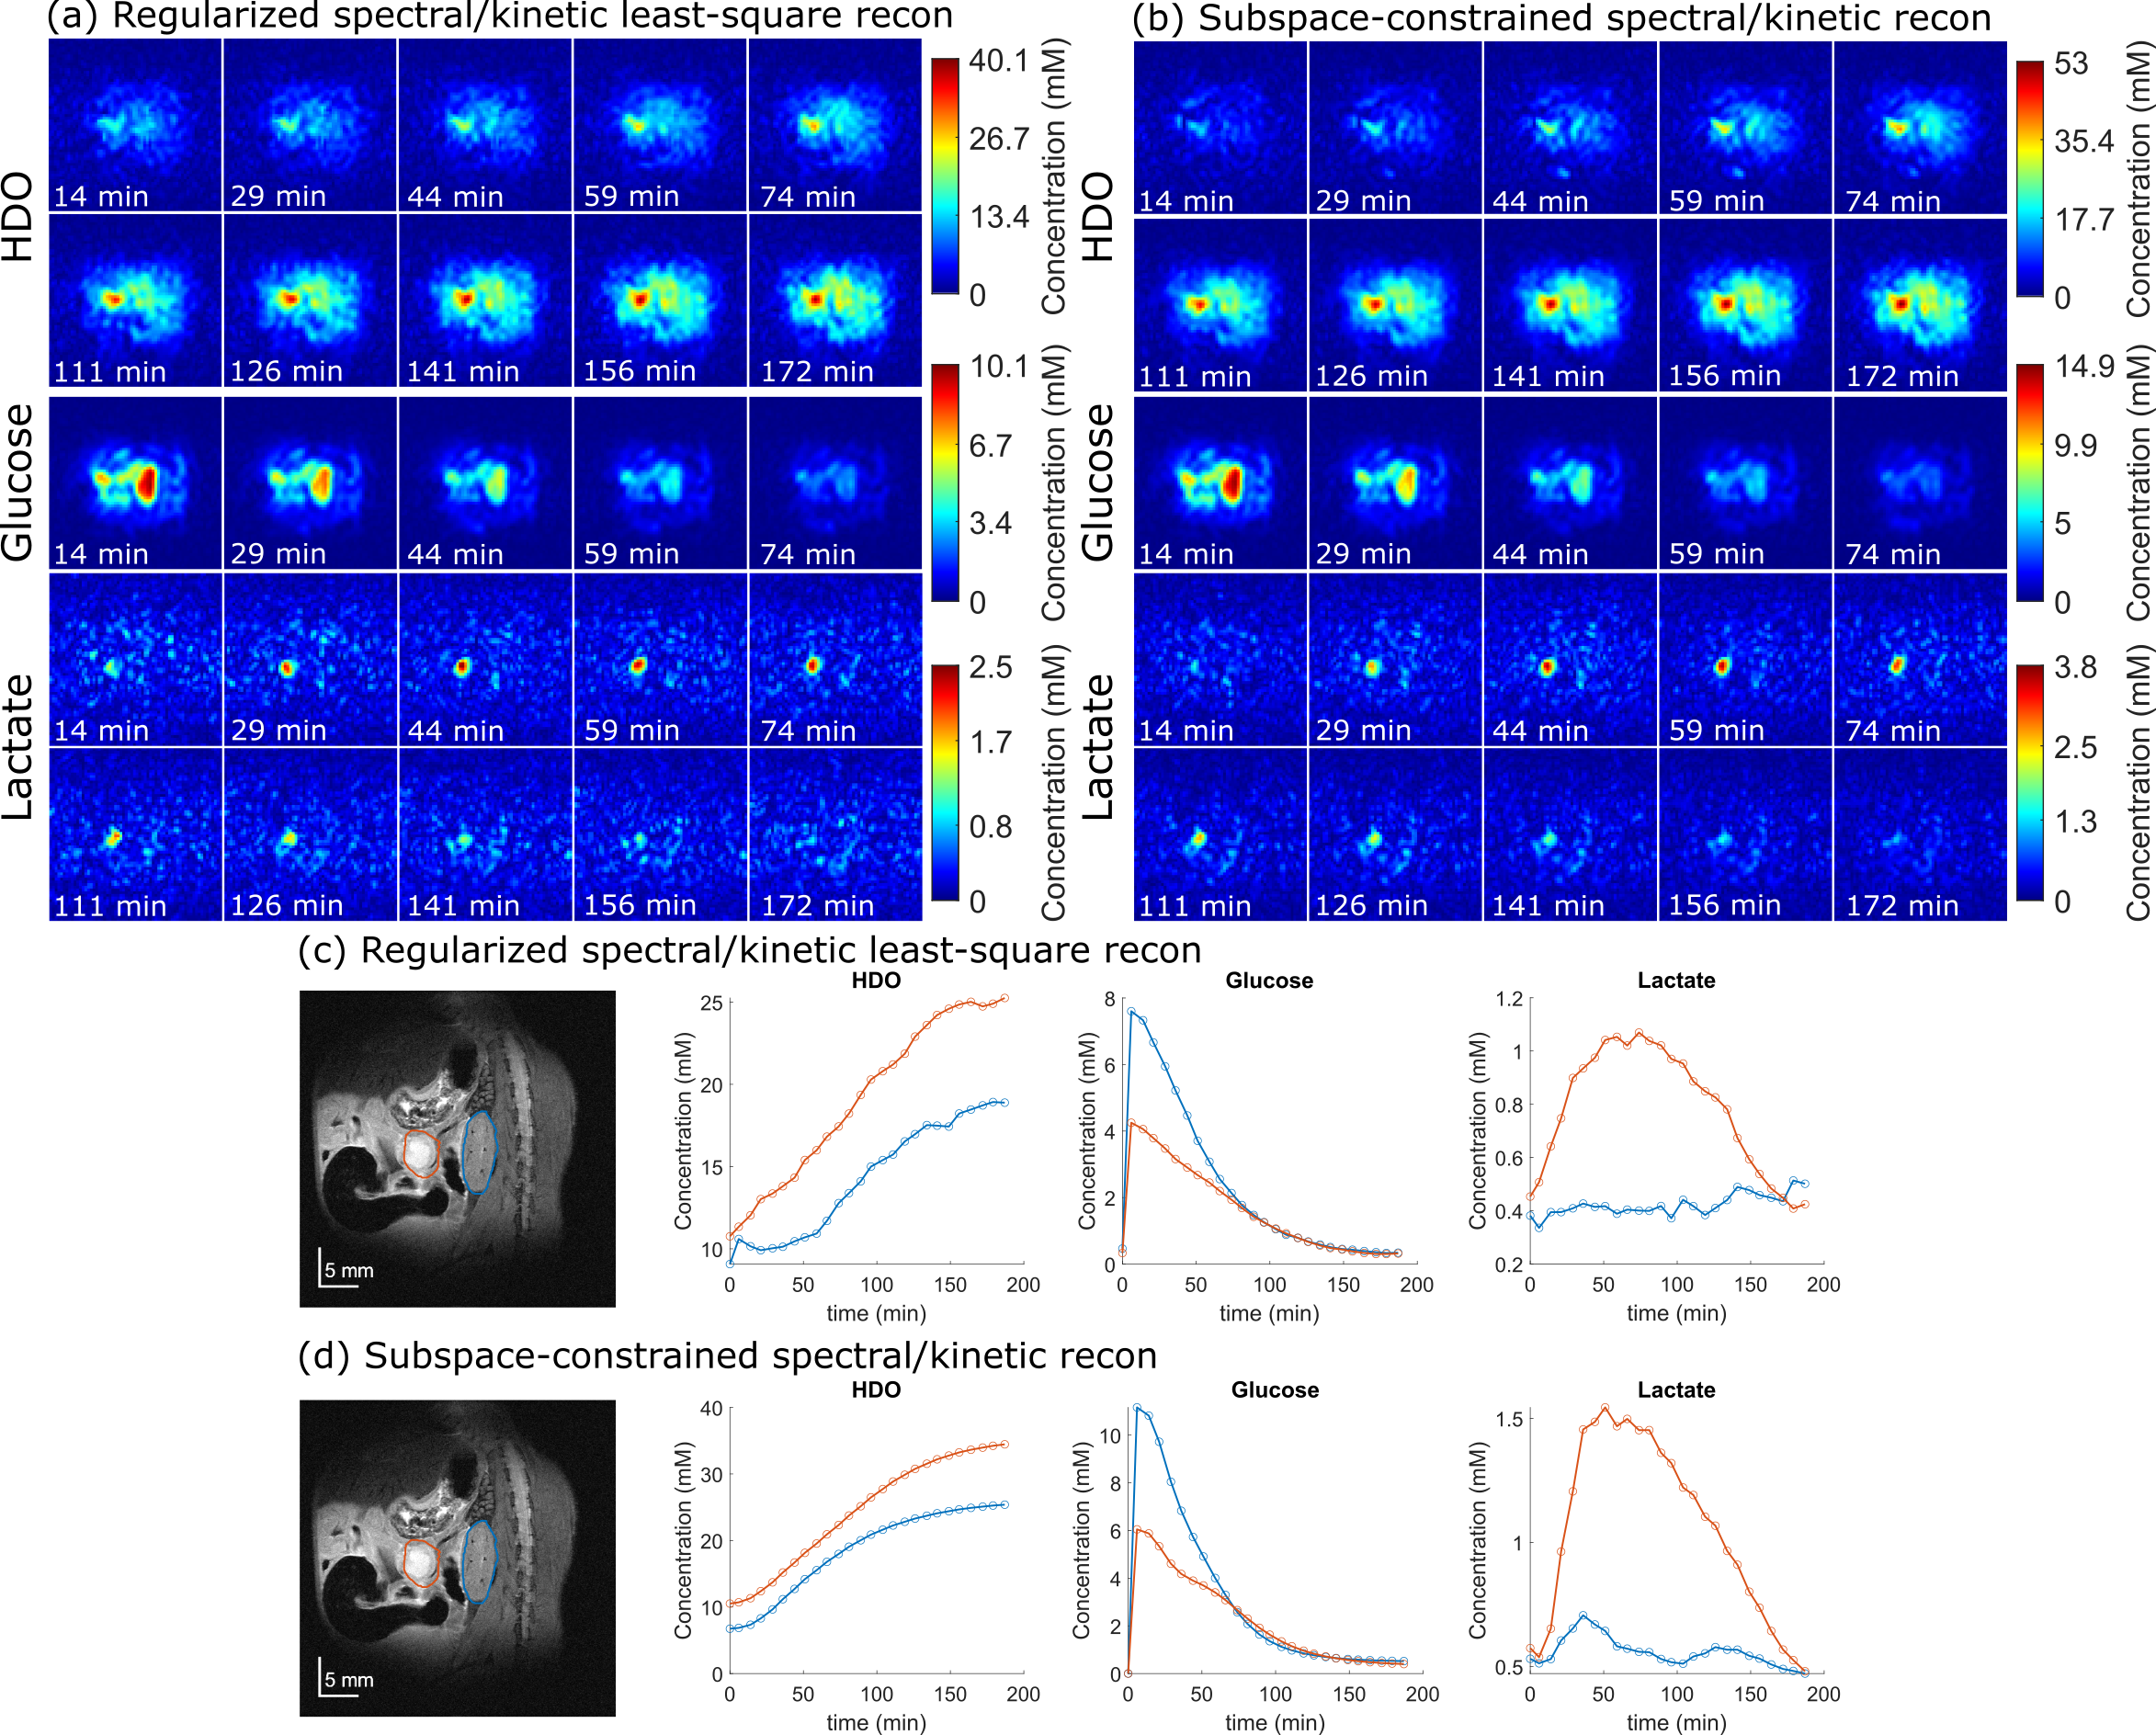
Figure 4 shows the outcome of kinetically regularized and subspace-constrained recons. Both of these clearly increase SNR and the quality of the DMI images over the original IDEAL method. The maps are also free from the spatial blurring introduced by denoising methods –even if the subspace-constrained approach seems to overestimate the glucose concentration. This is probably a failure of the Kety model used to derive the $$$\phi_{glucose}$$$: while glucose decays in the abdomen it also accumulates (and stays) in the bladder: in fact, unless the latter is masked, the subspace-constrained method will provide wrong kinetic curves.
Figure 5 compares scans on an animal that presented low SNR for the lactate maps, when reconstructed solely by IDEAL and by a denoised and kinetically-regularized pipeline. The ability of the latter to rescue lactate maps out of the noise is very clear, thus confirming the value of these methods in cancer DMI.
Acknowledgements
This work was supported by the Minerva, the Israel Science, and the Israel Cancer Research Foundations, and by the Weizmann-Yale exchange program. LF heads the Clore Institute for High-Field Magnetic Resonance Imaging and Spectroscopy, whose support is also acknowledged.References
1. Lu M, Zhu XH, Zhang Y, Mateescu G, Chen W. Quantitative assessment of brain glucose metabolic rates using in vivo deuterium magnetic resonance spectroscopy. J Cereb Blood Flow Metab. 2017 Nov;37(11):3518-3530. doi: 10.1177/0271678X17706444.
2. De Feyter HM, Behar KL, Corbin ZA, Fulbright RK, Brown PB, McIntyre S, Nixon TW, Rothman DL, de Graaf RA. Deuterium metabolic imaging (DMI) for MRI-based 3D mapping of metabolism in vivo. Sci Adv. 2018 Aug 22;4(8):eaat7314. doi: 10.1126/sciadv.aat7314.
3. Markovic S, Roussel T, Agemy L, Sasson K, Preise D, Scherz A, Frydman L. Deuterium MRSI characterizations of glucose metabolism in orthotopic pancreatic cancer mouse models. NMR Biomed. 2021 Sep;34(9):e4569. doi: 10.1002/nbm.4569.
4. Peters, DC, Markovic, S, Bao, Q, et al. Improving deuterium metabolic imaging (DMI) signal-to-noise ratio by spectroscopic multi-echo bSSFP: A pancreatic cancer investigation. Magn Reson Med. 2021; 86: 2604– 2617. https://doi.org/10.1002/mrm.28906
5. Reeder SB, Pineda AR, Wen Z, Shimakawa A, Yu H, Brittain JH, Gold GE, Beaulieu CH, Pelc NJ. Iterative decomposition of water and fat with echo asymmetry and least-squares estimation (IDEAL): application with fast spin-echo imaging. Magn Reson Med. 2005 Sep;54(3):636-44. doi: 10.1002/mrm.20624.
6. Koprivica D, Martinho RP, Novakovic M, Jaroszewicz MJ, Frydman L. A denoising method for multidimensional magnetic resonance spectroscopy and imaging based on compressed sensing. Journal of Magnetic Resonance. Volume 338, May 2022, 107187. Downloadable from https://www.weizmann.ac.il/chembiophys/Frydman_group/software
7. Y. Mäkinen, L. Azzari and A. Foi, "Collaborative Filtering of Correlated Noise: Exact Transform-Domain Variance for Improved Shrinkage and Patch Matching," in IEEE Transactions on Image Processing, vol. 29, pp. 8339-8354, 2020, doi: 10.1109/TIP.2020.3014721. v2.01, released 3 October 2021, downloaded and used.
8. Tamir JI, Uecker M, Chen W, Lai P, Alley MT, Vasanawala SS, Lustig M. T2 shuffling: Sharp, multicontrast, volumetric fast spin-echo imaging. Magn Reson Med. 2017 Jan;77(1):180-195. doi: 10.1002/mrm.26102.
9. Parker GJ, Roberts C, Macdonald A, Buonaccorsi GA, Cheung S, Buckley DL, Jackson A, Watson Y, Davies K, Jayson GC. Experimentally-derived functional form for a population-averaged high-temporal-resolution arterial input function for dynamic contrast-enhanced MRI. Magn Reson Med. 2006 Nov;56(5):993-1000. doi: 10.1002/mrm.21066.
10. Benkert T, Feng L, Sodickson DK, Chandarana H, Block KT. Free-breathing volumetric fat/water separation by combining radial sampling, compressed sensing, and parallel imaging. Magn Reson Med. 2017 Aug;78(2):565-576. doi: 10.1002/mrm.26392.
Figures