3868
High spatiotemporal resolution whole-brain 2H MRS imaging (DMRSI) to differentiate grey and white matter metabolic dynamics in human brain at 7T1Department of Radiology, University of Minnesota, Minneapolis, MN, United States, 2Beckman Institute for Advanced Science and Technology, University of Illinois at Urbana-Champaign, Urbana, IL, United States, 3National Center for Supercomputing Applications, University of Illinois at Urbana-Champaign, Urbana, IL, United States, 4Department of Electrical and Computer Engineering, University of Illinois at Urbana-Champaign, Urbana, IL, United States
Synopsis
Keywords: Deuterium, Brain
Deuterium MRS imaging (DMRSI) is a promising tool to quantitatively study brain glucose metabolism, but it is challenging to simultaneously achieve high spatial and temporal resolution to capture metabolite dynamics in the human brain. In this study, we applied advanced RF head coil and post-processing techniques to perform high spatiotemporal-resolution (0.7cc nominal voxel and 2.5 min) DMRSI covering entire human brain at 7T with oral administration of deuterated glucose. The results show superior DMRSI sensitivity for mapping and differentiating the TCA cycle activity in grey and white matters. This capability is critical for disease applications including brain tumor.Introduction:
The deuterium MRS imaging (DMRSI) is sensitive and robust to study human brain glucose metabolism compared to traditional 13C MRS and 18F PET imaging methods 1-5. However, it is challenging to simultaneously achieve high spatial and temporal resolution to capture the metabolite dynamics in human brain even at UHF. In this study, we applied advanced RF head coil 6 and SPICE denoising 7,8 techniques to perform ultrahigh-resolution (0.7cc nominal voxel and 2.5 min acquisition time) DMRSI covering the entire human brain at 7T, and to quantify the deuterated metabolites concentrations and dynamic changes in different human brain tissue types after oral administration of deuterated glucose.Methods:
In vivo brain DMRSI acquisition and post-processing:We used a 4-channel 2H/1H dual-frequency head array coil 6 to acquire whole-brain DMRSI in health subjects with oral administration of D-Glucose-6,6-d2 (D66). We acquired 3D-CSI 9 before and after D66 oral administration with 19×19×15 matrix, 18×18×15cm3 FOV, 0.7cc nominal voxel size and cylinder voxel shape, TR=173ms, FA=56° and 2.5 minutes per CSI.
The DMRSI data post-processing pipeline involves 3D FFT, Whitening Singular Value Decomposition (WSVD) 10,11 for coil combination, SPICE denoising FIDs, 10 Hz line broadening in time-domain and zero padding. To compare the DMRSI SNR with published work 2,4, we applied a modified version of the AMARES algorithm which is implemented in MATLAB 2019 12,13 to fit the time-domain FIDs before and after applying SPICE.
Metabolites concentration quantification:
To quantify the molar concentration of metabolites and correct the 2H receive coil sensitivity variation, we first collected the in vivo brain 2H flip angle (FA) maps based on the brain water deuterium signal (HDO) under fully relaxed condition. We calculated the saturation factors based on the FA maps and T1 values of deuterated glutamate/glutamine (Glx), glucose (Glc) and HDO at 7T 2. We then normalized the 2H metabolites signals using the natural abundance HDO signal as internal reference to quantify the concentrations of deuterated water, glucose and Glx across all voxels and at all time points of the DMRSI scans following oral D66 intake (0.75g/kg, 30% solution) in the whole human brain.
Human Brian structure imaging:
The MPRAGE proton density and T1-weighted images were acquired and their ratio images provide the brain structure information. Our FSL-based 14 post-processing pipeline includes noise reduction, brain extractions, and brain segmentations into GM/WM and CSF tissue types. We then co-registered and down-sampled these images to the DMRSI resolution, and calculated tissue type fractions (GM, WM and CSF %) for all DMRSI voxels.
Results:
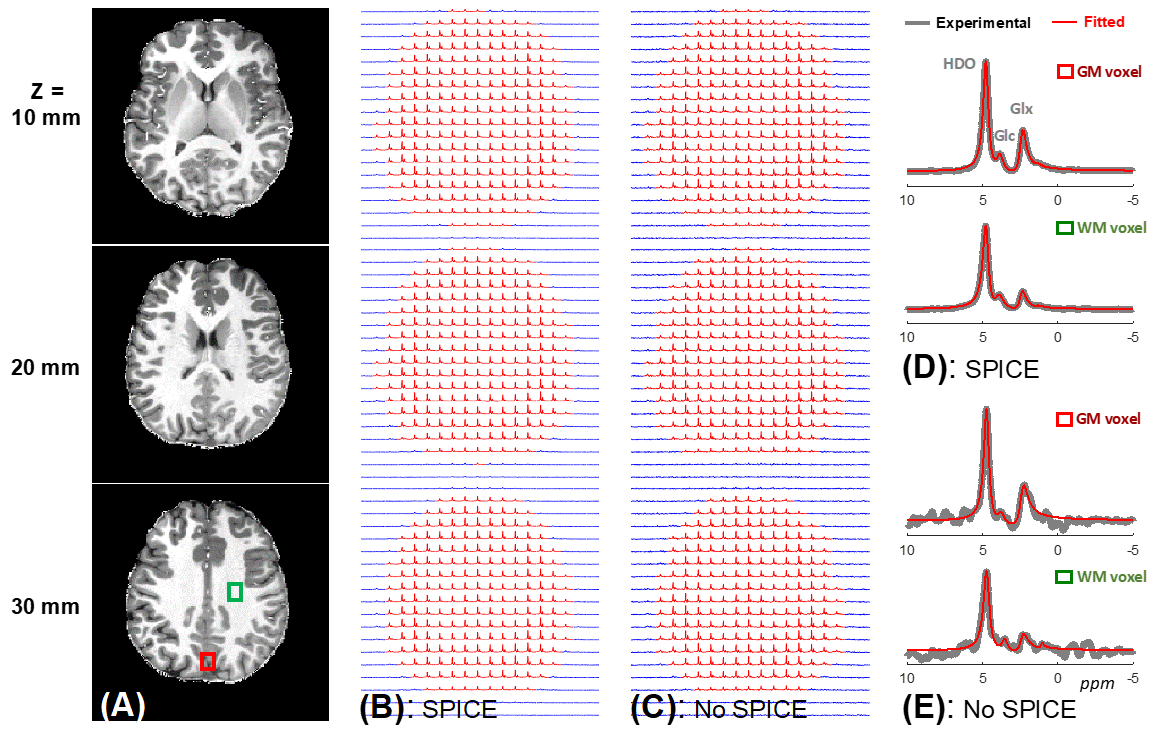
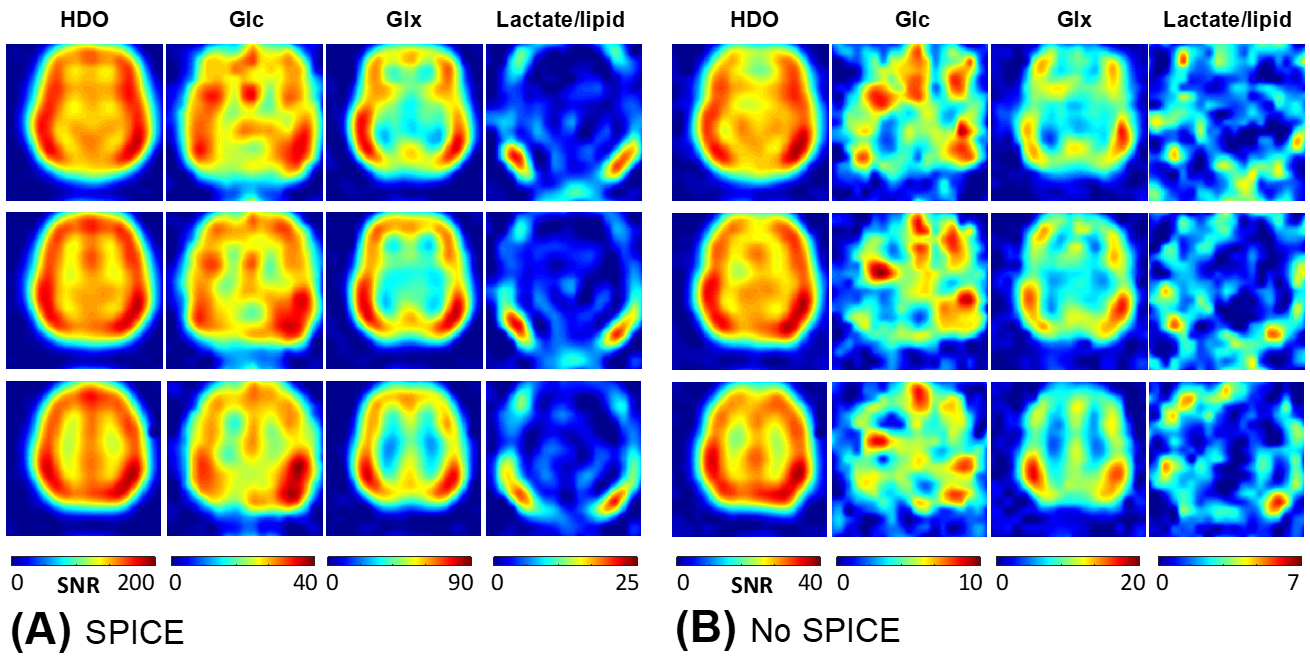
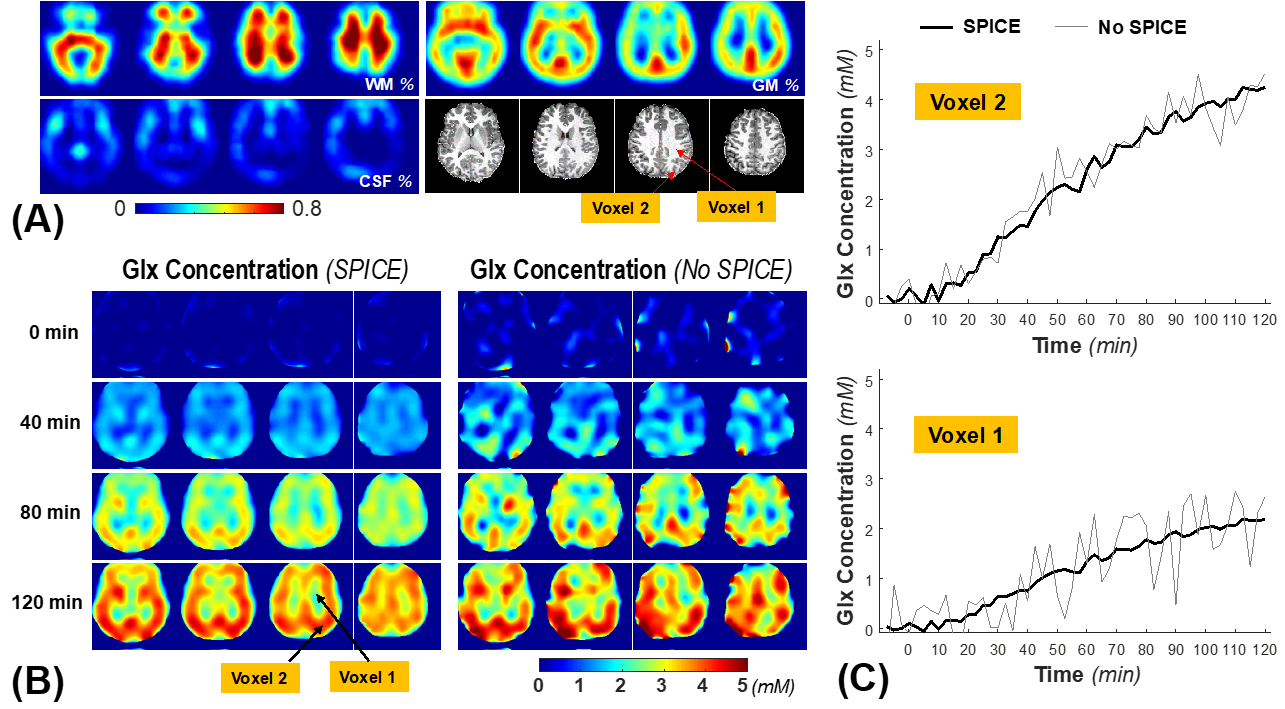
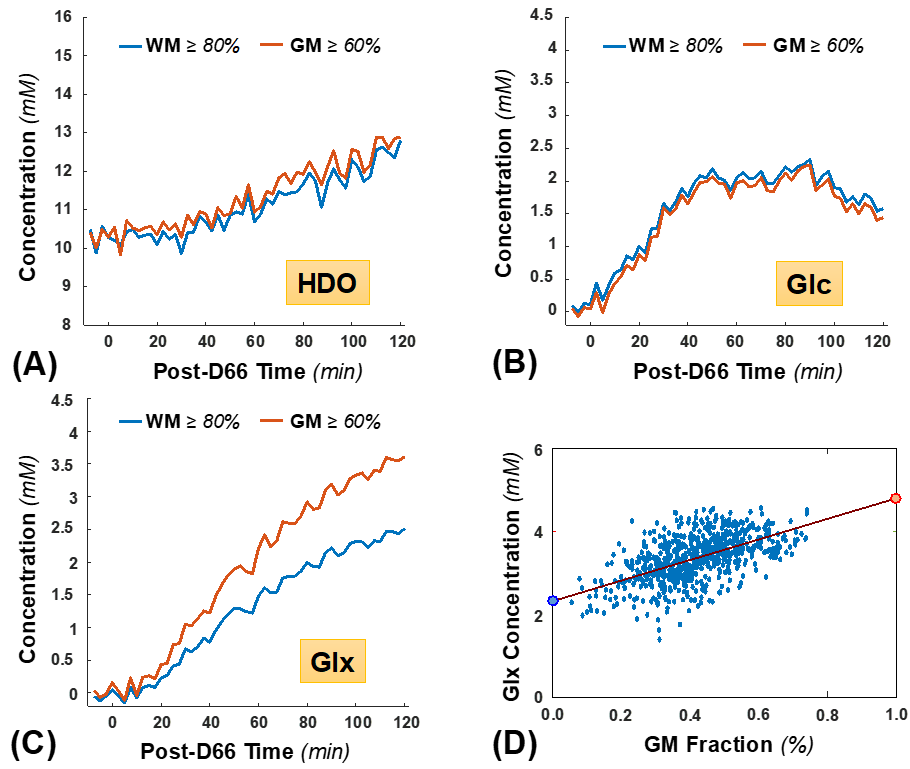
Figure 1 displays one slice of 3D-CSI data with (Fig. 1B) and without (Fig. 1C) applying the SPICE at 2 hours post-D66 intake, and the corresponding 2H spectra from two representative voxels located in GM and WM areas (Fig. 1D), respectively. Figure 2 shows the signal-to-noise ratio (SNR) maps of brain HDO and deuterated metabolites generated with (Fig. 2A) and without (Fig. 2B) applying the SPICE method. The SPICE denoising improved the SNR by several times, provided outstanding images of HDO, Glc and Glx with very high-spatiotemporal resolution (0.7 cc and 2.5 min) from the entire human brain at 7T.Figure 3 presents the 1H structural and segmented images (Fig. 3A) and the dynamic Glx concentration maps (Fig. 3B) from a representative subject after the oral administration of D66 glucose, as well as the corresponding time courses from two GM and WM dominated voxels (Fig. 3C), with and without applying the SPICE, showing greatly improved map quality and largely reduced temporal fluctuation after SPICE processing. The whole brain metabolites time-courses in WM-dominated (WM≥80%) and GM-dominated (GM≥60%) tissues are shown in Fig. 4A-C. The Glx concentrations of all brain voxels at the end of 2-hour post-D66 scan were plotted against their GM fractions (Fig. 4D), indicating that the Glx content in pure GM was around 4.8 mM, about 2-times higher than that in pure WM (2.3 mM).
Discussion & Conclusion:
We found that the 4-channel head array coil 6 operated at the 2H frequency can significantly improve the SNR and imaging homogeneity across the human brain as compared to commonly used 8-channel 2H head array coil at ultrahigh-field (≥7T) 2,4. In addition, the SPICE offers 4-5 folds of SNR improvement. These technical advancements have made it possible to achieve the highest spatial (0.7 cc) and temporal (2.5 min) resolution to date for reliable mapping of deuterated metabolites and their dynamics throughout the human brain at 7T. This capability allows us to assess the metabolic dynamics of different tissue types with high spatial and temporal resolution. The concentration of deuterated glucose in GM was slightly below WM, indicating a higher glucose consumption in the GM. The concentration of Glx in pure GM is > 2 times higher than WM, clearly indicating a much higher TCA cycle activity in supporting intense neuronal activity and high ATP energy demand in the GM, consistent with previous studies 4,5,15. The superior sensitivity and resolution of DMRSI as demonstrated herein should be valuable for studying brain disorders, especially for imaging the Warburg effect in brain tumor and intra-tumor heterogeneity 8.Acknowledgements
Acknowledgements: This work was supported in part by NIH grants of R01 CA240953, U01 EB026978 and P41 EB027061.References
1 Lu, M., Zhu, X. H.,et al. Quantitative assessment of brain glucose metabolic rates using in vivo deuterium magnetic resonance spectroscopy. J Cereb Blood Flow Metab 37, 3518-3530, doi:10.1177/0271678x17706444 (2017).
2 Roig, E. S., De Feyter, H. M., et al. Deuterium metabolic imaging of the human brain in vivo at 7 T. Magnetic Resonance in Medicine, doi:10.1002/mrm.29439 (2022).
3 De Feyter, H. M., Behar, K. L., et al. Deuterium metabolic imaging (DMI) for MRI-based 3D mapping of metabolism in vivo. Science Advances 4, eaat7314, doi:10.1126/sciadv.aat7314 (2018).
4 Ruhm, L., Avdievich, N., et al. Deuterium metabolic imaging in the human brain at 9.4 Tesla with high spatial and temporal resolution. Neuroimage 244, 118639, doi:10.1016/j.neuroimage.2021.118639 (2021).
5 Zhu, X. H., Wiesner, H. M., et al. Differentiating TCA Cycle Activity of Gray and White Matter in Human Brain at 7T Using High Resolution Dynamic Deuterium MRS Imaging with SPICE. in Proc. Intl. Soc. Mag. Reson. Med. . 30, p. 4840 (2022).
6 Li, X., Waks, M., Wiesner, H. M., Soon, S. H., Zhu, X. H. & Chen, W. A multinuclear 4-channel 2H loop and 4-channel 1H microstrip array coil for human head MRS/MRI at 7T. in Proc. Intl. Soc. Mag. Reson. Med. . 30, p. (2022).
7 Lam, F. & Liang, Z. P. A subspace approach to high-resolution spectroscopic imaging. Magn Reson Med 71, 1349-1357, doi:10.1002/mrm.25168 (2014).
8 Li, Y., Zhao, Y., et al. Machine Learning-Enabled High-Resolution Dynamic Deuterium MR Spectroscopic Imaging. IEEE Trans Med Imaging 40, 3879-3890, doi:10.1109/TMI.2021.3101149 (2021).
9 Hendrich, K., Hu, X. P., et al. Spectroscopic Imaging of Circular Voxels with a Two-Dimensional Fourier-Series Window Technique. Journal of Magnetic Resonance, Series B 105, 225-232, doi:10.1006/jmrb.1994.1128 (1994).
10 Rodgers, C. T. & Robson, M. D. Receive array magnetic resonance spectroscopy: Whitened singular value decomposition (WSVD) gives optimal Bayesian solution. Magnetic Resonance in Medicine 63, 881-891, doi:10.1002/mrm.22230 (2010).
11 Bydder, M., Hamilton, G., et al. Optimal phased-array combination for spectroscopy. Magnetic Resonance Imaging 26, 847-850, doi:10.1016/j.mri.2008.01.050 (2008).
12 Vanhamme, L., van den Boogaart, A., et al. Improved Method for Accurate and Efficient Quantification of MRS Data with Use of Prior Knowledge. Journal of Magnetic Resonance 129, 35-43, doi:https://doi.org/10.1006/jmre.1997.1244 (1997).
13 Purvis, L. A. B., Clarke, W. T., et al. OXSA: An open-source magnetic resonance spectroscopy analysis toolbox in MATLAB. PLOS ONE 12, e0185356, doi:10.1371/journal.pone.0185356 (2017).
14 Jenkinson, M., Beckmann, C. F., et al. FSL. NeuroImage 62, 782-790, doi:10.1016/j.neuroimage.2011.09.015 (2012).
15 de Graaf, R. A., Pan, J. W., et al. Differentiation of glucose transport in human brain gray and white matter. J Cereb Blood Flow Metab 21, 483-492, doi:10.1097/00004647-200105000-00002 (2001).
Figures