3867
2H MR measurement of amino acid uptake in glioblastoma multiforme1School of Biological and Health Systems Engineering, Arizona State University, Tempe, AZ, United States, 2Department of Radiology, Washington University in St.Louis, St.Louis, MO, United States, 3Department of Chemistry, Washington University in St.Louis, St.Louis, MO, United States, 4Department of Internal Medicine, Washington University in St.Louis, St.Louis, MO, United States, 5Alvin J. Siteman Cancer Center, Washington University School of Medicine in St.Louis, St.Louis, MO, United States
Synopsis
Keywords: Deuterium, Tumor, Amino Acid
Glioblastoma (GBM) brain tumors are among the most lethal of all human cancers, with a median survival of ~15 months. Standard-of-care radiologic methods fail to detect infiltrating GBM, which leads to undertreatment. We report a 2H MR method to better resolve/characterize GBM based on its enhanced uptake of branched-chain amino acids (e.g., leucine). We measure relaxation time constants for deuterated leucine in agarose phantoms and show the ability to detect d10-leucine at ~200 mM in a 4x4x4 mm3 voxel in phantoms. Finally, we demonstrated 2H MR measurement of enhanced deuterated leucine uptake in a rodent model of GBM.
Introduction
Glioblastoma (GBM) brain tumors are among the most lethal of all human cancers.1 GBM diagnosis and staging rely on contrast-enhanced (CE) MRI to identify tumor-associated blood brain barrier (BBB) disruption; however, infiltrating tumor cells extend beyond the boundaries of BBB disruption. Consequently, the tumor periphery is invisible on CE-MRI, leading to undertreatment and greater incidence of recurrence.2,3GBM cells upregulate expression of amino acid (AA) transporters; thus, these cells can be detected via positron emission tomography (PET) using radio-labeled amino-acid tracers.4-8 However, AA-PET has two major drawbacks: First, it does not resolve AA metabolism, which is a critical biomarker of GBM malignancy.6,7,9 Second, access to AA-PET in the US is severely limited by geographic location, cost, and FDA approval. A method to map AA uptake and metabolism in GBM that has the accessibility of CE-MRI would be a significant advance.
Recent work shows that, by replacing hydrogen with deuterium on glucose, one can quantify its uptake and metabolism with deuterium (2H) MR.10,11 Similarly, we hypothesize that the enhanced uptake and metabolism of deuterated AAs in GBM can be measured with 2H MR. Here, we demonstrate the 2H AA-MR concept in rodent models of GBM.
Methods
Deuterated leucine phantom experiments: Phantom preparation: A series of d10-leucine phantoms spanning a concentration range of ~200 mM to 20 mM in low melting point agarose were prepared in 1.5 mL centrifuge tubes. T1 quantification: An inversion recovery experiment was used to quantify the T1 of the (-CD3)2, -CD2, gamma-D, alpha-D, and HOD resonances; TR=2500 ms, 40 exponentially-spaced inversion times ranging from 0.02 to 2 s.T2 quantification: A CPMG experiment was used to quantify T2 of the resonances identified above: TR = 2500 ms, 40 exponentially-spaced echo times ranging from 0.005 to 0.75 s. Detectability studies: 2H SPin-ECho full-Intensity Acquired Localized (SPECIAL) spectroscopy experiments were performed using 4 x 4 x 4 mm3 voxels and TR/TE = 250/4.27 ms.In vivo 2H-AA MR: Animal preparation: The efficacy of 2H-AA MR was demonstrated in GL261-tumor bearing mice, following either i.v. and i.p. injection of d10-leucine. GL261 cells (50k cells) were injected into the dorsal striatum using a stereotactic apparatus. Dosing schemes were as follows: Three i.v. bolus injections of 300 mL of 100 mM d10-leucine in saline (pH, ~7; total dose = 12 mg/100 g) or one i. p. bolus injection of 900 mL of this same solution. Animals were allowed to recover for one hour prior to MR spectroscopy. In vivo 2H MRS: Three serial 2H SPECIAL spectra (15 min of data acquisition each) were collected in vivo: TR/TE = 250/4.27ms; 3600 averages, each.
Data analysis. Bayesian probability theory-based signal modeling was used to estimate MRS resonance frequencies and amplitudes, and relaxation rate constants. Deuterated leucine concentrations were referenced to the endogenous HOD resonance.
Results
Leucine-associated resonances and their T1 and T2 relaxation time constants are summarized in Figure 1. These values were used to optimize subsequent in vitro and in vivo detectability experiments. Detectability at various concentrations was tested; as little as ~200 mM of d10-leucine could be detected (SNR = 4.1) with a voxel size of 4 x 4 x 4 mm3 and a total scan time of 45 min (Fig. 2). In vivo deuterated leucine concentrations were ~2.4-fold higher in tumor compared to contralateral healthy-appearing brain (Fig. 3) and appeared stable over a period of 45 minutes post-injection (data not shown). These findings were consistent across both dosing schemes with measured tumoral concentrations of 1.35 ± 0.14 mM, 1.00 ± 0.08 mM, for the i.v.- and i.p.-injected GL261 mice, respectively (Fig. 4). Leucine-associated resonances were not detectable 24 hours post-injection (Fig. 5).Discussion and Conclusion
Herein, we demonstrate the first proof-of-principle data confirming that 2H MR can be used to measure enhanced AA uptake by GBM. Our data support the affinity of GBM to circulating leucine. Tumor concentrations of > 1 mM were achieved using doses of 12 mg/100 g. These preliminary data do not prove transporter-facilitated uptake of deuterated leucine into GBM cells (the subject of future investigation). However, the significant body of literature demonstrating enhanced LAT1 expression and AA uptake by GBM suggests this is the case. Interestingly, significant concentrations of deuterated leucine were also observed in healthy-appearing contralateral brain. Finally, we demonstrate enhanced uptake of deuterated leucine using two different dosing methods, with simple i.p. administration of deuterated leucine producing comparable results to the more difficult tail-vein i.v. injection. Future efforts will focus on histological validation of GBM internalization of deuterated leucine, dynamic mapping of leucine uptake by tumor, and quantification of GBM metabolism of leucine into downstream products.Acknowledgements
None
References
1. Stupp R, Mason WP, van den Bent MJ, et al. Radiotherapy plus Concomitant and Adjuvant Temozolomide for Glioblastoma. New England Journal of Medicine 2005;352:987–996 doi: 10.1056/NEJMoa043330. 2. Langen K-J, Galldiks N, Hattingen E, Shah NJ. Advances in neuro-oncology imaging. Nat Rev Neurol 2017;13:279–289 doi: 10.1038/nrneurol.2017.44. 3. Hu LS, Hawkins-Daarud A, Wang L, Li J, Swanson KR. Imaging of intratumoral heterogeneity in high-grade glioma. Cancer Lett 2020;477:97–106 doi: 10.1016/j.canlet.2020.02.025. 4. Okubo S, Zhen H-N, Kawai N, Nishiyama Y, Haba R, Tamiya T. Correlation of L-methyl-11C-methionine (MET) uptake with L-type amino acid transporter 1 in human gliomas. J Neurooncol 2010;99:217–225 doi: 10.1007/s11060-010-0117-9. 5. Salisbury TB, Arthur S. The Regulation and Function of the L-Type Amino Acid Transporter 1 (LAT1) in Cancer. Int J Mol Sci 2018;19 doi: 10.3390/ijms19082373. 6. Suh EH, Hackett EP, Wynn RM, et al. In vivo assessment of increased oxidation of branched-chain amino acids in glioblastoma. Scientific Reports 2019;9:340 doi: 10.1038/s41598-018-37390-0. 7. Tönjes M, Barbus S, Park YJ, et al. BCAT1 promotes cell proliferation through amino acid catabolism in gliomas carrying wild-type IDH1. Nat Med 2013;19:901–908 doi: 10.1038/nm.3217. 8. Galldiks N, Langen KJ. Amino Acid PET - An Imaging Option to Identify Treatment Response, Posttherapeutic Effects, and Tumor Recurrence? Front Neurol 2016;7:120. DOI: 10.3389/fneur.2016.00120 9. Venneti S, Dunphy MP, Zhang H, et al. Glutamine-based PET imaging facilitates enhanced metabolic evaluation of gliomas in vivo. Sci Transl Med 2015;7:274ra17 doi: 10.1126/scitranslmed.aaa1009. 10. De Feyter HM, Behar KL, Corbin ZA, et al. Deuterium metabolic imaging (DMI) for MRI-based 3D mapping of metabolism in vivo. Sci. Adv. 2018;4:eaat7314 doi: 10.1126/sciadv.aat7314. 11. Kreis F, Wright AJ, Hesse F, Fala M, Hu D, Brindle KM. Measuring Tumor Glycolytic Flux in Vivo by Using Fast Deuterium MRI. Radiology 2020;294:8.doi: 10.1148/radiol.2019191242
Figures
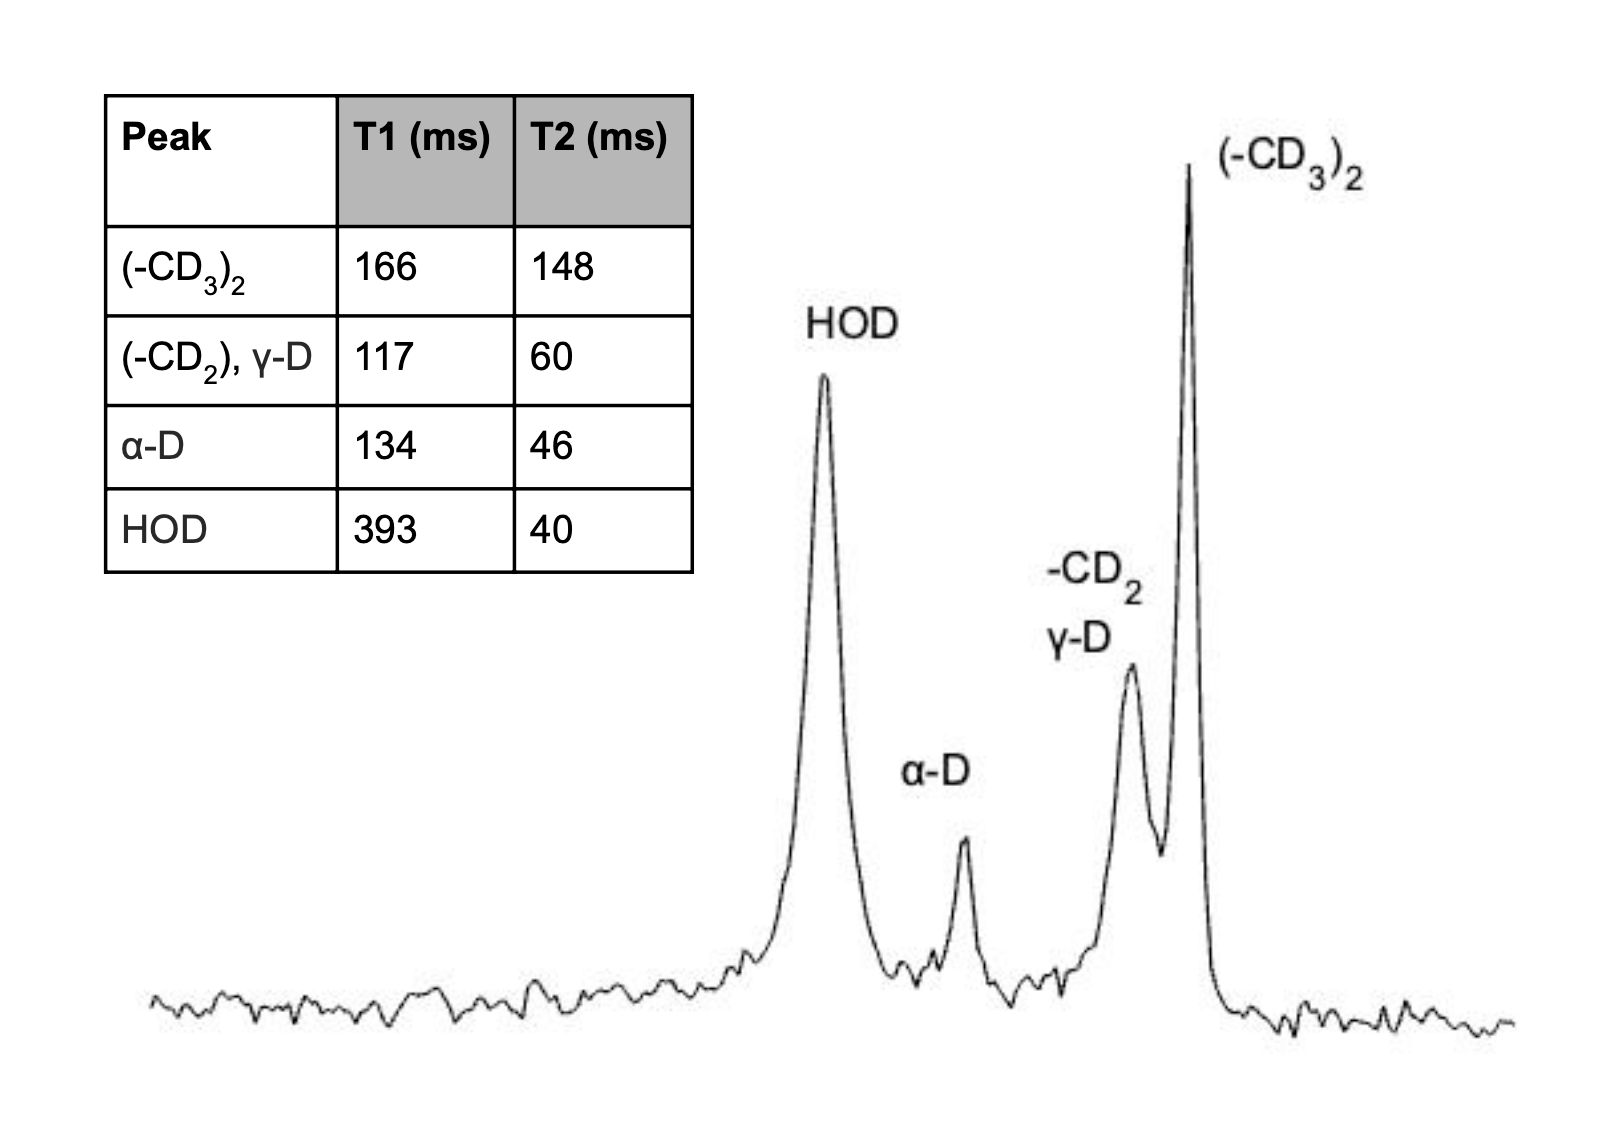
Figure 1: SPECIAL 2H MR spectrum (4 x 4 x 4 mm3 voxel) of ~20 mM deuterated leucine phantom in 2% agarose obtained at 11.7T with 5Hz line broadening. (The HOD resonance was enhanced with addition of HOD to phantom.) Measured T1 and T2 values are tabulated in the insert in the upper left of the figure.
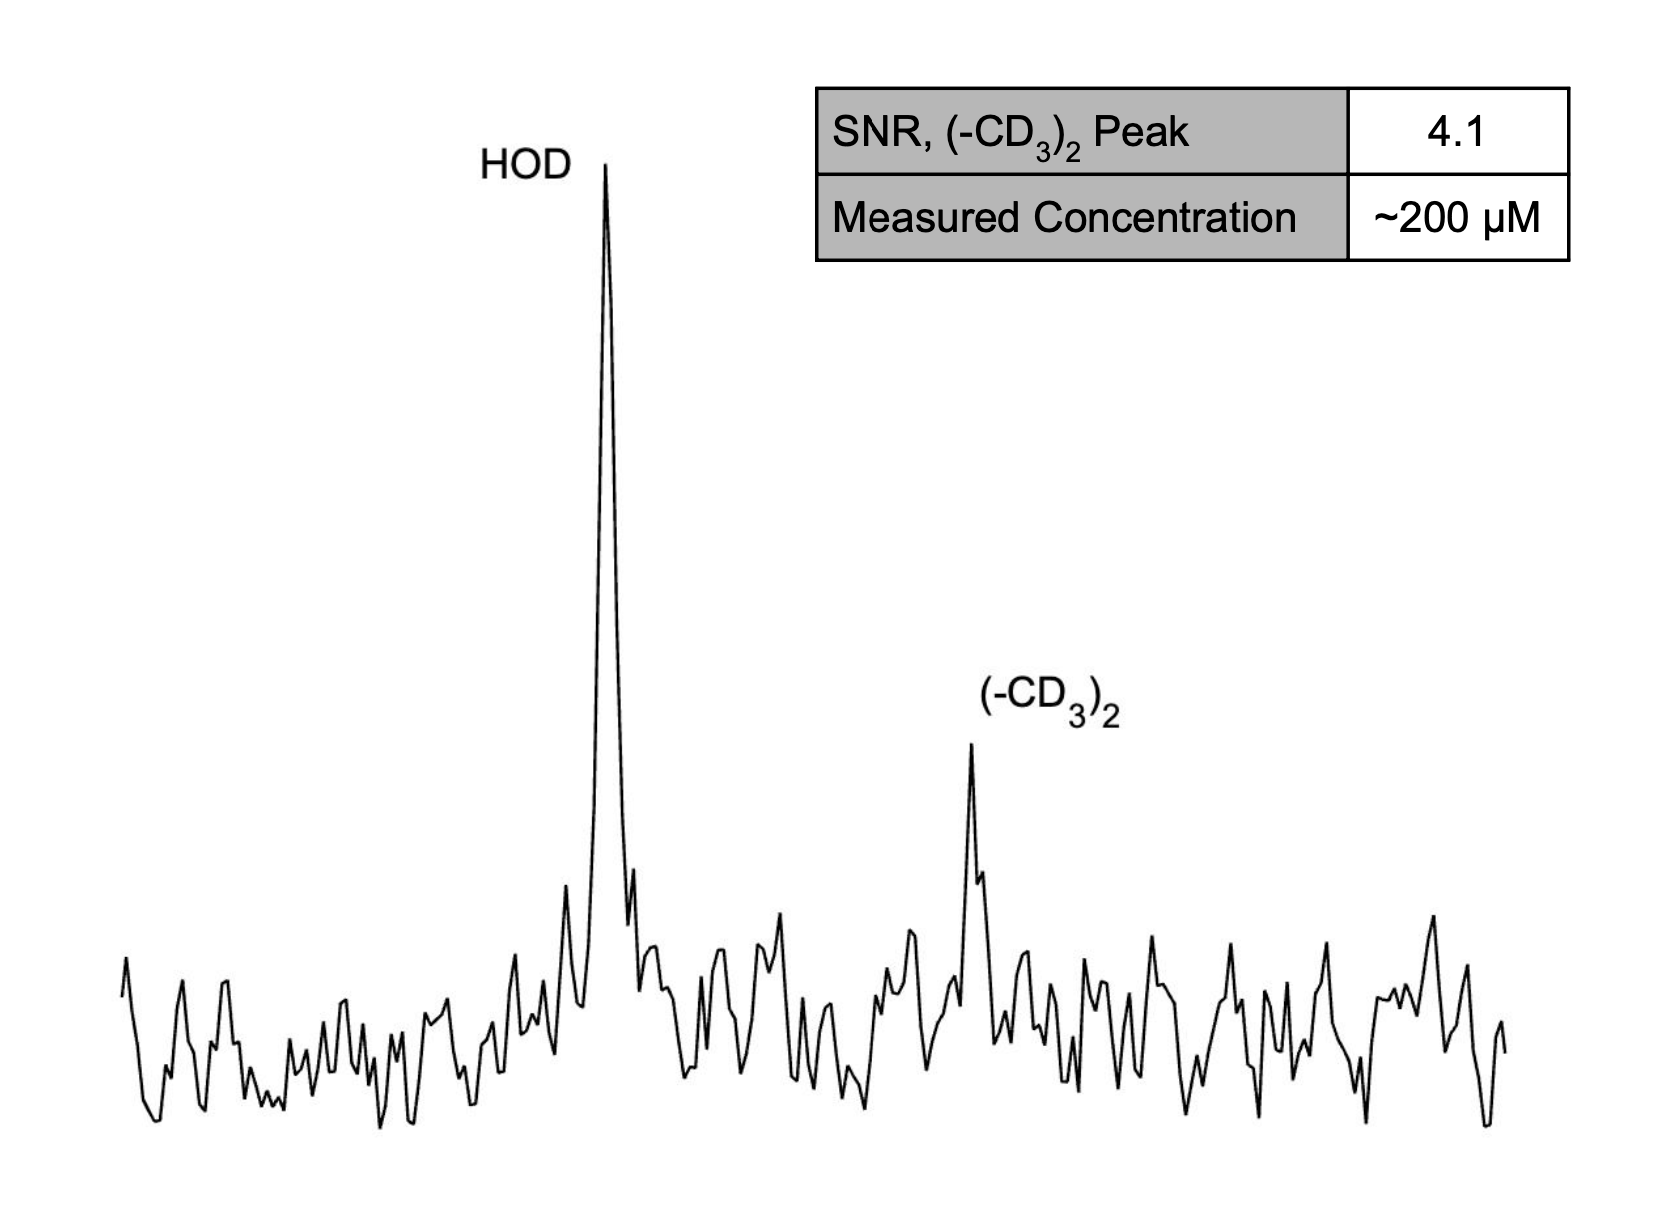
Figure 2: SPECIAL 2H MR spectrum (4 x 4 x 4 mm3 voxel) of ~200 mM deuterated leucine phantom in 2% agarose showing detectability of the (CD3)2 peak with an SNR of 4.1. Total acquisition time = 45 minutes; lb=5 Hz.
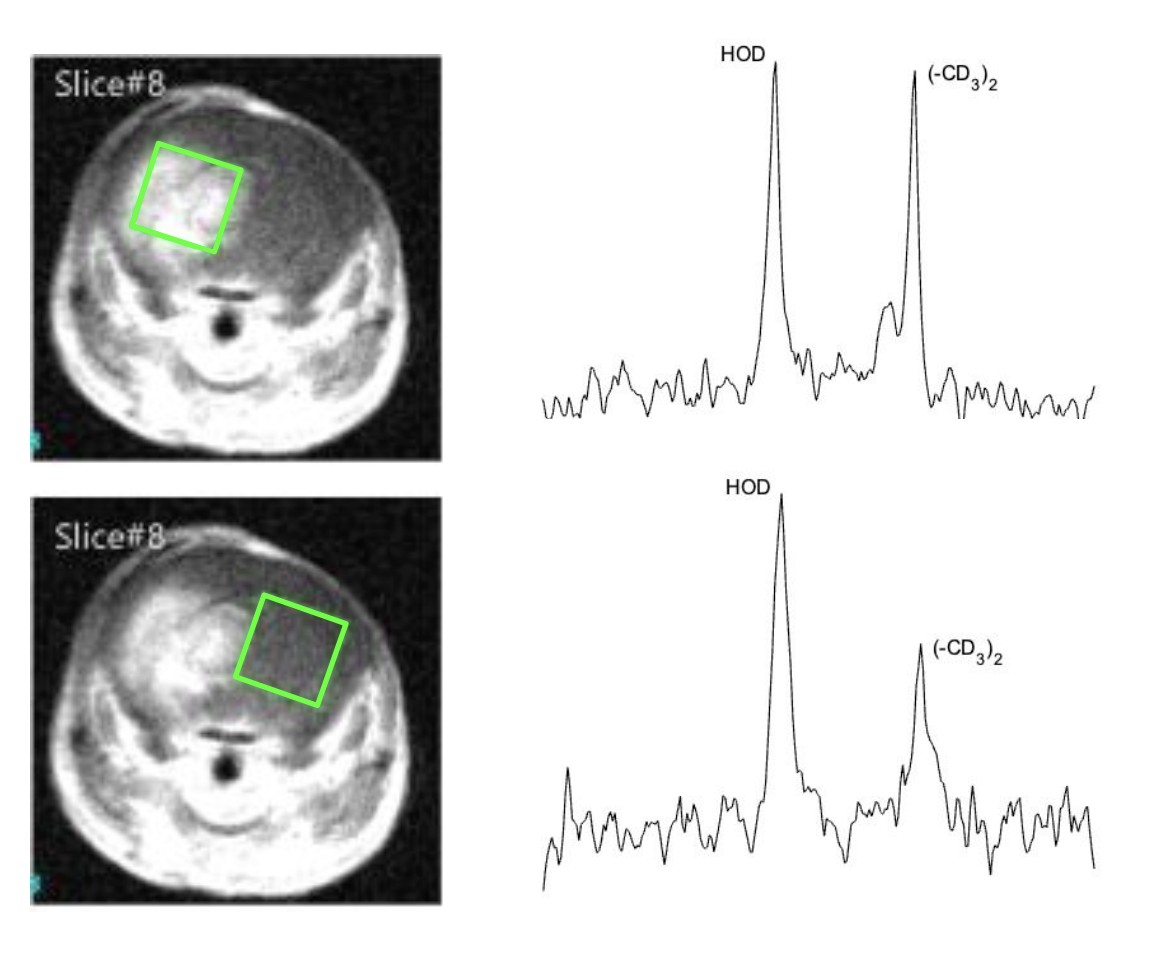
Figure 3: Exemplar SPECIAL 2H MR d10-leucine spectra (3.5 x 3.5 x 4 mm3 voxels) acquired from tumor and normal-appearing brain. 15-minute spectra were acquired ~1 hour and 24 hours (tumor only) after i.v. injection of d10-leucine (lb = 5 Hz).
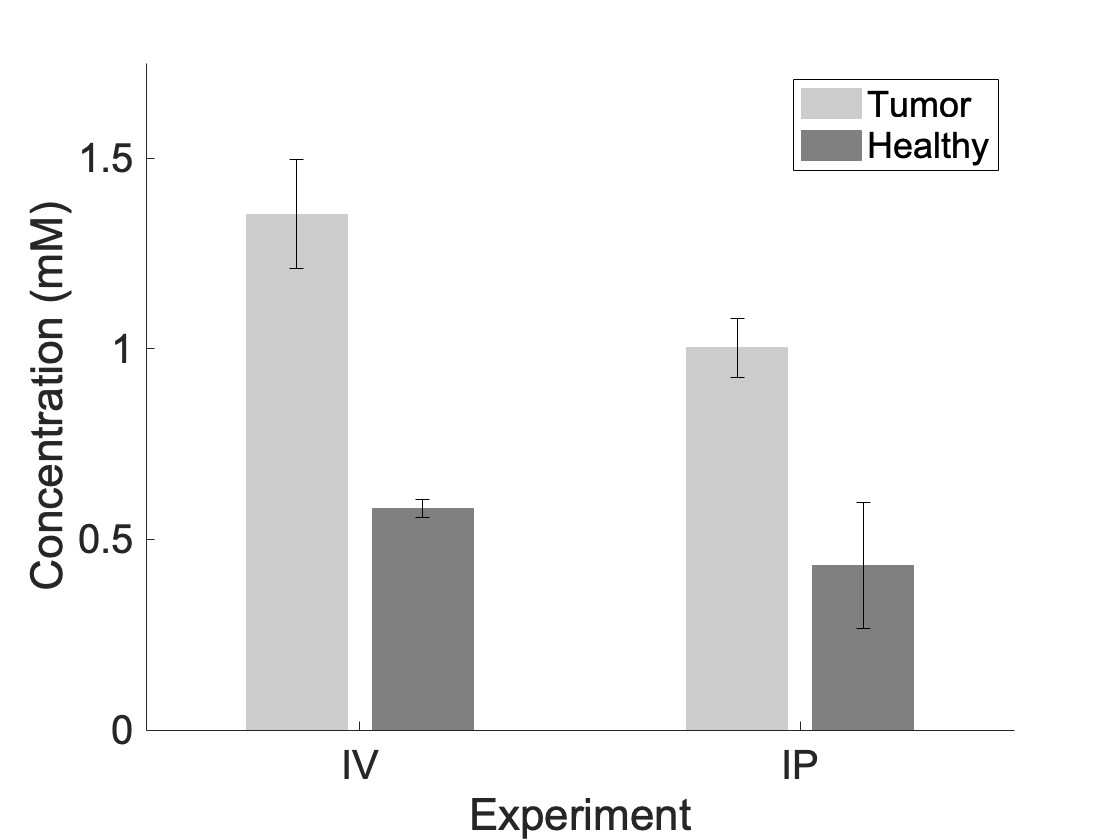
Figure 4: SPECIAL 2H MR-measured in vivo concentrations of d10-leucine following i.v. or i.p. leucine administration.
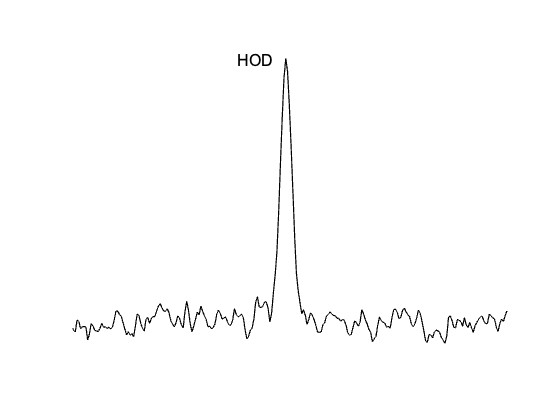
Figure 5: SPECIAL 2H MR d10-leucine spectrum (3.5 x 3.5 x 4 mm3 voxels) acquired from tumor region 24 hours after i.v. injection of d10-leucine (lb = 5 Hz).