3866
Cerebral glucose quantification using 1H short-TE STEAM spectroscopy at 7T: Influence of macromolecule signals
Hideto Kuribayashi1, Yuta Urushibata1, Thuy Ha Duy Dinh2, Hirohiko Imai3, Sinyeob Ahn4, Ravi Teja Seethamraju5, Tadashi Isa2, and Tomohisa Okada2
1Siemens Healthcare K.K., Tokyo, Japan, 2Human Brain Research Center, Kyoto University Graduate School of Medicine, Kyoto, Japan, 3Kyoto U Graduate School of Informatics, Kyoto, Japan, 4Siemens Medical Solutions, Berkeley, CA, United States, 5Siemens Medical Solutions, Boston, MA, United States
1Siemens Healthcare K.K., Tokyo, Japan, 2Human Brain Research Center, Kyoto University Graduate School of Medicine, Kyoto, Japan, 3Kyoto U Graduate School of Informatics, Kyoto, Japan, 4Siemens Medical Solutions, Berkeley, CA, United States, 5Siemens Medical Solutions, Boston, MA, United States
Synopsis
Keywords: Spectroscopy, Neuro, glucose
The ability of conventional 1H short-TE STEAM spectroscopy at 7T was investigated to quantitate cerebral glucose. Spectra were analyzed using LCModel with the standard 7T STEAM basis set and with that plus macromolecule basis set. With the evaluation of Cramér-Rao lower bounds, the precision of glucose quantification reduced with the macromolecule basis set. Moreover, estimated glucose and taurine concentrations were shown to correlate for both analytical conditions. Thus, the quantification is not improved using the macromolecule basis set and may be more precise via detecting H1-α-glucose, which is free from spectral overlap.Introduction
Glucose is an important energy source in the brain and detectable using 1H MRS non-invasively. However, the 1H MRS studies of cerebral glucose have been rarely reported due to low sensitivity of the signals, which are split with J-couplings and separated with its anomeric configurations. Moreover, the glucose signals in the chemical shift range of 3.2-4.0 ppm are overlapped with the signals of neurochemicals and macromolecules (MMs). The separation of MM signals may improve accurate determination of cerebral glucose concentration. In this study, we investigated the ability of a conventional 1H short-TE STEAM spectroscopy at 7T to quantitate cerebral glucose and the influence of the MM signals. In addition, the quantitative methodologies were compared by means of detecting H1-α-glucose peaks at 5.23 ppm1-3.Methods
This study was approved by an institutional review board, and written informed consent was obtained from subjects. MM basis set for LCModel (version 6.3-1L, LA Systems, Tokyo, Japan) was generated in-house to analyze short-TE STEAM spectra, which had been acquired at the posterior cingulate cortex (27-mL volume) with TR/TE/TM = 5700-7280/5/45 ms at 7T for our former study3. The eighteen healthy subjects (aged 20-30 years old) were scanned on an investigational whole-body 7T MR system (MAGNETOM 7T, Siemens Healthineers, Erlangen, Germany). A single-channel transmit, and 32-channel receive head coil (Nova Medical, MA, USA) was used. MM spectra were acquired at the posterior cingulate cortex using inversion-recovery (IR) short-TE STEAM (research application, TR/TI/TE/TM = 8000/950/5/45 ms, signal average = 192, scan time = 26 min)4 with VAPOR water suppression and outer volume suppression. B0 shimming was achieved using FASTESTMAP (research application)5. Water spectra in the MRS voxels were acquired too for eddy current correction6. The following spectral analysis was performed on MATLAB (MathWorks, MA, USA). The IR short-TE STEAM spectra were fit with fifteen pseudo-Voigt functions at known chemical shifts of MMs and lipids7 in the range of 0.9-4.0 ppm. An MM basis spectrum was constructed as the sum of the fits and the baseline. Each MM basis spectrum was averaged among the subjects to generate the MM basis set for LCModel.The twenty short-TE STEAM spectra in the range of 0.2-4.0 ppm were analyzed using the standard STEAM basis set for 7T without the prior knowledge about the intensity ratio between glucose and the three big methyl peaks at 2,0. 3.0 and 3.2 ppm8. The spectra were analyzed using the basis set with adding the MM basis set too. The precision of quantification was evaluated using Cramér-Rao lower bounds (CRLBs, %SD). Estimated concentrations were corrected with water-scaling for the corresponding MRS voxels9-10 and with an institutional calibration factor for the sequence tested using an 1 % agar gel phantom containing 5 mM creatine monohydrate. The spectral overlap between metabolite signals was quantified using LCModel correlation coefficient, and the value less than -0.3 was considered as to be difficult to quantitate the two metabolites separately11. The measures were compared with those quantitated via H1-α-glucose peaks3. Welch’s t-test was performed, and a P < 0.05 was considered statistically significant.
Results
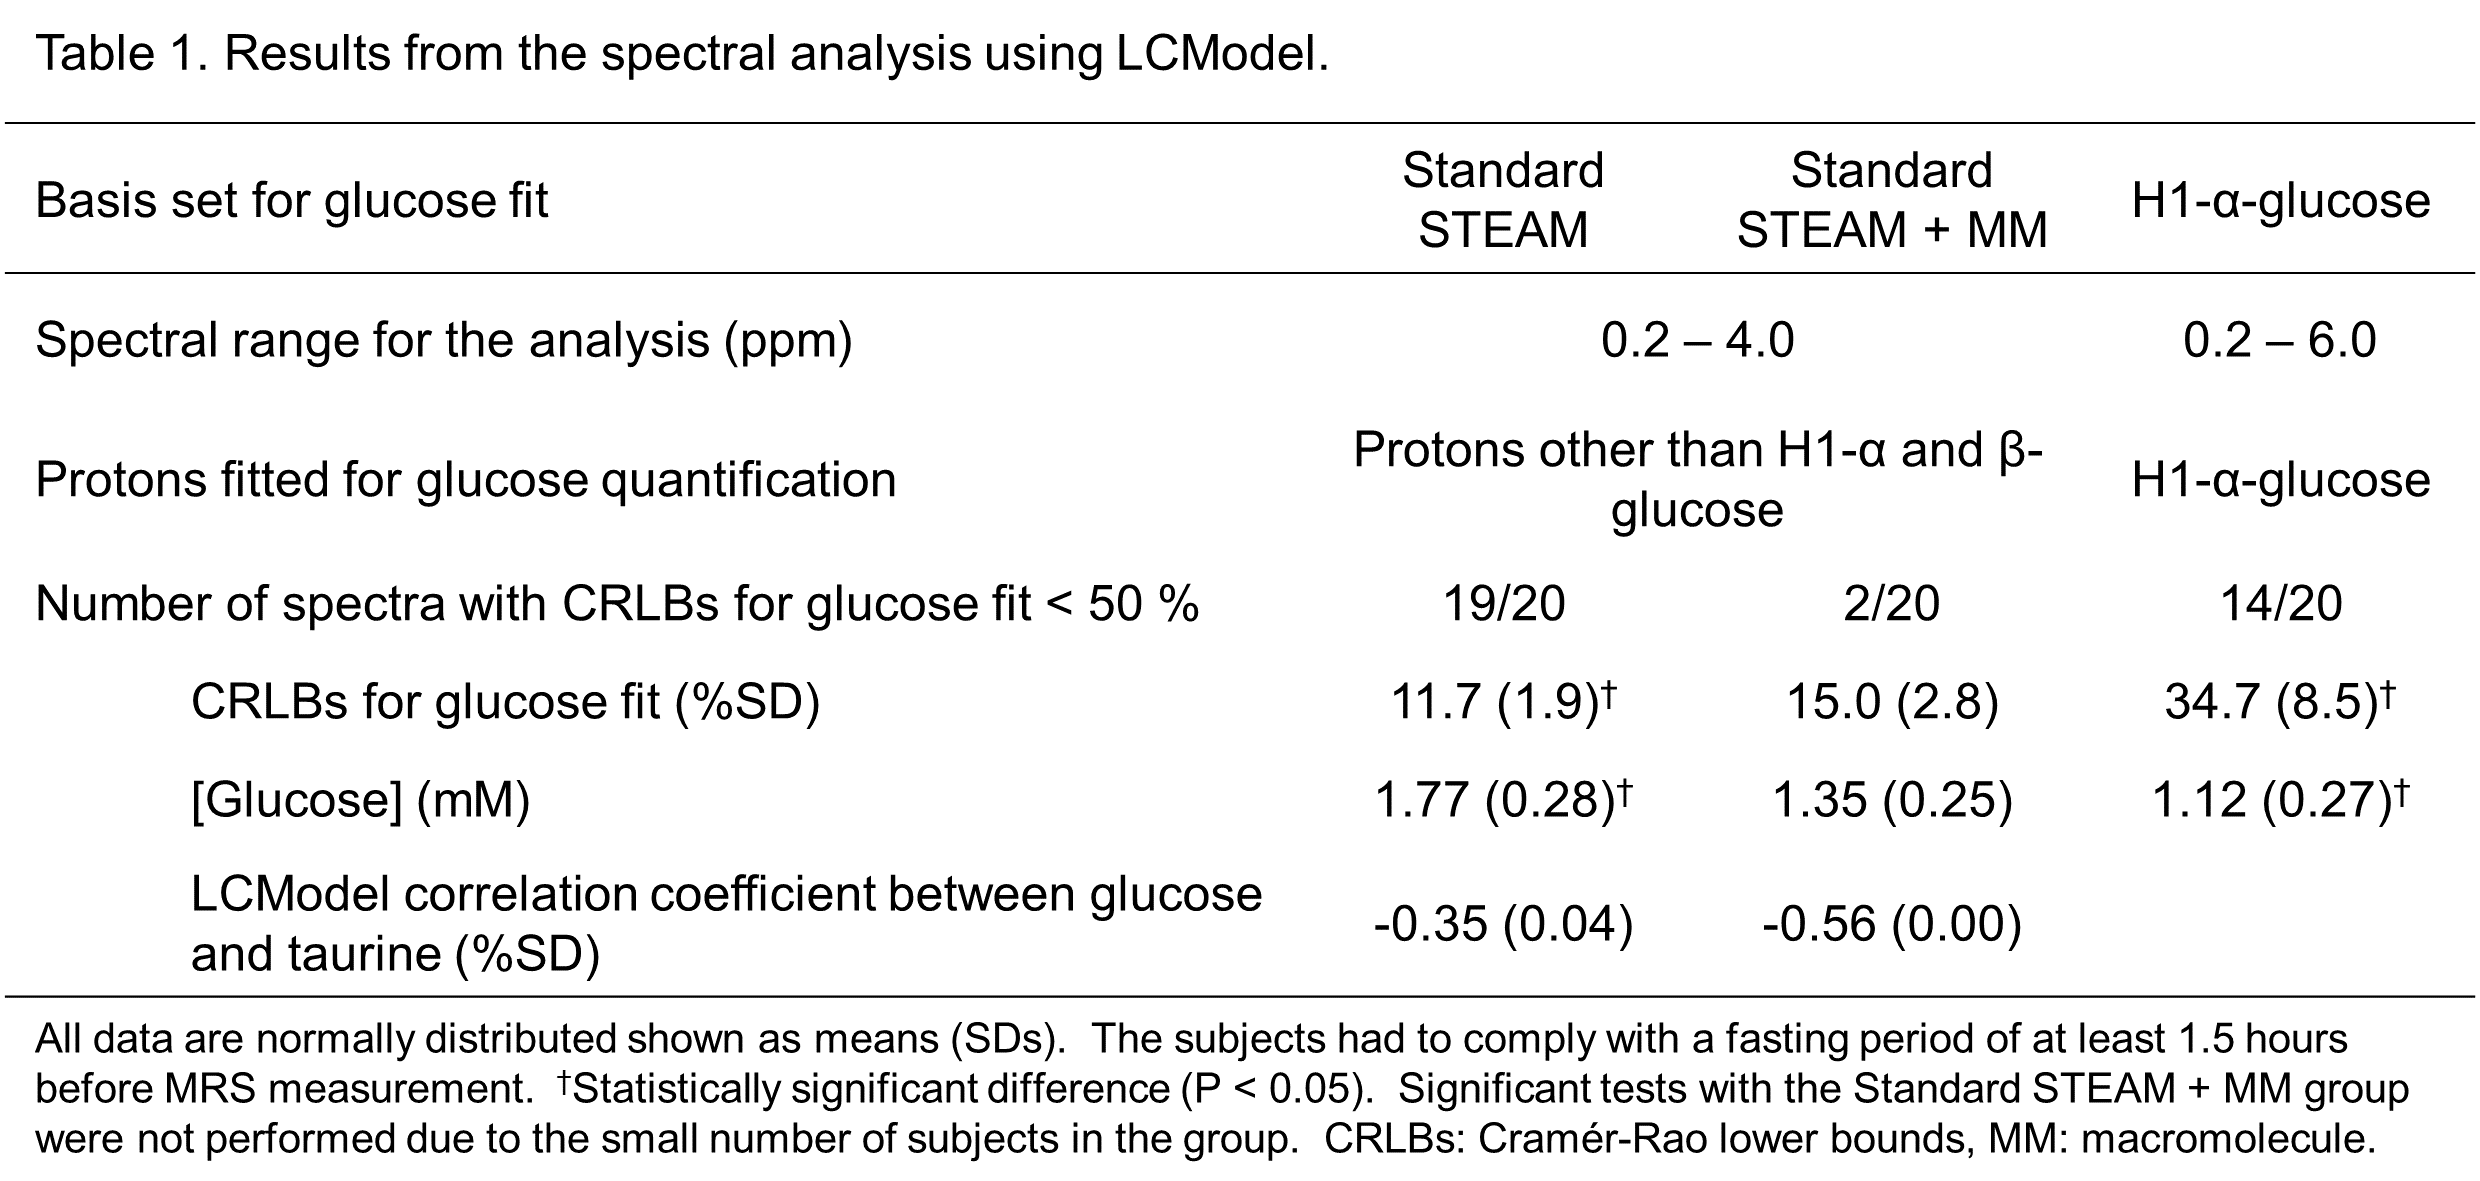
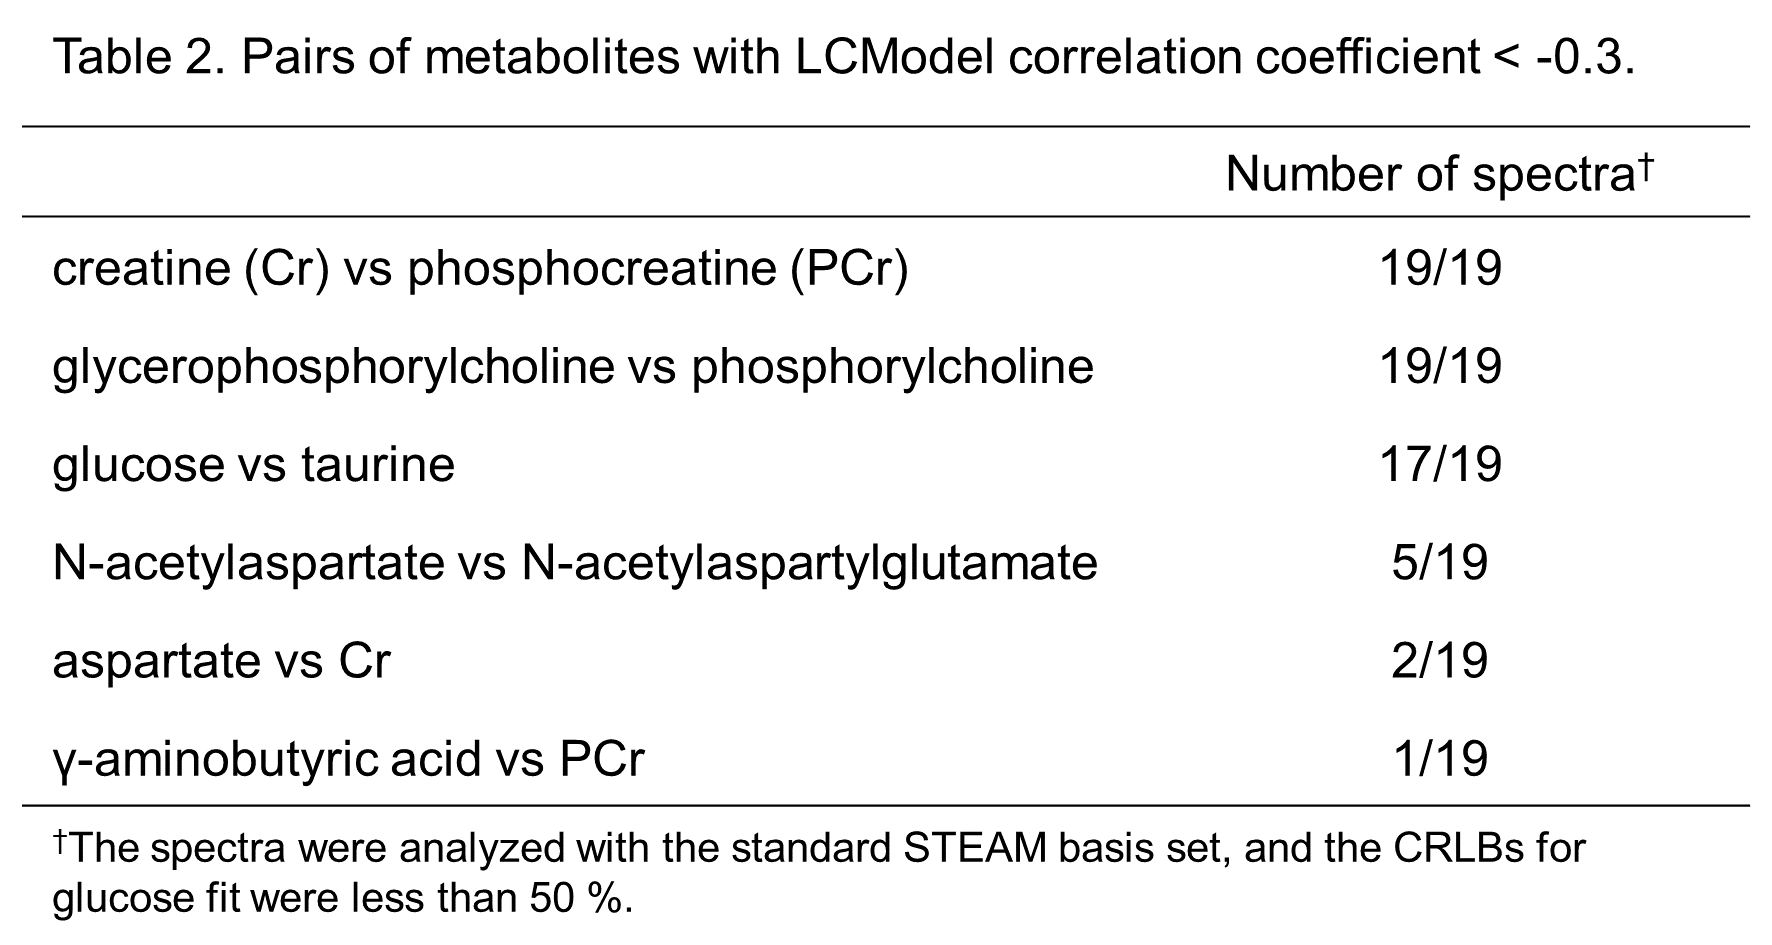
Numerical results are summarized in Table 1. Using the MM basis set, the number of spectra, which were analyzed with the CRLBs for glucose fit less than 50 %, dramatically reduced from nineteen to two. In the two cases, the estimated glucose concentrations were the 1st and the 2nd highest in the spectra analyzed without the MM basis set and quantitated via the H1-α-glucose peaks. The glucose concentrations analyzed in the range of 0.2-4.0 ppm were higher than those quantitated via the H1-α-glucose peaks.Metabolite pairs with LCModel correlation coefficients less than -0.3 in the spectra analyzed with the standard STEAM basis set are listed in Table 2. The values between glucose and taurine were much more negative in the spectra analyzed with the MM basis set than those without the MM basis set. As shown in Figure 1, the signals of glucose and taurine show similar spectral patterns in the range of 3.2-3.5 ppm. The spectral baselines analyzed without the MM basis set (top in Figure 1) are depressed at 3.4 ppm. None of the metabolites showed a correlation with glucose concentration quantitated via the H1-α-glucose peaks.
Discussion
With the evaluation of the CRLBs, cerebral glucose is quantitated precisely using the conventional 1H short-TE STEAM spectroscopy at 7T analyzed using the standard STEAM basis set. The results are presumed to be overestimated due to the observed baseline depression around the chemical shift where the signals of glucose and taurine are overlapped. It is suggested that the MM basis set suppressed the overestimation of glucose as shown in the reduction of estimated glucose concentrations in the two cases. However, the MM basis set made the separate quantification of glucose from taurine more difficult and deteriorated the quantification of glucose concentration for the other cases.Conclusion
Cerebral glucose quantification did not improve using the conventional 1H short-TE STEAM spectroscopy in combination with LCModel with the MM basis set and may be more precise via detecting H1-α-glucose, which is free from spectral overlap.Acknowledgements
The authors thank Dr. Gerald R Moran (Siemens Healthcare Canada) to provide the research application of FASTESTMAP sequence.References
- Gruetter R, Garwood M, Ugurbil K, et al. Observation of resolved glucose signals in 1H NMR spectra of the human brain at 4T. Magn Reson Med 1996;36:1-6.
- Mangia S, Kumar AF, Moheet AA et al. Neurochemical profile of patients with type 1 diabetes measured by 1H-MRS at 4T. J Cereb Blood Flow Metab 2013;33:754-759.
- Kuribayashi H, Urushibata Y, Dinh THD et al. Baseline Correction of 1H MRS for Cerebral Glucose Quantification via detecting H1-α-Glucose peak at 7 T. ISMRM 2022 p. 4365.
- Schaller B, Xin L, Gruetter R. Is the Macromolecule Signal Tissue-Specific in Healthy Human Brain? A 1H MRS Study at 7 Tesla in the Occipital Lobe. Magn Reson Med 2014;72:934-940.
- Gruetter R, Tkac I. Field mapping without reference scan using symmetric echo-planar technique. Magn Reson Med 2000;43:319-323.
- Klose U. In vivo proton spectroscopy in presence of eddy currents. Magn Reson Med 1990;14:26-30.
- Birch R, Peet AC, Dehghani H et al. Influence of Macromolecule Baseline on 1H MR Spectroscopic Imaging Reproducibility. Magn Reson Med 2017;77:34-43.
- Provencher S. In: LCModel & LCMgui User’s manual: 2021, p. 144.
- Provencher S. In: LCModel & LCMgui User’s manual: 2021, p. 129.
- Gasparovic C, Song T, Devier D, et al. Use of tissue water as a concentration reference for proton spectroscopic imaging. Magn Reson Med 2006;55:1219-1226.
- Provencher S. In: LCModel & LCMgui User's manual: 2021, p. 150.
Figures
Table
1. Results from the spectral analysis
using LCModel.
Table
2. Pairs of metabolites with LCModel
correlation coefficient < -0.3.
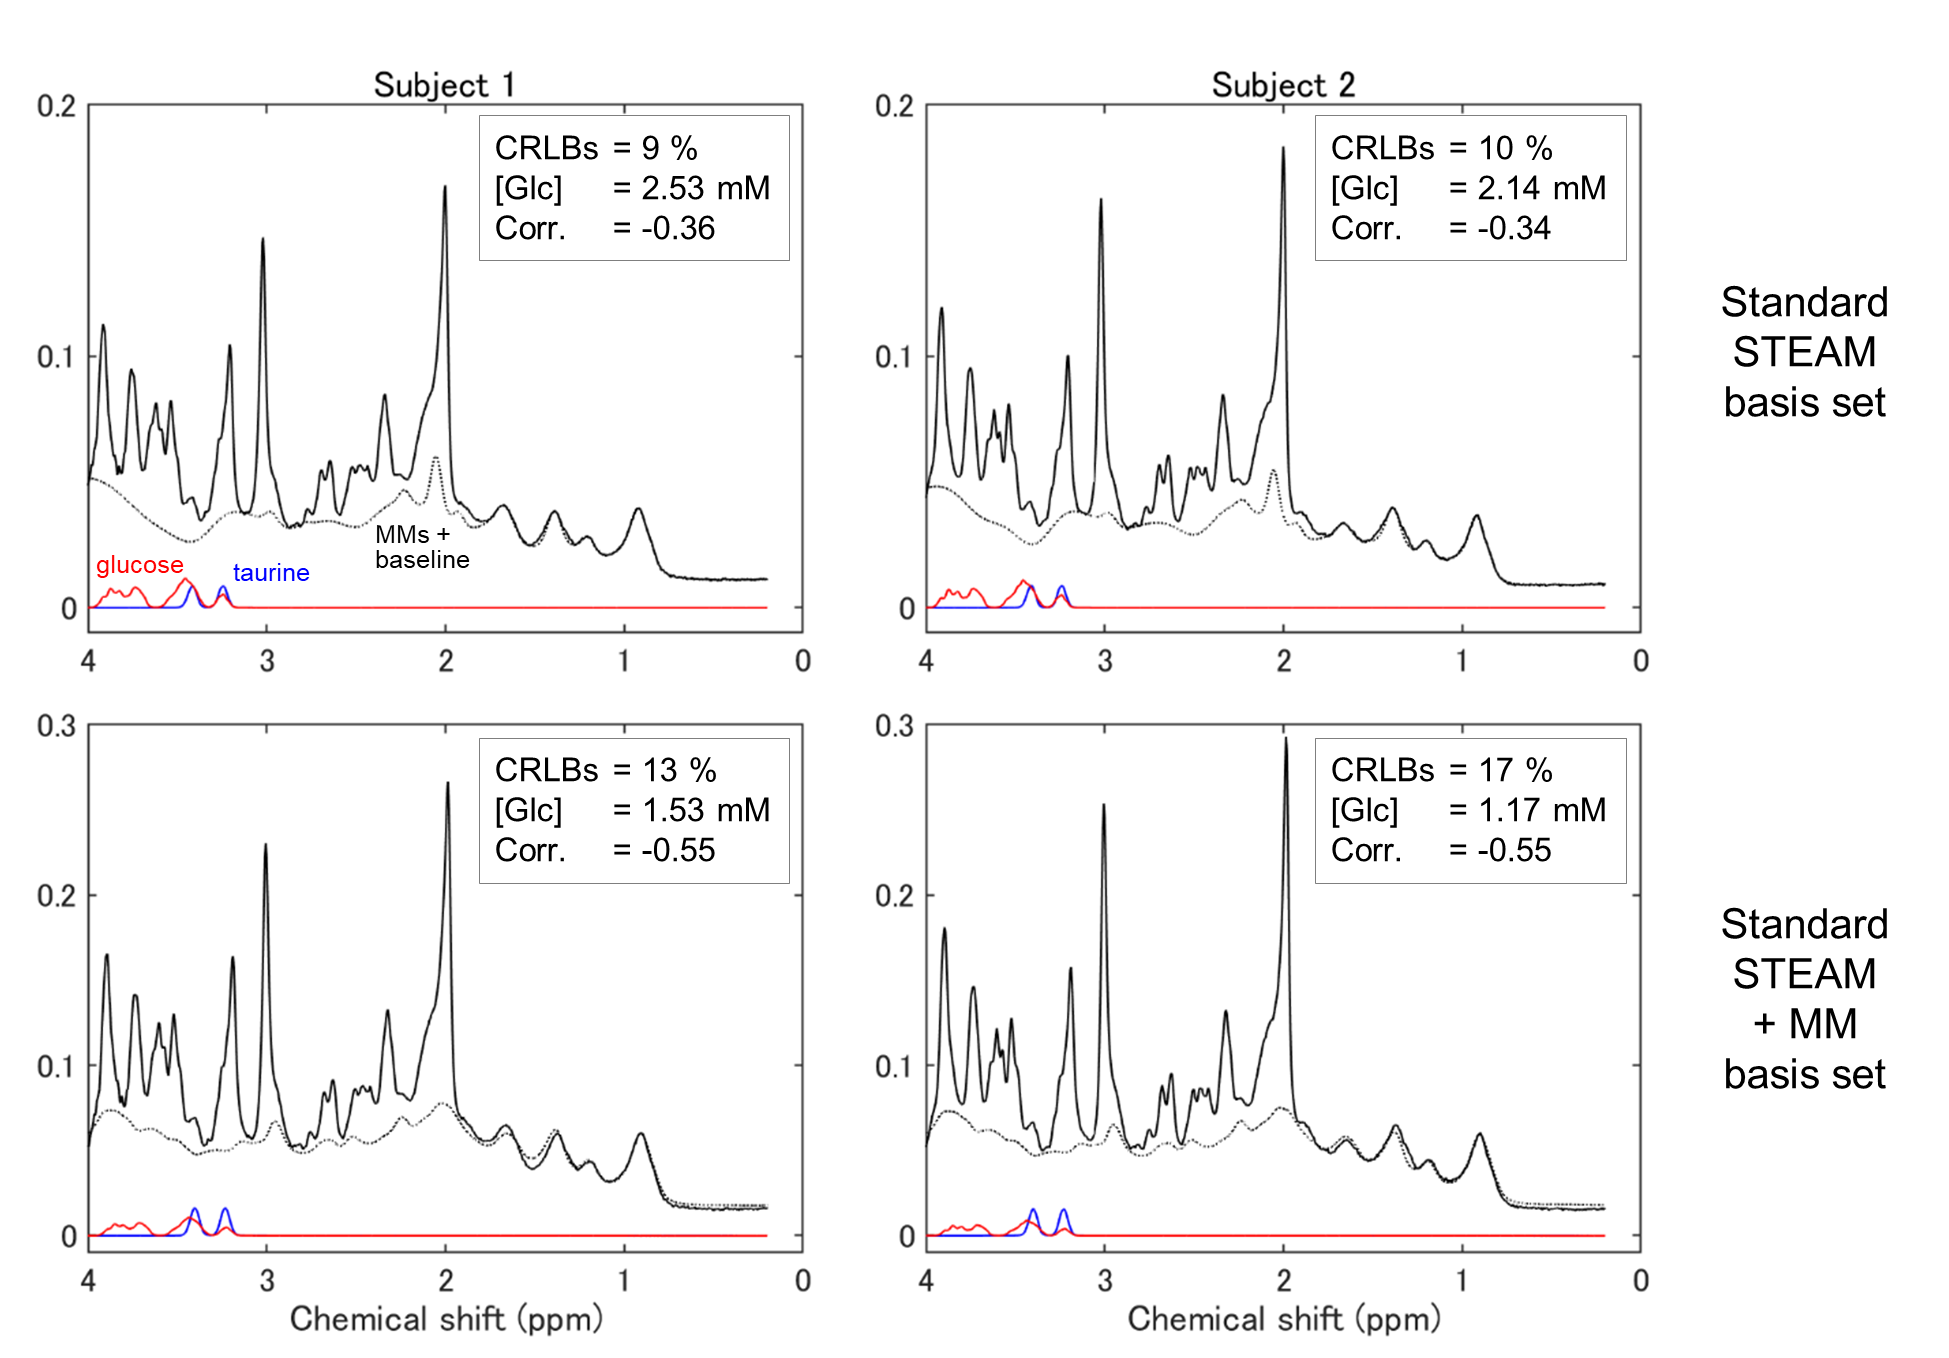
Figure 1. Short-TE STEAM spectra from the posterior
cingulate cortex acquired at 7T. The spectra were analyzed using standard
STEAM basis set (top) and with adding macromolecule (MM) basis set (bottom).
The spectra from two subjects (left and right) showed the CRLBs for glucose fit
< 50 % analyzed using the MM basis set. Insets: CRLBs = Cramér-Rao lower bounds for glucose fit,
[Glc] = estimated glucose concentration, Corr. = LCModel correlation
coefficient between glucose and taurine.
DOI: https://doi.org/10.58530/2023/3866