3865
Novel urease inhibitor as potential treatment of hepatic encephalopathy led to brain glutamine decrease1CIBM Center for Biomedical Imaging, Lausanne, Switzerland, 2Animal Imaging and Technology, EPFL, Lausanne, Switzerland, 3Institute of Pharmaceutical Sciences, ETH Zurich, Zurich, Switzerland, 4Swiss Center for Liver Disease in Children, University Hospitals Geneva, Geneva, Switzerland, 5Laboratory of Functional and Metabolic Imaging, EPFL, Lausanne, Switzerland
Synopsis
Keywords: Spectroscopy, Brain, Metabolism, Hepatic Encephalopathy, proton
Type C hepatic encephalopathy (HE) is a severe neuropsychiatric disorder associated with chronic liver disease. Ammonia (partially produced in the gut by bacterial urease activity) has been pinpointed to explain the observed neurological alterations in HE and connected with the increase in brain Gln measured using 1H-MRS. As such current treatment strategies focus on either reducing ammonia production and absorption or on promoting its elimination. We showed that targeting urease activity using the urease inhibitor 2-octynoHA has a beneficial effect in reducing blood ammonia levels and reducing brain Gln measured using 1H-MRS at 9.4T in the cerebellum.
Introduction
Type C hepatic encephalopathy (HE) is a severe neuropsychiatric disorder associated with chronic liver disease (CLD). The pathological foundation of type C HE is complex and multifactorial. Out of all neurotoxic candidates, ammonia has been pinpointed and has been the most studied to explain the observed neurological alterations1–3. The cerebral ammonia detoxification mainly relies on the conversion of glutamate (Glu) to glutamine (Gln) catalyzed by glutamine synthetase enzyme3,4. Glutamine, as a product of this process, accumulates in the cells reaching high concentrations4–9. Longitudinal measures of brain metabolite changes in an animal model of type C HE (the bile duct ligated rat - BDL) using 1H-MRS showed the highest increase of brain Gln in the cerebellum, driven by the increase in blood ammonia leading to osmotic stress in the astrocytes and alteration of cell metabolism10.Ammonia is mainly produced in the gut and its systemic concentration is then regulated by the liver where it is metabolized by the urea cycle and subsequently eliminated in the kidneys2. When injured, liver is not able to efficiently detoxify ammonia from the system3. As such current treatment strategies focus on either reducing ammonia production and absorption or on promoting its elimination, however, they exhibit various limitations (e.g. side effects, risk of resistance for antibiotics, moderate efficacy).
Bacterial urease activity in the gut is one of the main pathways of ammonia production, pointing towards urease inhibitors such as hydroxamic acids as a potential treatment. We identified 2-octynohydroxamic acid (2-octynoHA) as a lead candidate because of its high potency. In addition, it was shown as non-cytotoxic nor mutagenic up to 1 mM11.
Therefore, the aim of this study was to test whether oral administration of 2-octynoHA can reduce circulating ammonia levels in the BDL rats and therefore reduce ammonia burden to the brain resulting in an improved cerebellar metabolic profile measured using 1H-MRS at 9.4T.
Methods
Four groups of rats were investigated (Fig.1). Firstly, a group of non-treated BDL rats (n=10) was followed longitudinally from day 0 (healthy animal) until day 56 after BDL surgery to account for previously reported brain metabolic changes10. The second group of BDL rats was orally treated with a solution of 2-octynoHA+cyclodextrin at a dose of 30 mg/kg twice a day over the course of 5 days (from day 35 to day 39, BDL+T). The third group was orally treated with 2-octynoHA ca. 30 mg/kg once a day in an enteric capsule over the course of 5 days (from day 35 to day 39, BDL+C). The fourth group was treated with a placebo mixture of HPMC 86k 1% w/v + neotame 0.004 – 0.008% w/v twice a day over the course of 5 days (from day 35 to day 39, BDL+P). The number of animals per group at each timepoint is shown in Fig.1.1H-MRS experiments were performed at 9.4T in the cerebellum (2.5×2.5×2.5mm3) using the SPECIAL sequence (TE=2.8ms)12. First and second order shims were adjusted using FASTMAP13. Metabolite concentrations were calculated by LCModel using water as reference. Seventeen metabolites were reliably quantified, but only those showing a response to the disease are presented. Blood ammonia was measured using a Blood Ammonia Meter (PocketChemTM BA PA-4140) and plasma bilirubin using a Reflotron Plus system.
Results and discussion
All the rats had an increase in blood bilirubin concentration throughout the study validating the presence of CLD. The BDL group displayed a constant increase in blood ammonia throughout the disease evolution followed by a linear increase in brain Gln (Fig.1A&B in red). The two treated groups and the placebo group showed a similar concentration of ammonia at day 35 (start of treatment). In the BDL+T group, ammonia levels decreased significantly at day 37. In the case of BDL+C, which was administered at a dose twice lower and in non-dissolved form, the effect was less pronounced and only a trend towards lower ammonia was observed. The ammonia concentrations in the placebo group increased until day 39 being comparable to the BDL group at day 42. These data show that 2-octynoHA was efficient in inhibiting ammonia production, and thereby preventing the increase in blood ammonia levels. All groups displayed changes in the brain metabolic profile characteristic of type C HE such as a decrease in osmolytes (e.g. Inositol (Ins), Taurine (Tau), total-Choline (tCho)) and a decrease in antioxidants (Ascorbate (Asc)) (Fig.3&Fig.4). Interestingly, brain Gln was significantly lower in BDL+T and BDL+C compared to BDL+P (Fig.1B), likely as a result of the inhibition of ammonia production. Other metabolites did not appear to be affected by the treatments likely due to their short duration and delayed reaction to Gln and ammonia decrease7,10. However, the observed fast response of Gln gives a novel tool/marker to study the treatment effect on type C HE in the brain.Conclusion
We showed that targeting urease activity using the urease inhibitor 2-octynoHA has a beneficial effect in reducing blood ammonia levels and reducing brain Gln. Gln was confirmed as the first marker of type C HE in the brain and the first reacting brain metabolite to changes in ammonia concentrations, showing a great potential of 1H-MRS in assessing the disease severity and the treatment effect in type C HE.Acknowledgements
Carigest SA is acknowledged for financial support.References
1. Weiss, N., Jalan, R. & Thabut, D. Understanding hepatic encephalopathy. Intensive Care Med. 44, 231–234 (2017).
2. Rose, C. F. et al. Hepatic encephalopathy: Novel insights into classification, pathophysiology and therapy. J. Hepatol. 73, 1526–1547 (2020).
3. Jalan, R. & Kerbert, A. J. C. Recent advances in understanding and managing hepatic encephalopathy in chronic liver disease. F1000Research 9, (2020).
4. Cooper, A. J. L. & Plum, F. Biochemistry and physiology of brain ammonia. Physiol. Rev. 67, 440–519 (1987).
5. Felipo, V. & Butterworth, R. F. Neurobiology of ammonia. Progress in Neurobiology. 67(4), 259-279 (2002).
6. Rackayova, V. et al. Longitudinal osmotic and neurometabolic changes in young rats with chronic cholestatic liver disease. Sci. Rep. 10, 7536 (2020).
7. Braissant, O. et al. Longitudinal neurometabolic changes in the hippocampus of a rat model of chronic hepatic encephalopathy. J. Hepatol.71(3), 505-515 (2019).
8. Kreis, R., Farrow, N. & Ross, B. D. Localized 1H NMR spectroscopy in patients with chronic hepatic encephalopathy. Analysis of changes in cerebral glutamine, choline and inositols. NMR Biomed 4, 109–116 (1991).
9. Häussinger, D. et al. Proton magnetic resonance spectroscopy studies on human brain Myo-inositol in hypo-osmolarity and hepatic encephalopathy. Gastroenterology 107, 1475–1480 (1994).
10. Simicic, D. et al. In Vivo Longitudinal 1H MRS Study of Hippocampal, Cereberal and Striatal Metabolic Changes in the Adult Brain Using an Animal Model of Chronic Hepatic Encephalopathy. Am. J. Gastroenterol. 114, (2019).
11. Evstafeva, D., Ilievski, F., Bao, Y. & Leroux, J.-C. In vitro evaluation of novel urease inhibitors for the treatment of hepatic encephalopathy. Proc. Int. Soc. Hepatic Encepalopathy Nitrogen Metab. Symp. (2021).
12. Mlynárik V et al. Localized short- echo-time proton MR spectroscopy with full signal-intensity acquisition. Magnetic Resonance in Medicine 56(5), 965-970 (2006).
13. Gruetter, R., Tkac, I. Field mapping without reference scan using asymmetric echo-planar techniques. Magnetic Resonance in Medicine 43(2), 319-323 (2000).
Figures
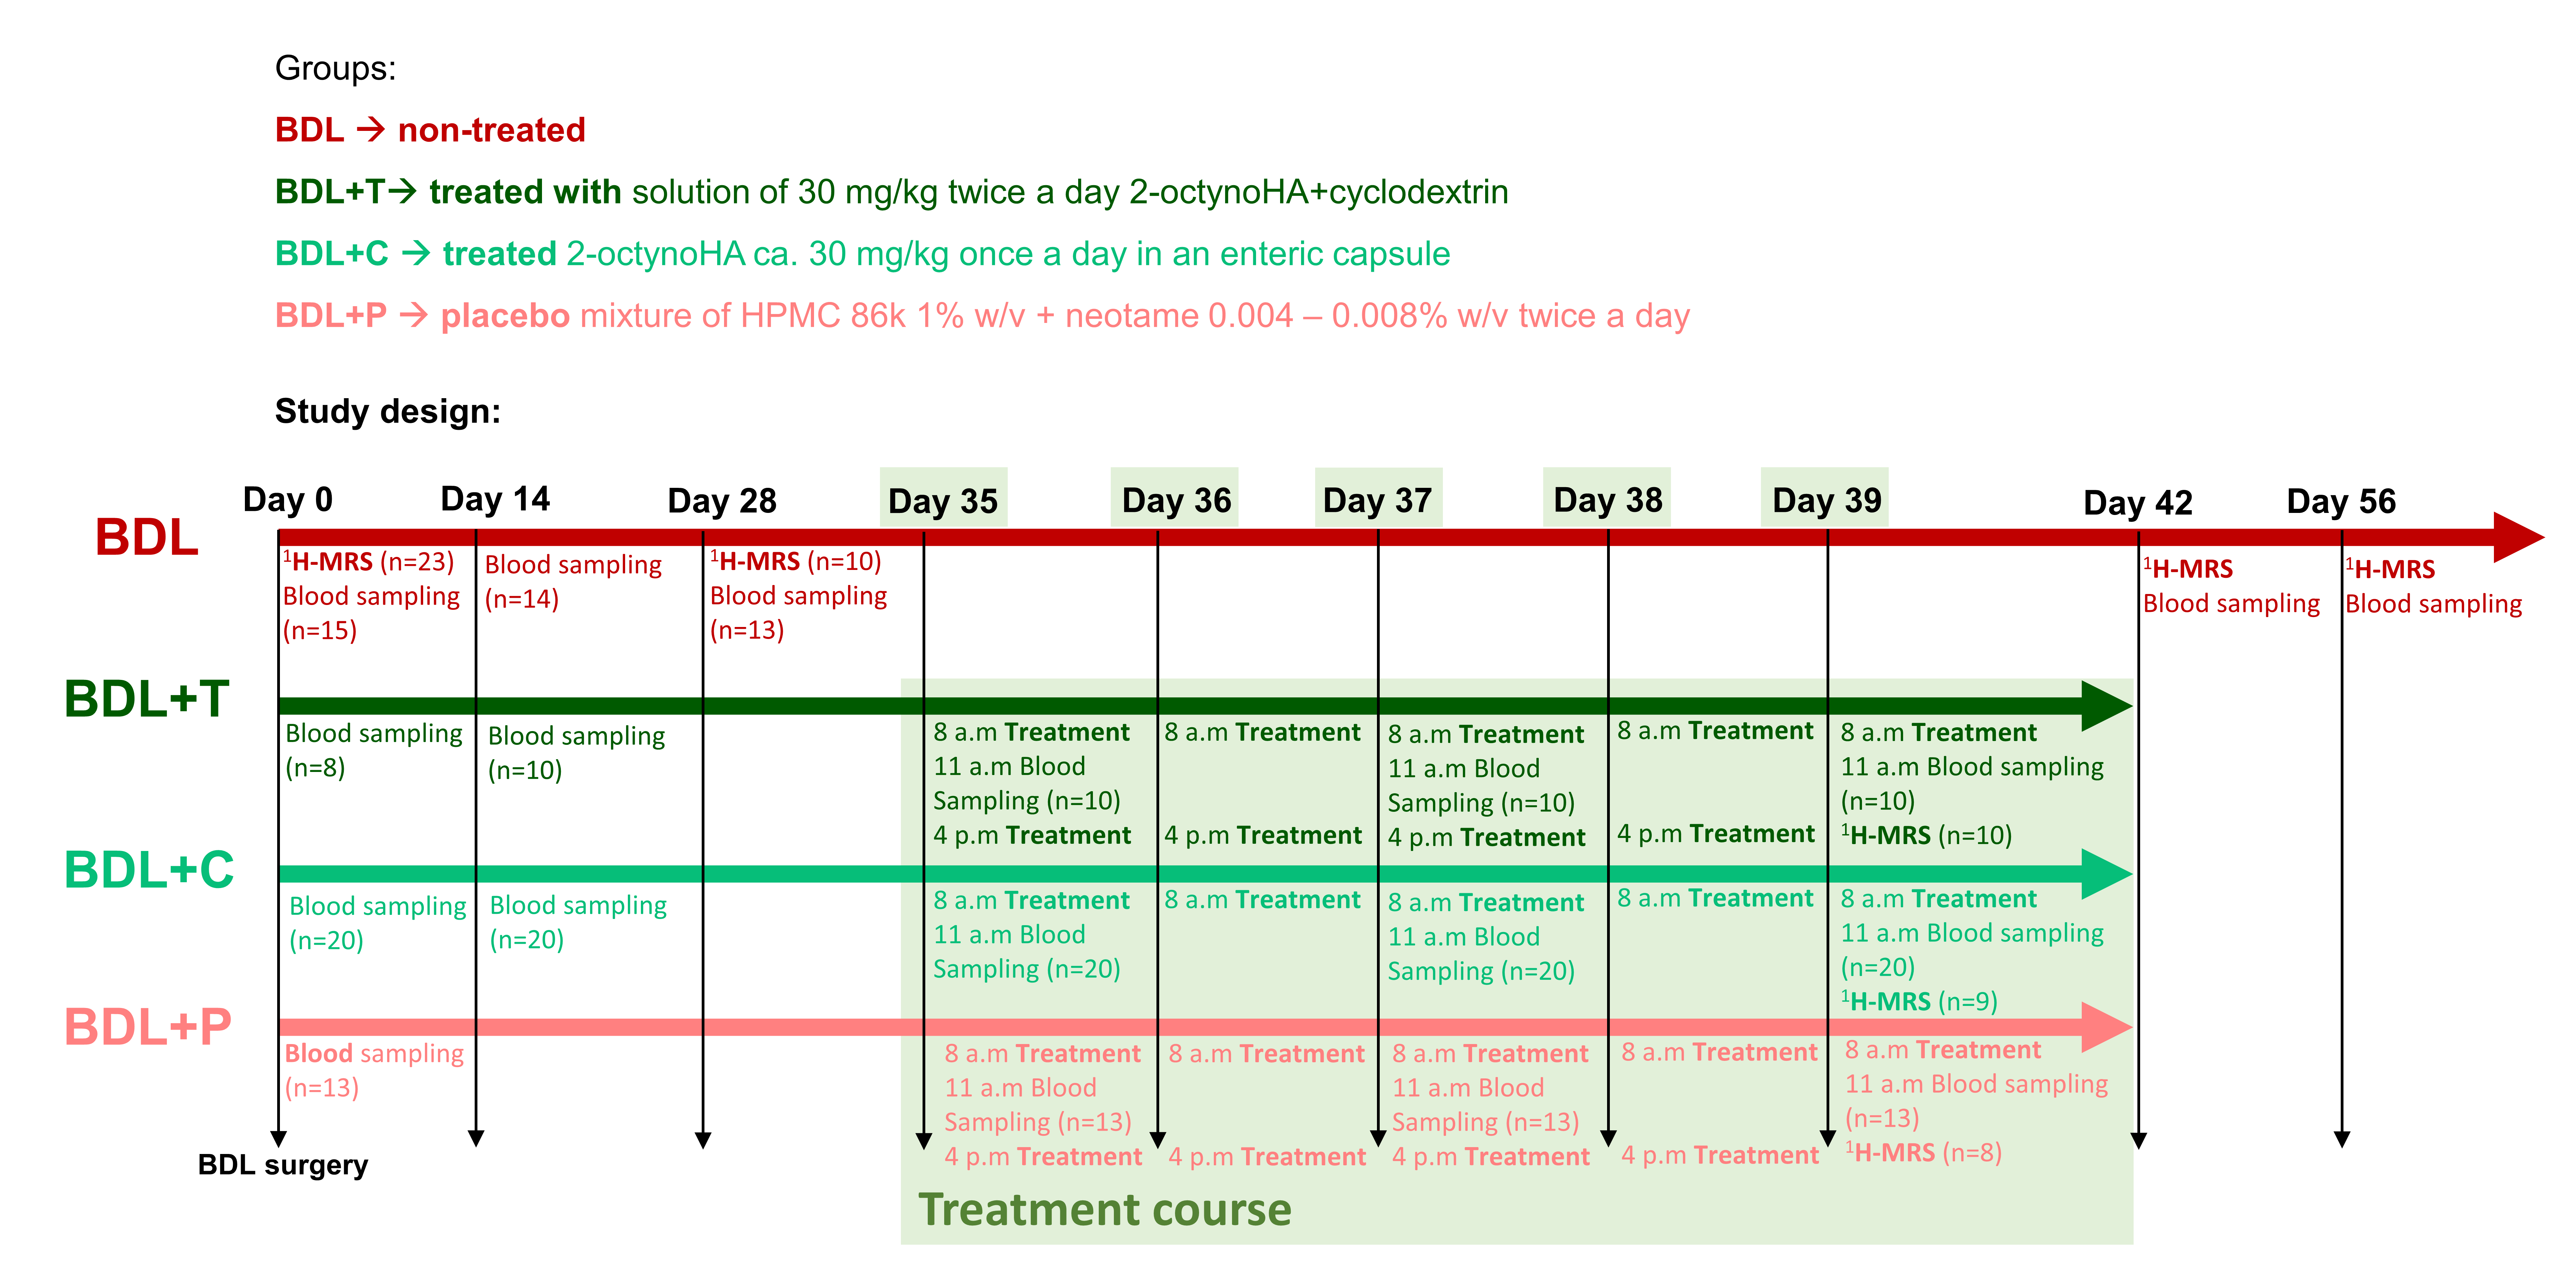
Figure 1: Detailed study design. The 1H-MRS scans and the blood sampling were performed at day 0 on rats before surgery (healthy animals). Note that sometimes a different n for 1H-MRS within the same group is due to the length and complexity of these measurements, therefore they couldn’t always be performed on all the rats within a group.
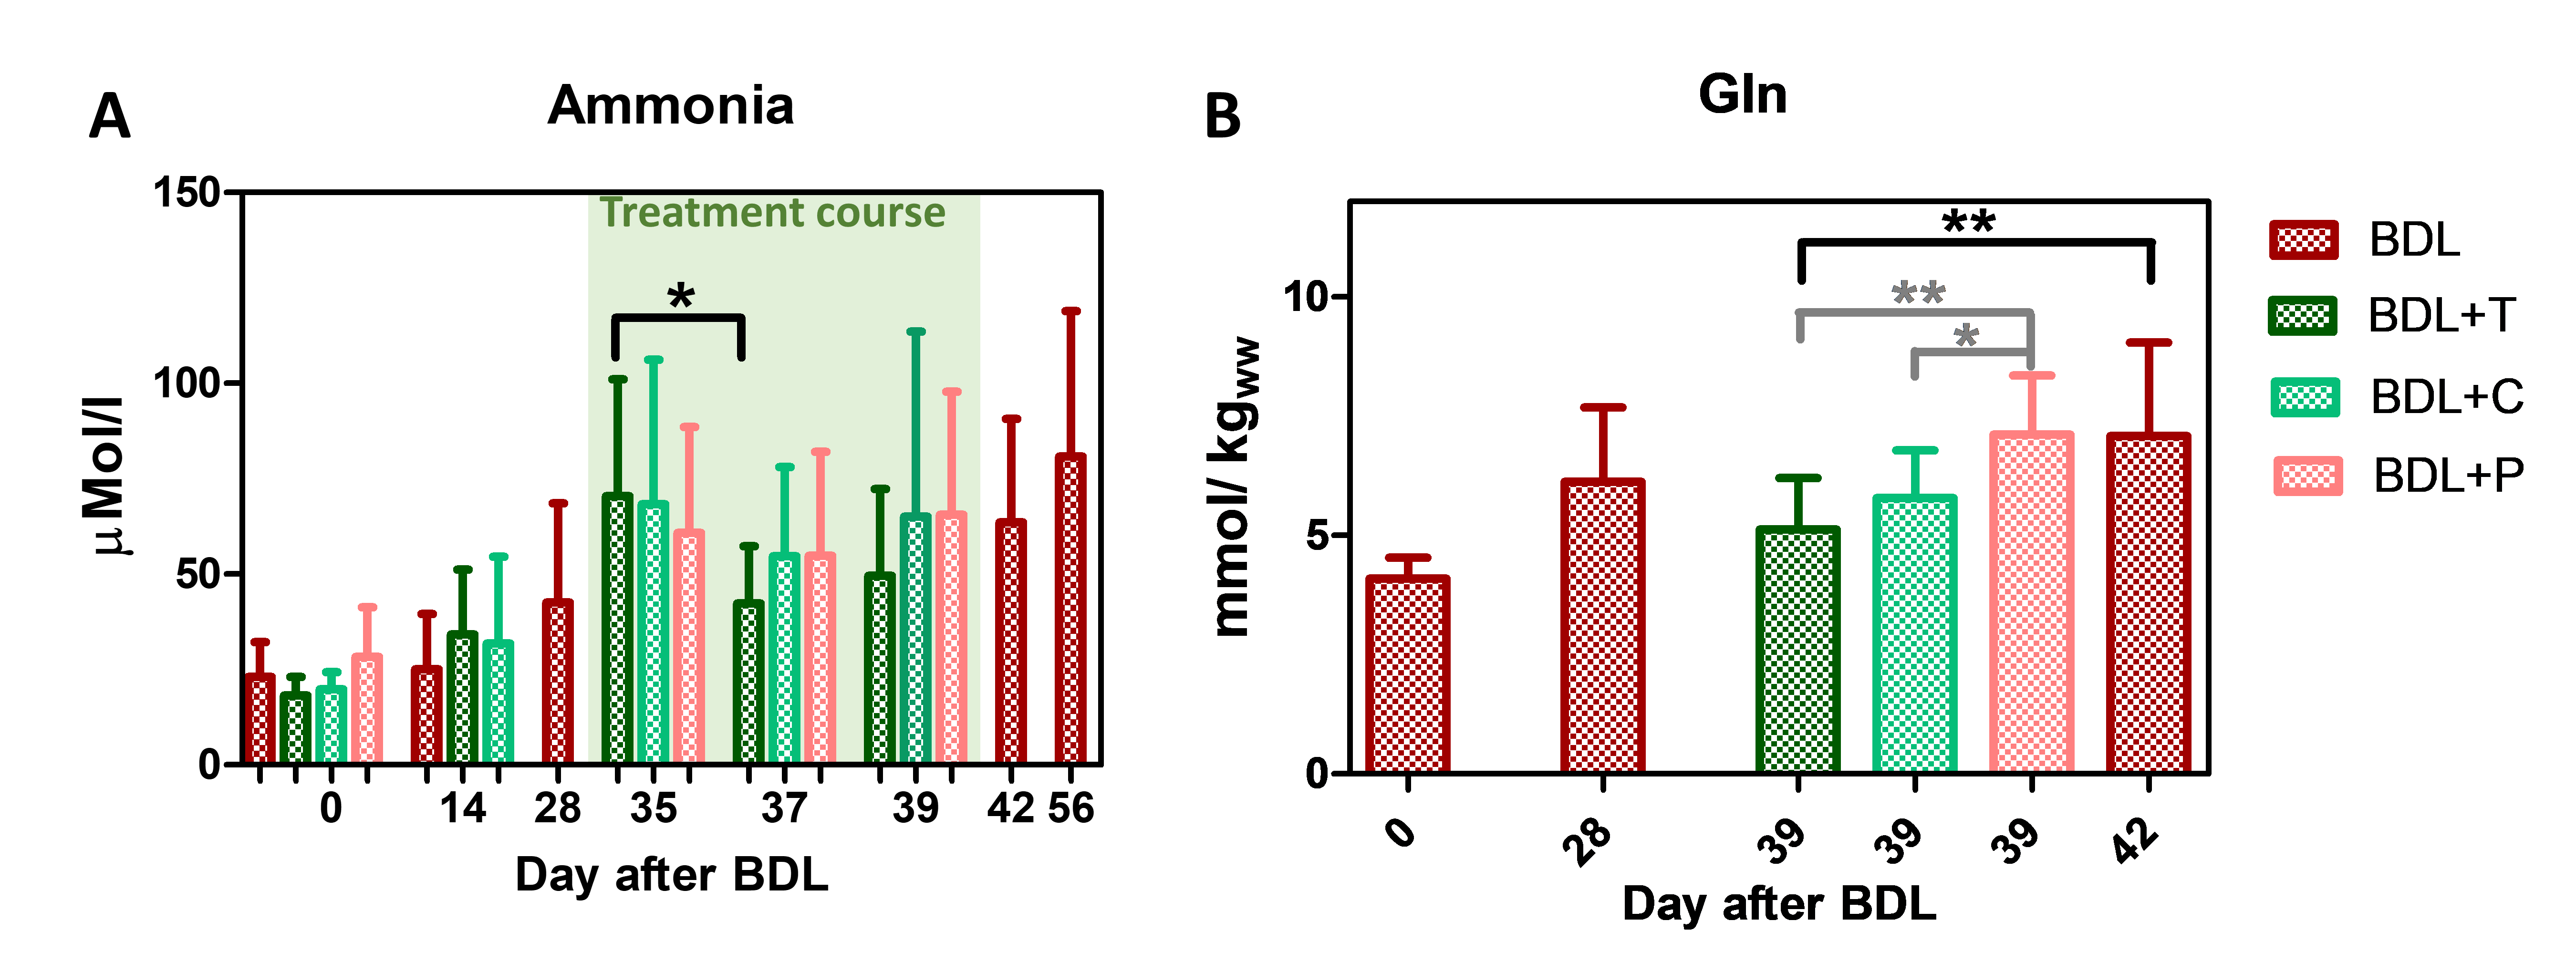
Figure 2: (A) Longitudinal evolution of blood ammonia. The course of the treatment is highlighted in green. Only the statistic calculated during the treatment course for each group is shown (1-way ANOVA, Tukey’s comparison test) (B) The longitudinal concentration of brain Gln at day 0 (healthy) and days 28 and 42 for BDL rats. Comparison of brain Gln concentrations for treated groups (BDL+T, BDL+C) at the end of treatment (day 39) with the placebo group (BDL+P) at the same day and BDL group at day 42 (1-way ANOVA, Dunnett’s comparison test).
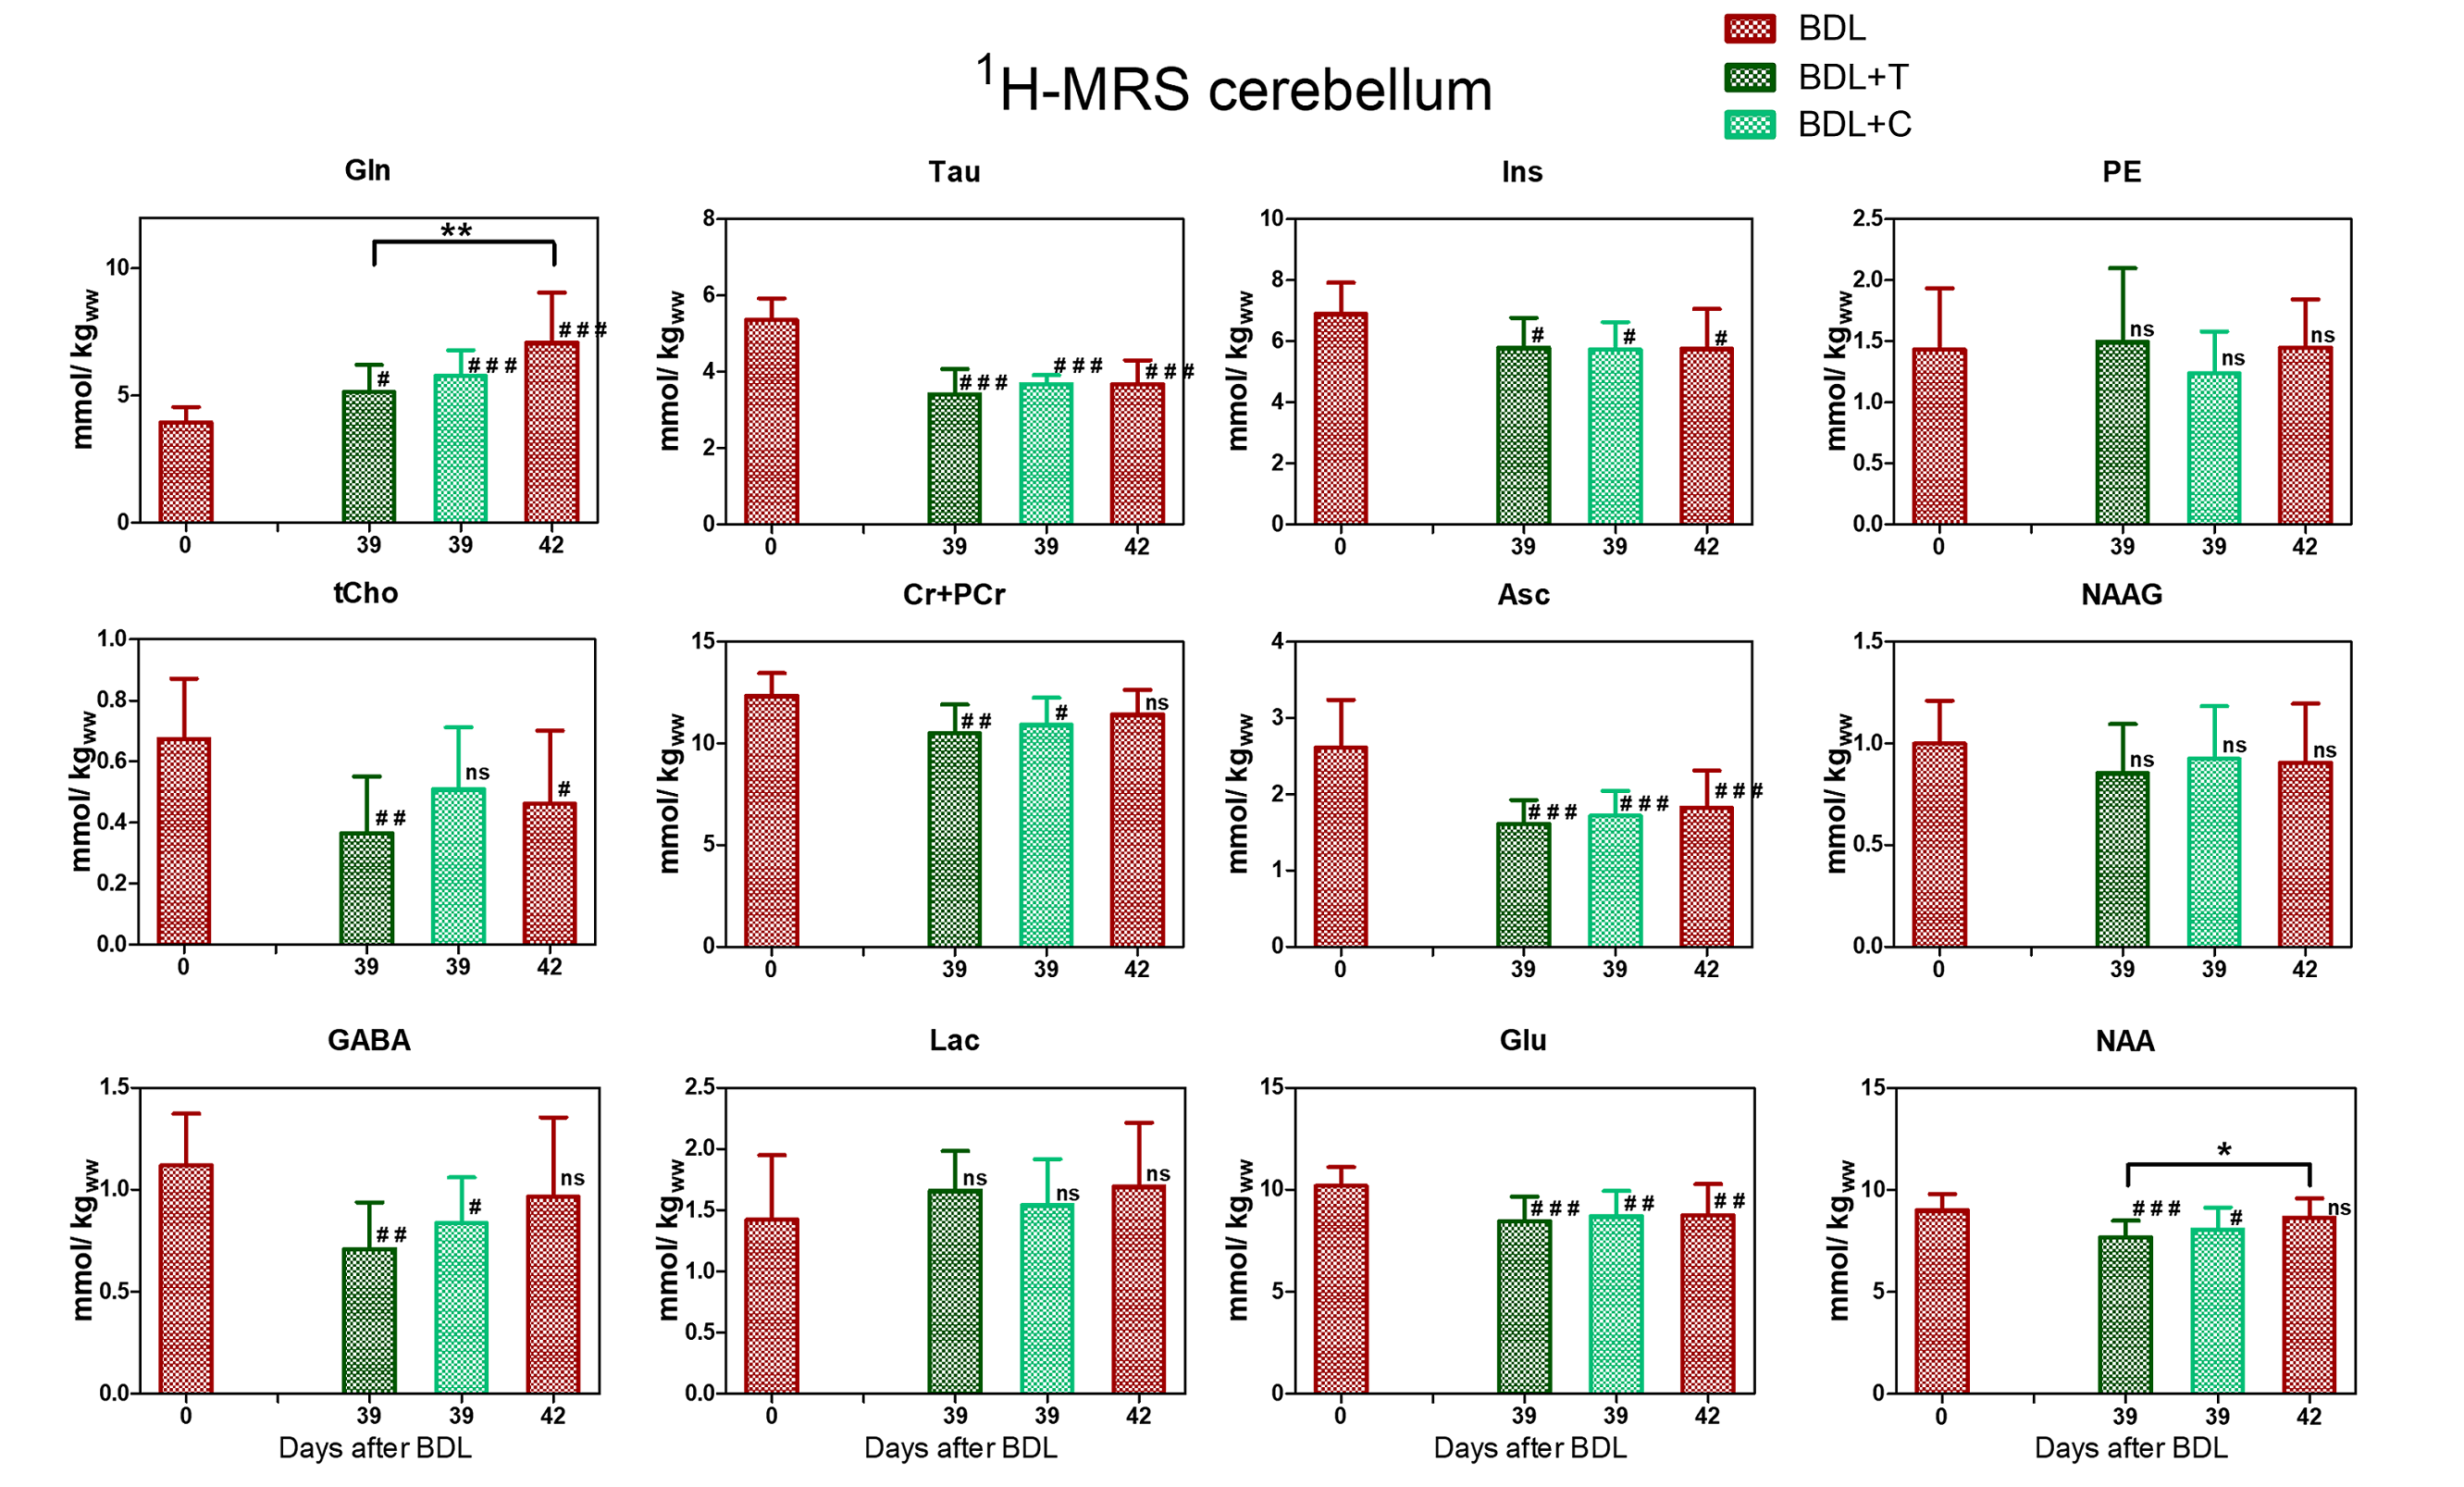
Figure 3: The brain metabolites response to CLD and treatment. The metabolic concentrations of the BDL rats are shown at day 0 (healthy) and day 42 after surgery. The metabolic concentrations for both treated groups are shown at the end of treatment (day 39) and were compared (1-way ANOVA, Dunnett’s comparison test) with day 0/healthy (#) and with day 42/sick (*) metabolic concentrations.
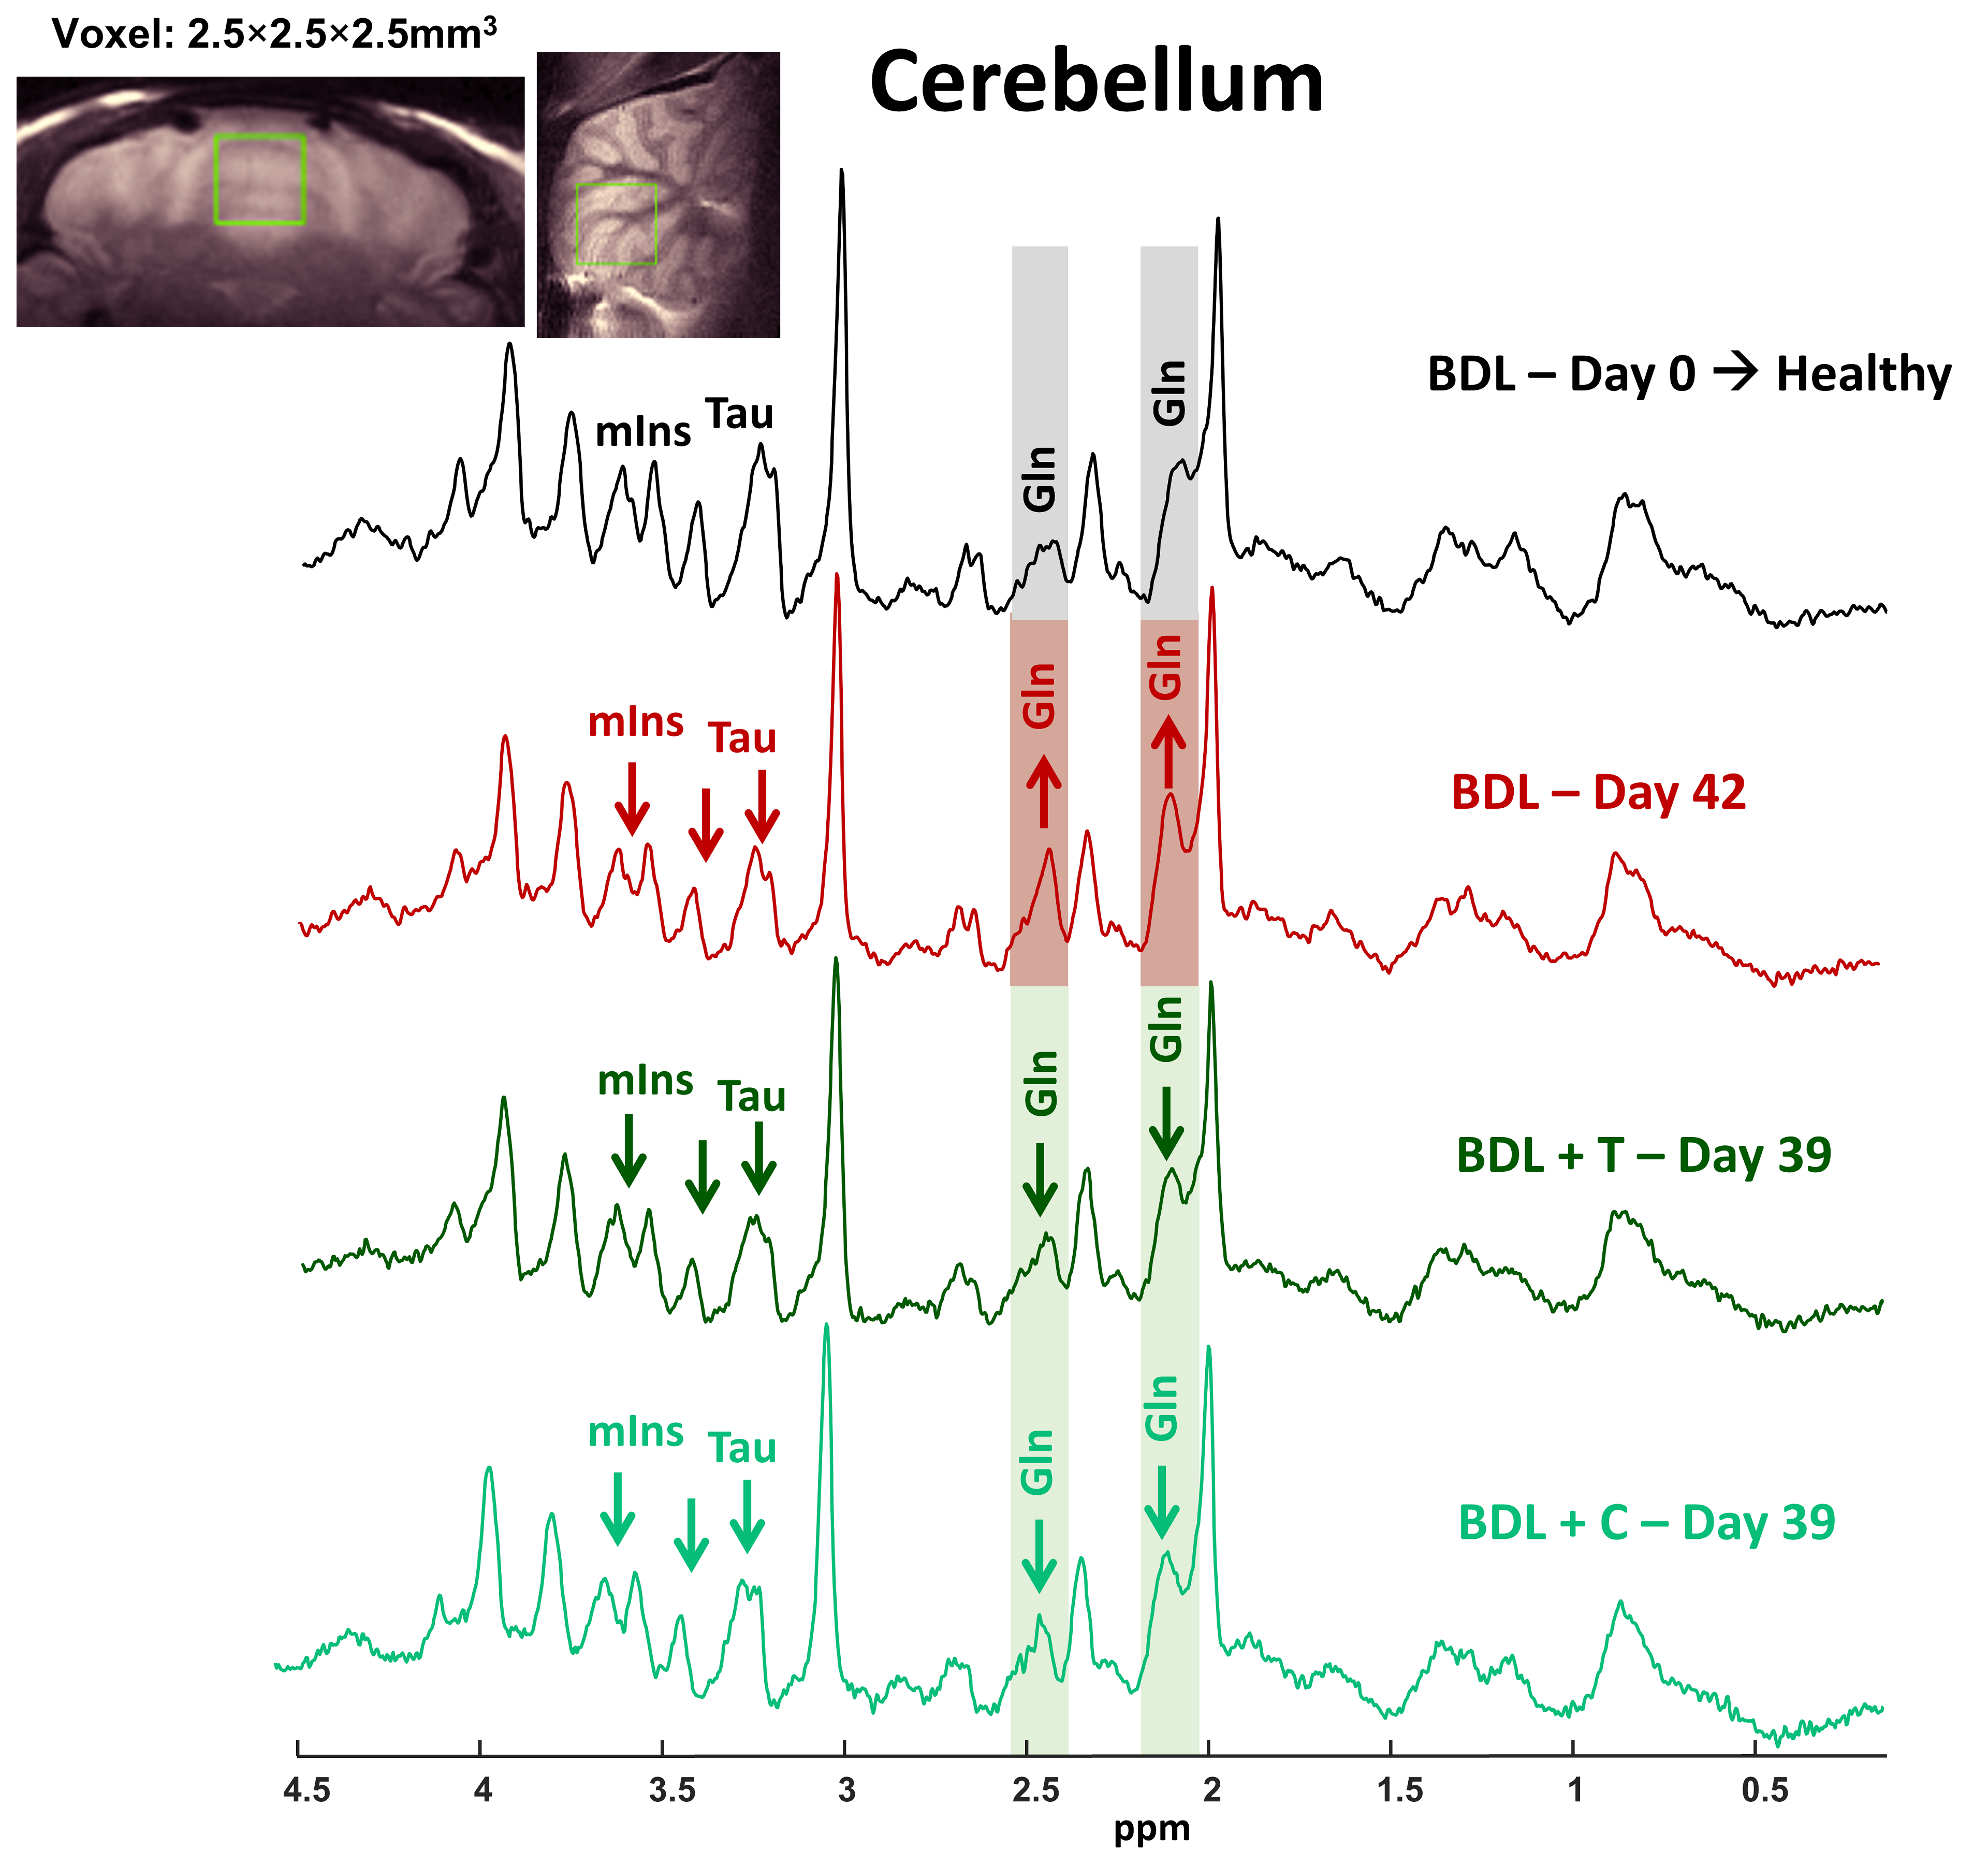
Figure 4: Representative 1H-MRS spectra acquired at 9.4T in the cerebellum in healthy, BDL and BDL treated rat (SPECIAL, TE=2.8ms, 160av); with the corresponding VOI position.