3862
Comparing 7 T FID-CRT-MRSI with 3 T MRF in High-Grade Gliomas1Department of Neurosurgery, Medical University of Vienna, Vienna, Austria, 2High-field MR Center, Department of Biomedical Imaging and Image-guided Therapy, Medical University of Vienna, Vienna, Austria, 3Division of Neuroradiology and Musculoskeletal Radiology, Department of Biomedical Imaging and Image-guided Therapy, Medical University of Vienna, Vienna, Austria, 4Division of Neuropathology and Neurochemistry, Department of Neurology, Medical University of Vienna, Vienna, Austria, 5Division of Oncology, Department of Internal Medicine I, Medical University of Vienna, Vienna, Austria, 6Medical Image Analysis and AI, Danube Private University, Krems, Austria, 7Christian Doppler Laboratory for MR Imaging Biomarkers, Vienna, Austria, 8Institute for Clinical Molecular MRI, Karl Landsteiner Society, St. Pölten, Austria
Synopsis
Keywords: Spectroscopy, Brain
We compared 7T MRSI-derived metabolic ratios with T1 and T2 maps from MR fingerprinting in a cohort of glioma patients by defining hotspots and calculating Dice similarity coefficients (DSCs) between them and a segmentation. Notable high DSCs were 0.799 for tCho/NAA vs T2 and 0.753 for Gln/NAA vs T1. We also investigated values for T1, T2, and metabolite ratios in tumors, hotspots, and a control region, with the median relaxation times being T1=1610 ms and T2=79 ms in the tumor, and T1=964 ms and T2=46 ms in NAWM.
Introduction
Magnetic resonance spectroscopic imaging (MRSI) delivers data beyond the structural contrasts conventionally provided by MRI. The acquired spectroscopic signals can be spectrally decomposed into a combination of basis spectra, which, when done in multiple voxels in a volume of interest, yields spatial metabolite distributions. Magnetic resonance fingerprinting (MRF) is a modern approach that uses a single acquisition wherein the flip angle, the repetition time (TR) and the echo time (TE) are varied, to derive T1 and T2 relaxation times by comparing the acquired data “fingerprint” to a library.Both modalities are of interest in the imaging of certain pathologies like brain tumors, and we are in the unique position to directly compare them at our institute. Thus, after previously comparing 7T MRSI to positron emission tomography (PET)1, where we showed that the metabolite ratios total choline/N-acetylaspartate (tCho/NAA), glutamine/NAA (Gln/NAA), and glycine/NAA (Gly/NAA) better correspond to PET hotspots than 3T MRSI, we now aim to compare MRSI and MRF in glioma patients. This study is the first comparison between 7T MRSI and MRF to our knowledge.
Methods
For MRSI, a free induction decay-based concentric ring trajectory-approach (FID-CRT-MRSI, TR = 450 ms, acquisition delay = 1.3 ms, FOV = 220x220x133 mm³, resolution = 3.4 x 3.4 x 3.4 mm³, TA = 15 min) was acquired at a 7T MR scanner (Siemens Healthineers) with a 1 Tx/32 Rx head coil (Nova Medical, Wilmington, MA, USA), as well as a T1w MP2RAGE and B0 and B1 field maps. The MRSI data was post-processed2 and quantified using LCModel3.The MRF protocol was acquired at a 3T scanner (Siemens Healthineers). It was based on a 2D Fast Imaging with Steady-state Precession (FISP) spiral readout (FOV = 256x256 mm, in-plane resolution = 1x1 mm, TA = 20 s per slice). Due to MRF’s long acquisition time, only a set of slices around the tumor was acquired.
For reference, a tumor segmentation based on routine 3T MRI was performed by a neuroradiologist. 7T MRSI, 3T MRF and segmentation were coregistered using a mutual information optimization in MITK4.
For analysis, we defined hotspots for both MRSI metabolite ratio maps and MRF relaxation time maps, which were based on a threshold value of 1.5 times the respective median value of a normal-appearing white matter reference region. We evaluated median values in the hotspot and the control region. We also calculated Sørensen-Dice similarity coefficients (DSCs) between the hotspots, as well as correlation coefficients between the different quantities.1
Results
Figure 1 shows metabolic ratio maps, T1 and T2 maps, morphological reference, and the radiologist’s segmentation of a glioma patient. The DSCs between the different maps and the segmentation are noted below. For the entire cohort, the median DSCs compared to the segmentation were 0.727 for the T1 hotspot, 0.798 for the T2 hotspot, 0.452 for the tCho/NAA hotspot, 0.784 for the Gln/NAA hotspot, and 0.542 for the Gly/NAA hotspot. Together with the DSCs between the metabolic hotspots and the relaxation time hotspots, these values are noted in Table 1.Median cohort values of the median relaxation time in the tumor hotspot for were 1724±113 ms (T1 ± interquartile range) and 86±47ms (T2), compared to 964±25 ms (T1) and 46±3 ms (T2) in a normal appearing white matter control region. Similarly, median metabolite ratios in the tumor hotspot were 0.484 for tCho/NAA, 0.606 for Gln/NAA, and 0.278 for Gly/NAA, compared to 0.201 (tCho/NAA), 0.165 (Gln/NAA) and 0.070 (Gly/NAA) in normal appearing white matter (NAWM). These results are illustrated in box plots in Figures 2 and 3. It should be emphasized that the hotspot data contains only the hotspot within the tumor segmentation, i.e. only the voxels with values (T1, T2 or metabolite ratios) above the aforementioned threshold, and the tumor values contain the entire tumor segmentation.
Table 2 shows the correlation coefficients between metabolic ratios and relaxation times, which were low at 0.366 (tCho/NAA vs T1), 0.442 (tCho/NAA vs T2), -0.162 (Gln/NAA vs T1), 0.212 (Gln/NAA vs T2), -0.102 (Gly/NAA vs T1), and -0.069 (Gly/NAA vs T2).
Discussion
We compared MRSI and MRF in glioma patients and found good correspondence between some metabolic and relaxation hotspots, as evidenced by the respective DSCs. Most notably, tCho/NAA and the T2 hotspot as well as Gln/NAA and the T1 hotspot correspond well. T1 and T2 generally increase in a tumor due to intra-tumoral edema caused by vessel leakage, and they are additionally influenced by the presence of lipids, proteins, and macromolecules, which could be useful as spectroscopic tumor markers.We found relatively low correlation coefficients in the tumor hotspots for metabolic ratios and relaxation time, which may be explained by the fact that the metabolic changes detected by MRSI only have limited correspondence with the changes in relaxation times and morphology measured by MRF. It must be noted that this study is limited by its sample size.
In conclusion, MRSI and MRF hotspots correspond well in gliomas, but there is only a low correlation between metabolic ratios and relaxation times.
Acknowledgements
This work was supported by the Austrian Science Fund (FWF) projects KLI-646 FW and KLI 1089-B and the Comprehensive Cancer Center (Forschungsförderung der Initiative Krebsforschung, Medical University of Vienna).
References
- Springer E, Cardoso PL, Strasser B, et al. MR Fingerprinting-A Radiogenomic Marker for Diffuse Gliomas. Cancers. 2022. doi: 10.3390/cancers14030723.
- Hingerl L, Bogner W, Moser P, et al. Density-weighted concentric circle trajectories for high resolution brain magnetic resonance spectroscopic imaging at 7T. Magn Reson Med. 2018 Jun;79(6):2874-2885. doi: 10.1002/mrm.26987.
- Stephen Provencher. Estimation of metabolite concentrations from localized in vivo proton NMR spectra. Magn Reson Med. 1993. doi: 10.1002/mrm.1910300604
- Wolf I, Vetter M, Wegner I, et al. The medical imaging interaction toolkit (MITK): a toolkit facilitating the creation of interactive software by extending VTK and ITK. Medical Imaging: Image-Guided Procedures. 2004.
Figures
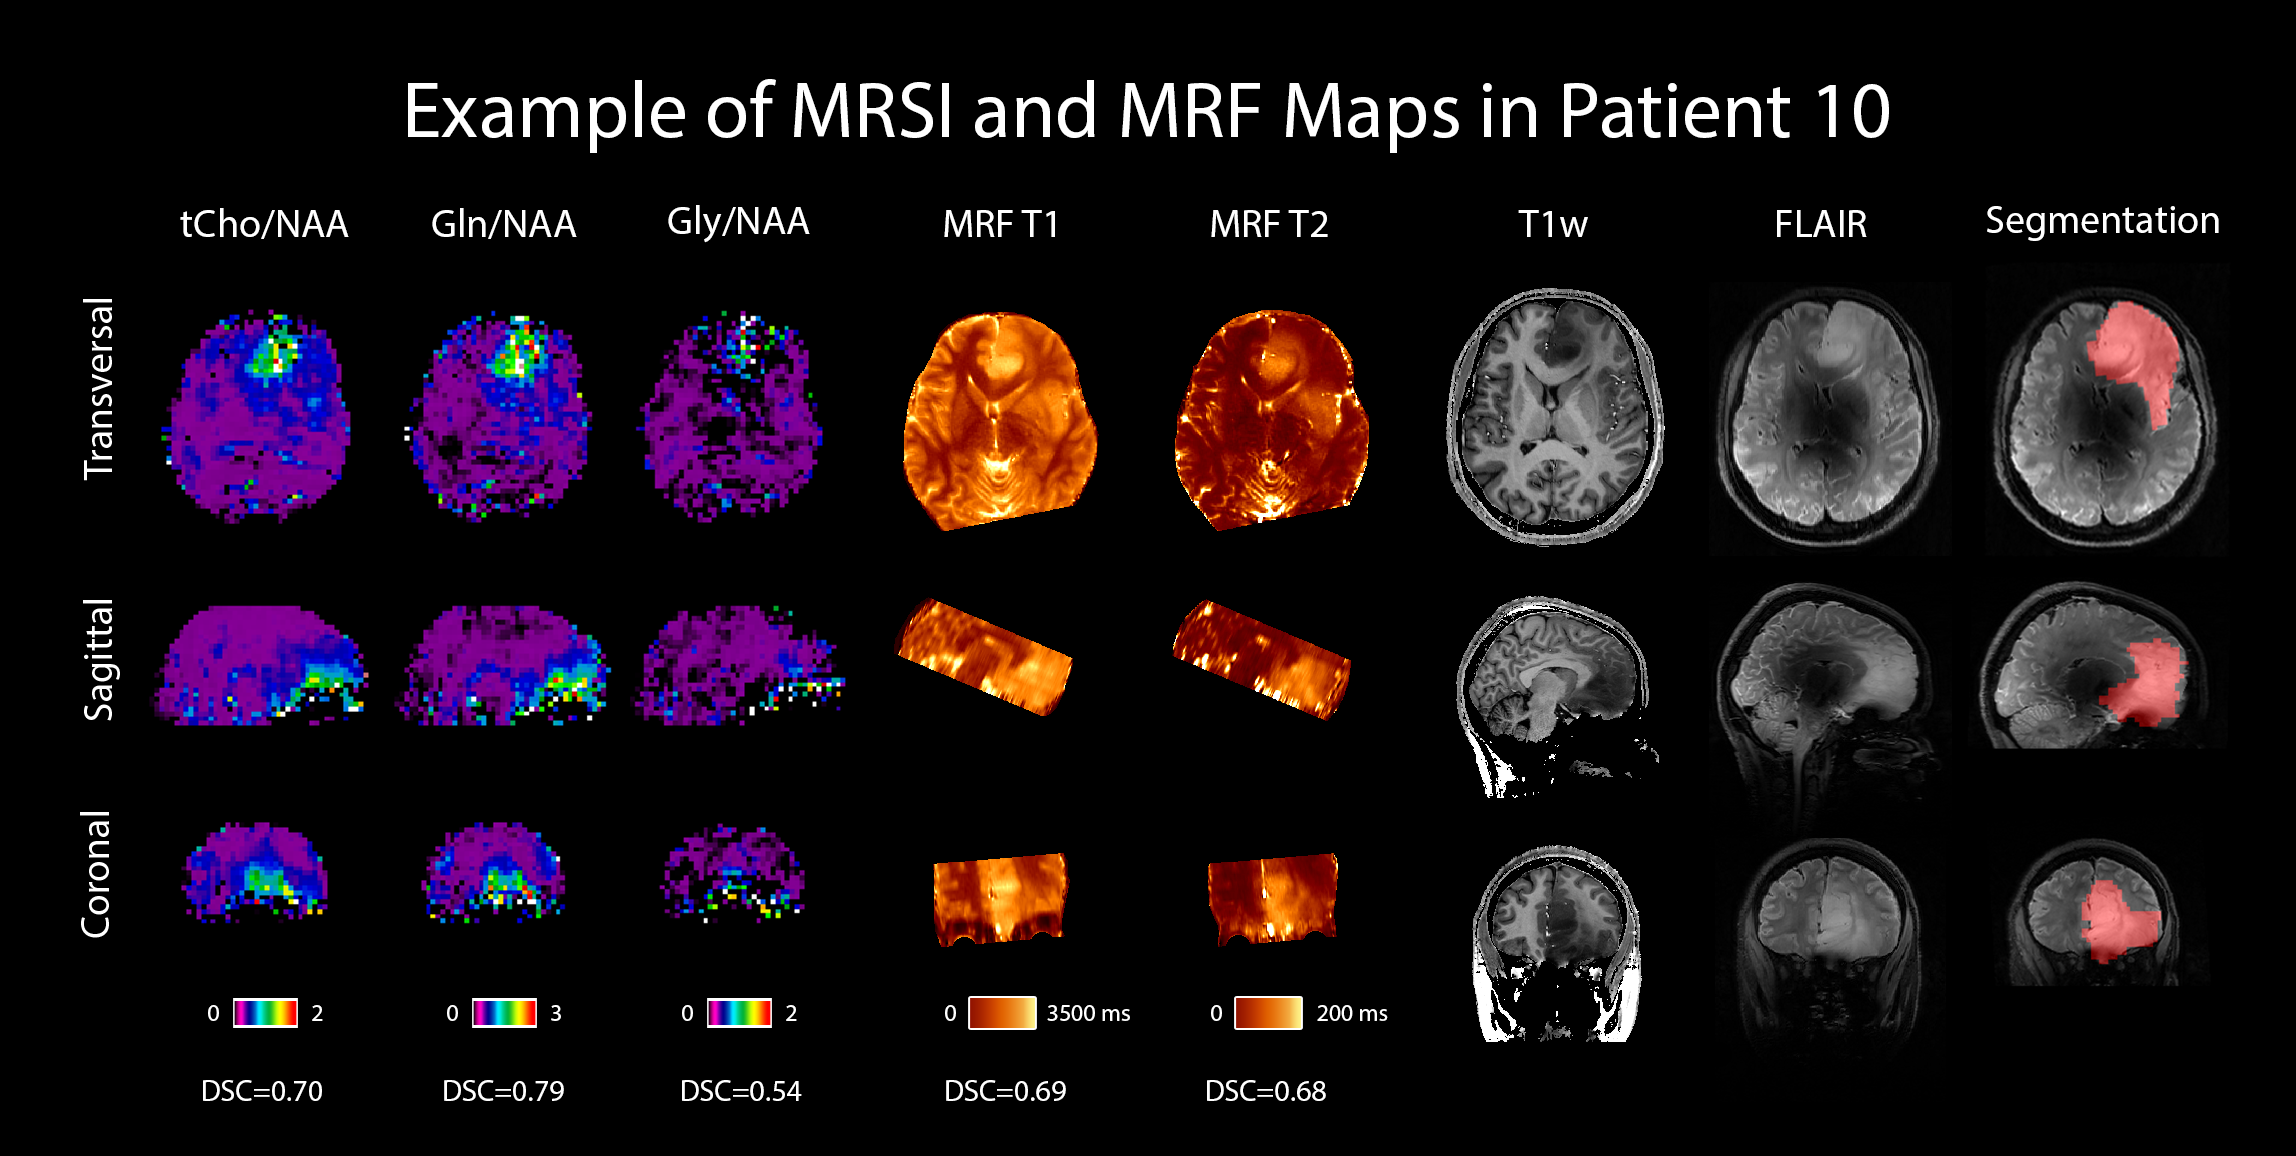
Figure 1: MRSI and MRF maps in a patient (transversal, sagittal and coronal view). For comparison, a 7T T1w MP2RAGE and a 7T FLAIR are shown, as well as the radiologist’s segmentation. DSCs comparing MRSI and MRF hotspots to the segmentation are listed below their respective maps.
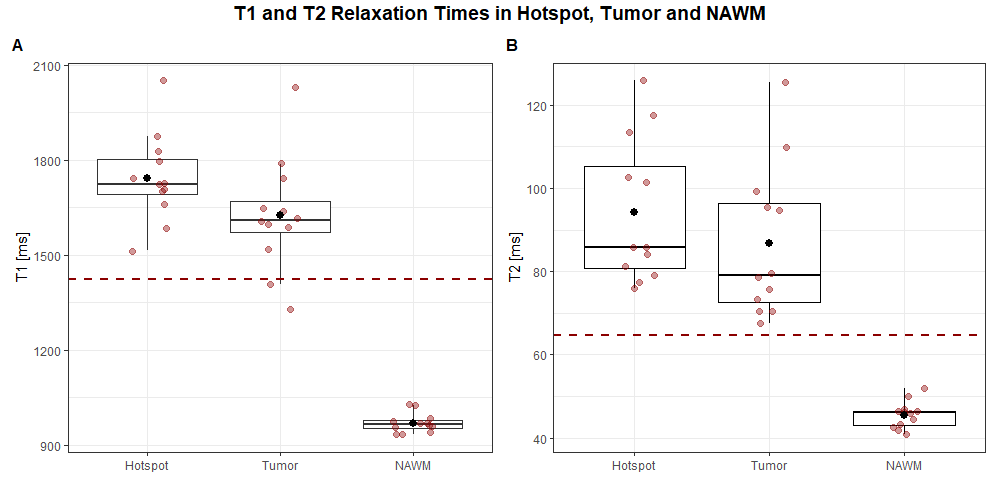
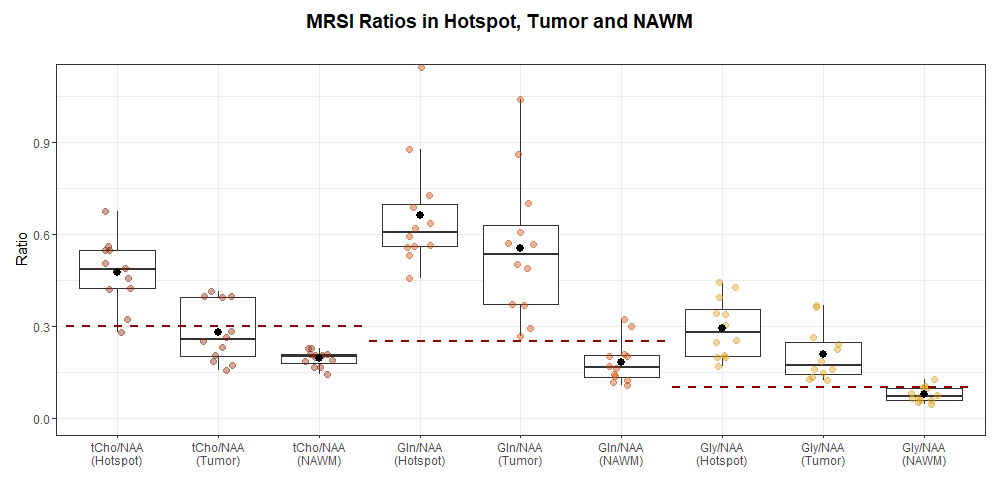
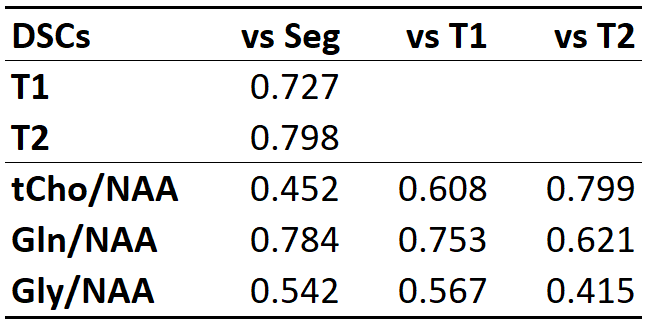
Table 1: Median Dice similarity coefficients between relaxation time hotspots, metabolite hotspots, and the clinical tumor segmentation.
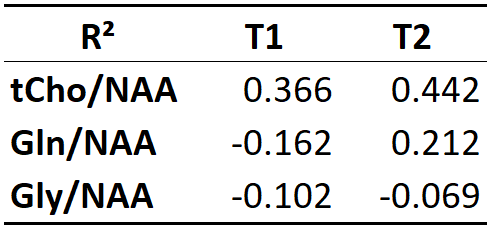
Table 2: Correlation coefficients of median values of different metabolite ratios and median T1 and T2 relaxation times within the tumor.