3859
Comparison of Magnetic Resonance Spectroscopy Data Acquired with Hybrid PET-MRI and Standalone MRI Scanners
Aditya Bhattacharya1, Benjamin B. Risk2, and Candace C. Fleischer3,4
1Neuroscience, Georgia Institute of Technology, Atlanta, GA, United States, 2Biostatistics and Bioinformatics, Emory University, Atlanta, GA, United States, 3Radiology and Imaging Sciences, Emory University School of Medicine, Atlanta, GA, United States, 4Biomedical Engineering, Georgia Institute of Technology and Emory University, Atlanta, GA, United States
1Neuroscience, Georgia Institute of Technology, Atlanta, GA, United States, 2Biostatistics and Bioinformatics, Emory University, Atlanta, GA, United States, 3Radiology and Imaging Sciences, Emory University School of Medicine, Atlanta, GA, United States, 4Biomedical Engineering, Georgia Institute of Technology and Emory University, Atlanta, GA, United States
Synopsis
Keywords: Spectroscopy, PET/MR
Magnetic resonance spectroscopy (MRS) is a powerful tool for quantifying metabolite concentrations, but spectral quality has not been thoroughly explored in hybrid MRI scanners. Using repeated measurements in a brain phantom and healthy volunteer, we determined the reproducibility and accuracy of MRS data on two systems, a hybrid GE PET-MRI (3.0 T) and Siemens 3.0 T MRI. Spectra acquired using the PET-MRI scanner produced metabolite concentrations with higher accuracy and lower variance across repeated measurements compared to the standalone MRI, suggesting spectral quality is not hindered by the hybrid system.Introduction
Hybrid magnetic resonance imaging (MRI) scanners such as positron emission tomography (PET)-MRI are making headway in the clinical setting, allowing for single-session scans containing both MRI and PET data. The MR component in PET-MRI scanners can be sensitive to hardware requirements related to the addition of a PET detector within the magnetic field.1,2,3 While the quality of MR data acquired using a hybrid versus standalone MR scanner is a concern, this has not been quantitatively evaluated, to the best of our knowledge, for PET-MRI scanners. More specifically, data quality of MR spectroscopy (MRS) acquired on hybrid PET-MRI systems has not been quantified. The goal of this study was to systematically evaluate MRS data quality acquired on both a standalone MRI scanner and a hybrid PET-MRI scanner to determine if MRS reproducibility and accuracy may be compromised in hybrid MR systems.Methods
MR data were acquired using a Siemens MAGNETOM Prisma 3.0 T MRI and GE SIGNA PET-MRI (3.0 T MRI) with similar capabilities (Siemens: 80 mT/m amplitude, 200 T/m/s slew rate; GE: 44 mT/m, 200 T/m/s slew rate; 60 cm bore for both). MRS data were acquired in vitro using the GE Braino phantom (12.5 mM of N-acetylaspartate [NAA], 10 mM of creatine, 3 mM of choline) and in a healthy human volunteer (28 year old male). MR spectra were acquired using the semi-localized by adiabatic selective refocusing (semi-LASER) sequence using the same parameters on both scanners: bandwidth 5000 Hz, TR/TE = 2000/68 ms, flip angle = 90°, transients = 32 (8 for non-water suppressed), data points = 2048, voxel size = 8 cm3, VAPOR flip angle = 80°, and semi-LASER refocusing flip angle = 150°.4 For in vitro studies, the phantom was placed in the scanner for two consecutive scans, removed and repositioned, and a new isocenter was set (Figure 1). This was repeated for 20 pairs of scans on both scanners. In vitro data was collected using the GE PET-MRI on two separate days due to scanner availability. In the healthy volunteer, MRS data were acquired in the posterior cingulate cortex using the same settings as in vitro acquisition. A T1-weighted image was used to position the MRS voxel. Two consecutive MR spectra were acquired, the subject was removed from the scanner and the isocenter was reset, followed by a second pair of scans. All in vivo MRS scans took place on the same day within ~3 hours.Spectra were fitted using LCModel from 4.0 to 0.2ppm.5 Quantitative metrics for comparison include peak full width at half maximum (FWHM), signal-to-noise ratio (SNR) of the NAA peak, and ratios of NAA and choline normalized to creatine. We examined the mean squared error (MSE) calculated as the mean of the squared difference between the estimated concentration and true concentration pooled across the twenty pairs of scans for each scanner. MSE was decomposed into squared bias (the difference between the average measured concentration across all measurements and the true concentration, squared) plus variance (mean of the squared difference between each measurement and the mean of the measurements) to disentangle the sources of errors (MSE=bias2+variance). A mixed model was used to evaluate variance of FWHM and SNR within session (pairs of scans) and between sessions for each scanner. Significance was determined by p≤0.05.
Results and Discussion
Representative MR spectra from in vitro and in vivo data acquisition are shown in Figure 2. For in vitro spectra, FWHM and SNR for repeated sessions are shown in Figure 3. The effect of ‘scan day’ for data acquired using the GE PET-MRI was not significant. Both within and between session variance in FWHM and SNR was lower for spectra acquired using the PET-MRI for all metrics except within session SNR variance, which was lower for spectra acquired using the standalone MRI. Metabolite ratios for repeated sessions are shown in Figure 4 and the MSE, bias2, and variance are reported in Table 1. MSEs for both choline and NAA were lower for spectra acquired using the GE PET-MRI, indicating higher accuracy of metabolite quantification. For data acquired using the PET-MRI, there was a small negative bias for both choline and NAA (Figure 4) with little variance between measurements (Table 1). For data acquired using the Siemens MRI, there was a higher variability between measurements and greater bias (Figure 4, Table 1). In vivo, there was no difference in FWHM and SNR within session for data acquired using the Siemens MRI, and SNR was higher for all spectra compared to the PET-MRI. For data acquired using the GE PET-MRI, SNR was stable but FWHM varied within and between session. The mean difference between calculated and true NAA ratios was less for data acquired on the PET-MRI compared to the standalone MRI (-0.05 and 0.13, respectively), but the opposite trend was observed for choline (-0.16 and –0.13, respectively). Overall, in vitro spectra acquired using the PET-MRI produced more accurate metabolite concentrations and less variance between sessions. These data suggest the hybrid PET-MRI system, and presence of the PET detector, does not degrade MR spectral quality; however, further evaluation in vivo and determination of effects related to scanner vendor is warranted.Acknowledgements
The authors would like to thank Sagar Mandava (GE) for assistance with data collection.References
1. Delso, G., Fürst, S., Jakoby, B., Ladebeck, R., Ganter, C., Nekolla, S. G., Schwaiger, M., and Ziegler, S. I. (2011). Performance measurements of the Siemens mMR integrated whole-body PET/MR scanner. Journal of Nuclear Medicine 52, 1914–22.2. Kolb, A., Wehrl, H. F., Hofmann, M. et al. (2012). Technical performance evaluation of a human brain PET/MRI system. European Radiology, 22, 1776–1788.
3. Musafargani, S., Ghosh, K. K., Mishra, S. et al. (2018). PET/MRI: A frontier in era of complementary hybrid imaging. European Journal of Hybrid Imaging, 2(1), 12.
4. Scheenen, T. W., Klomp, D. W., Wijnen, J. P., & Heerschap, A. (2008). Short echo time 1H-MRSI of the human brain at 3T with minimal chemical shift displacement errors using adiabatic refocusing pulses. Magnetic Resonance in Medicine, 59(1), 1–6.
5. Provencher, S. W. Estimation of metabolite concentrations from localized in vivo proton NMR spectra. Magnetic Resonance in Medicine,1993;30(1):672–679.
Figures
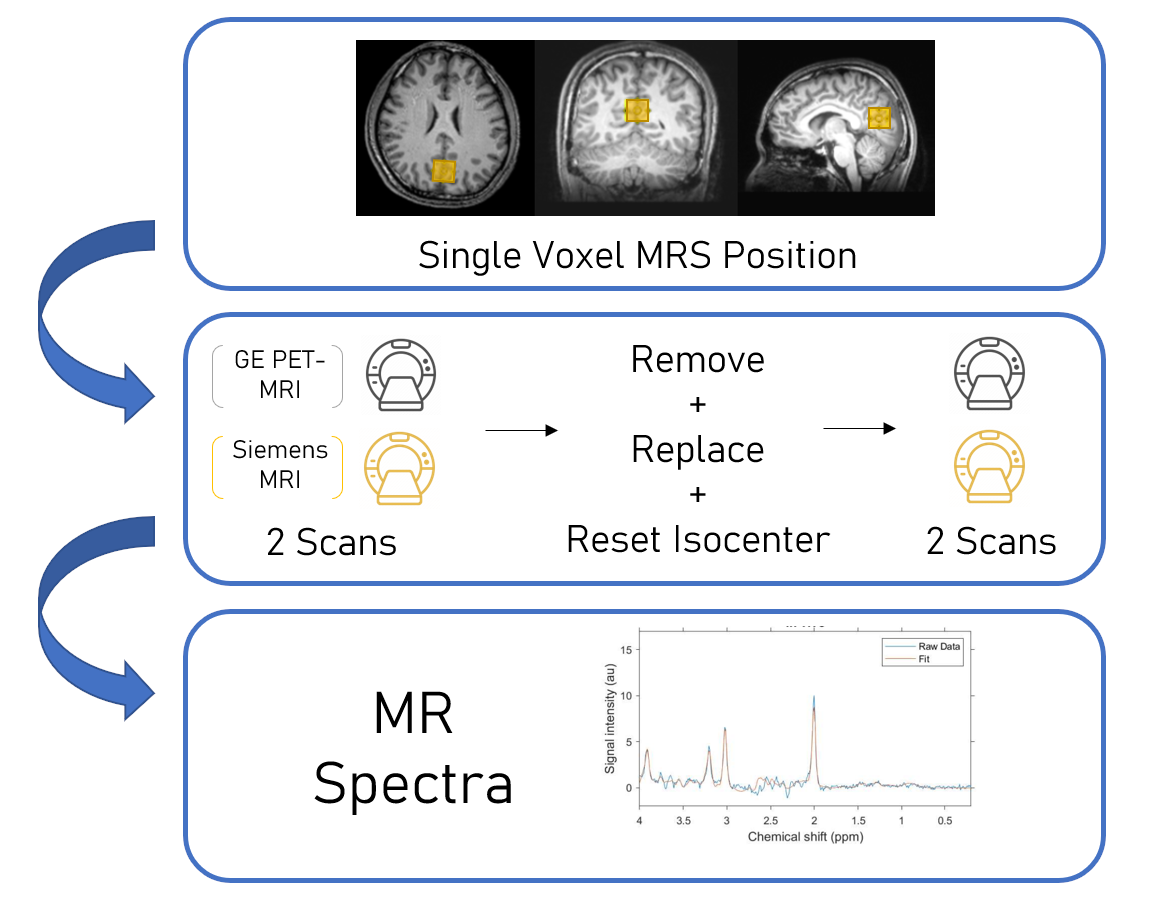
Figure 1. Schematic of overall study design. Single voxel MRS data were acquired in the isocenter of a brain phantom and in the posterior cingulate cortex in a healthy volunteer (yellow; top). Repeated MRS acquisition was performed using both a GE PET-MRI (3.0 T) and a Siemens 3.0 T MRI scanner (middle). MR spectra were analyzed using LCModel to evaluate reproducibility and accuracy (bottom).
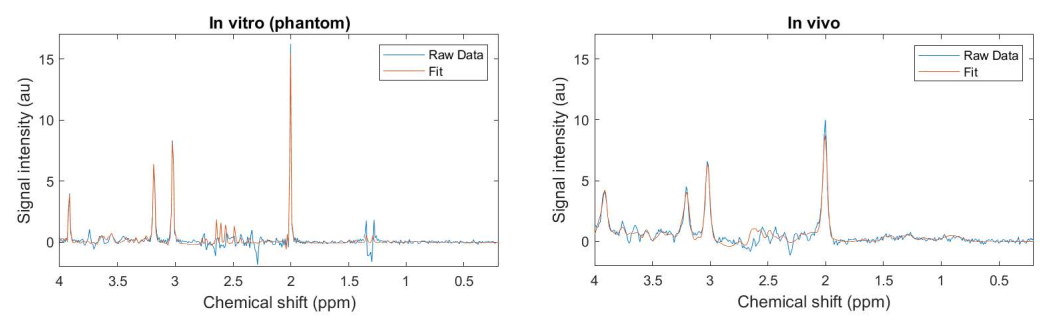
Figure 2. MR spectra acquired using a GE PET-MRI scanner in a brain phantom (left) and healthy volunteer in the posterior cingulate cortex (right) using the semi-LASER MRS sequence. Raw data (blue) as well as the fit obtained using LCModel (orange) are shown for both spectra.
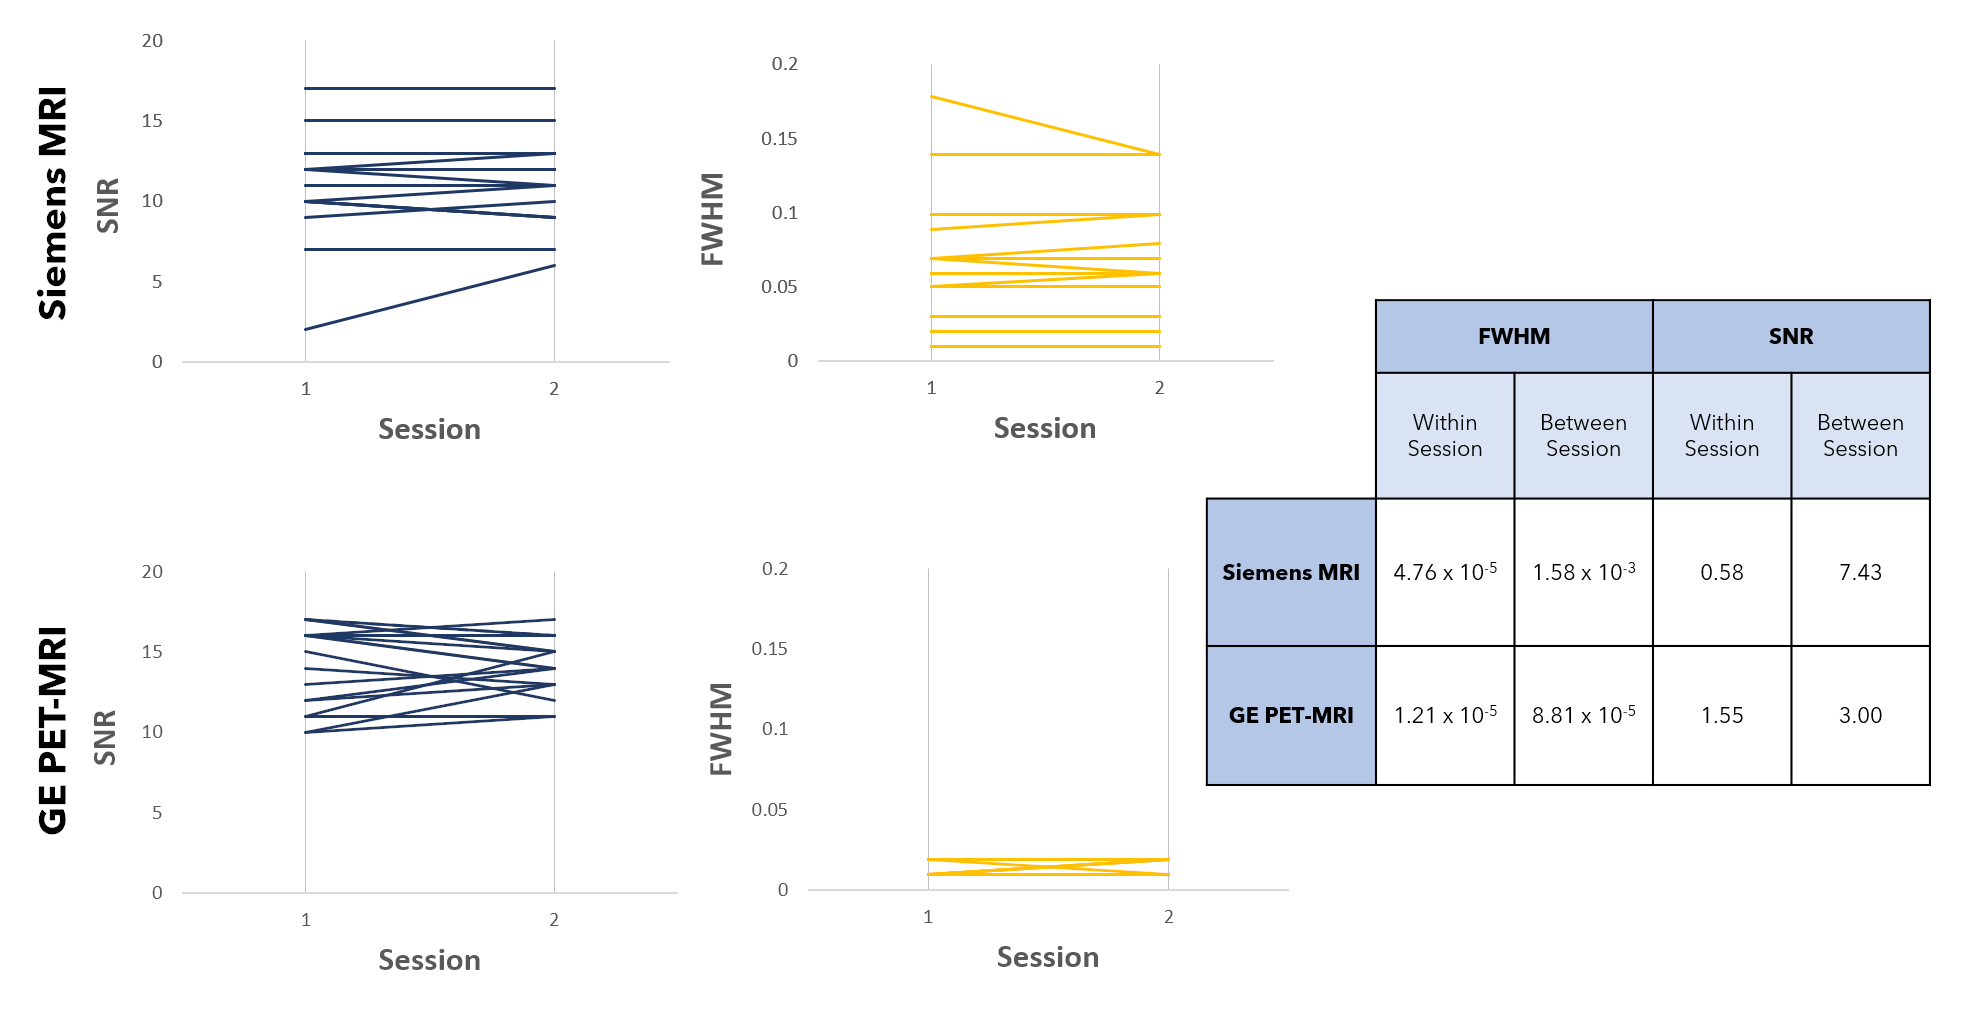
Figure 3. Comparison of signal-to-noise ratio (SNR) and full width at half maximum (FWHM) from repeated in vitro spectra acquired using a Siemens MRI (top) and GE PET-MRI (bottom). Each line represents a pair of repeated scans with a new isocenter. Within session and between session variance of FWHM and SNR, calculated using a mixed model, for spectra acquired on both the Siemens MRI and GE PET-MRI scanners are reported.
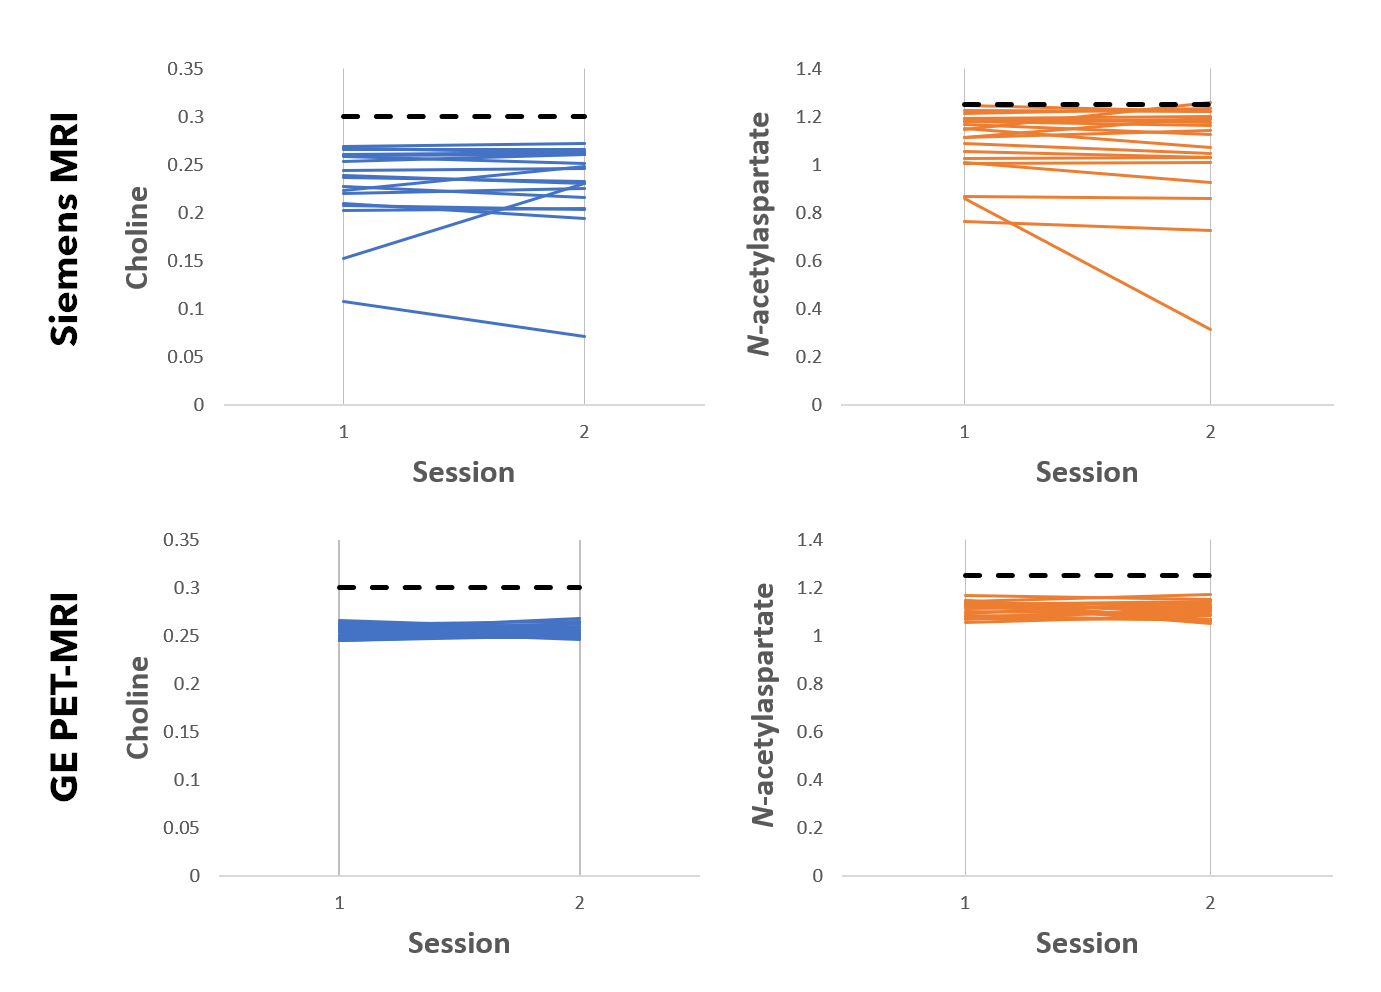
Figure 4. Comparison of metabolite ratios (normalized to creatine) from repeated in vitro scans acquired using a Siemens MRI (top) and GE PET-MRI (bottom). Known metabolite ratios present in the phantom are indicated with black dotted lines. Each line represents a pair of repeated scans with a new isocenter.
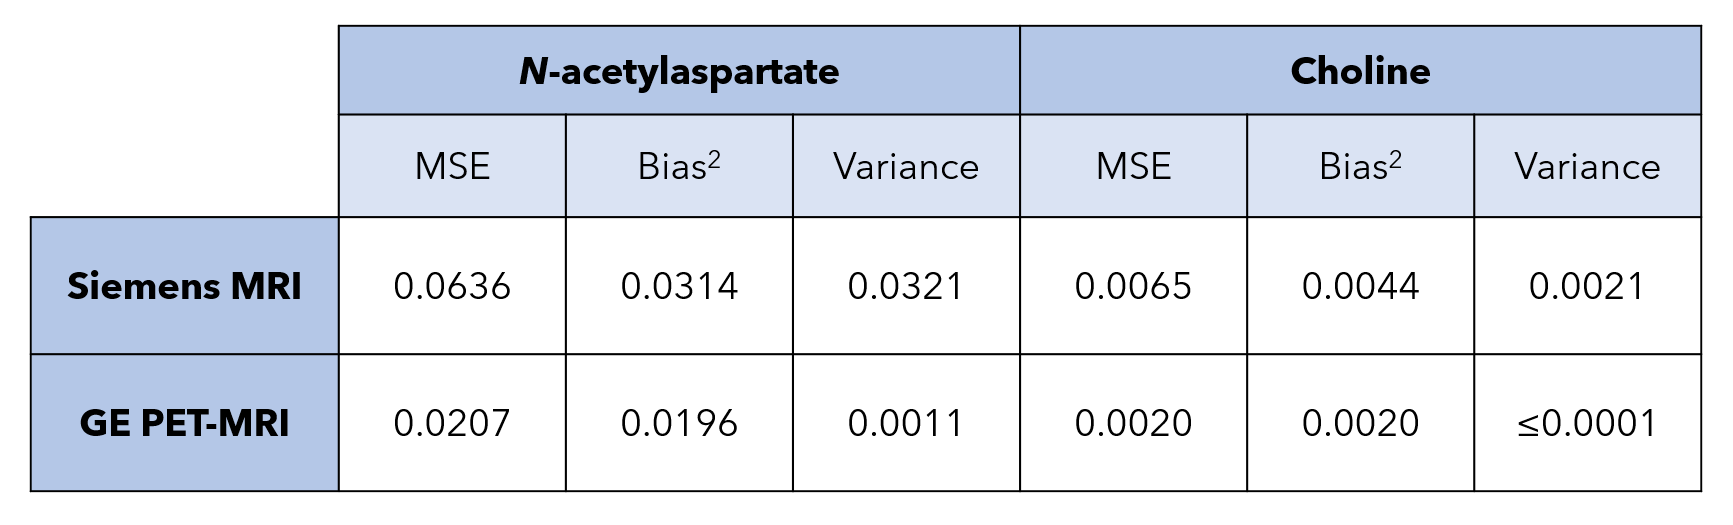
Table 1. Mean squared error (MSE), bias2, and variance of N-acetylaspartate and choline concentrations calculated from repeated spectra acquired on two scanners.
DOI: https://doi.org/10.58530/2023/3859