3858
Efficient Myocardial Spectroscopy combining Metabolite-Cycling with Respiratory Bellows at 3T1Ulm University Hospital, Ulm, Germany, 2Zurich University Hospital of Psychiatry, University of Zurich, Zurich, Switzerland, 3Institute of Forensic Medicine, University of Zurich, Zurich, Switzerland, 4Zurich University of Applied Sciences, Wädenswil, Switzerland, 5Core Facility Small Animal Imaging (CF-SANI), University of Ulm, Ulm, Germany
Synopsis
Keywords: Spectroscopy, Cardiovascular
Despite its diagnostic values1-4, the application of cardiac spectroscopy (CMRS) in clinical routine is generally limited by technical challenges and long scan times. A protocol for CMRS is proposed using metabolite-cycling, local, ECG-triggered shimming, ECG-triggering and a respiratory bellows. The protocol is evaluated in a volunteer cohort and provides myocardial triglyceride content (MTGC) quantification results that correlate well intrasession- (r=0.98, p<0.001) and intersession-wise (r=0.95, p<0.001). Thus, a good repeatibility and technical stability for the quantification of MTGC could be achieved with an average scan time of 440s at 3T.Introduction
MR spectroscopy (MRS) is a widely used tool to access metabolic information based on the chemical composition of localized volumes. In contrast to a biopsy, MRS allows for non-invasive tissue characterization. Correlations between concentrations of metabolites and diseases such as insulin resistance/diabetes or obesity have been found1-4, indicating MRS to be an early indicator for various diseases in specific patient groups3. MRI has become the gold standard for studying cardiac function, perfusion or myocardial structures. However, only minor metabolic information can be assessed by cardiac MRI3. To gain insight in the concentrations of metabolites cardiac MRS (CMRS) has been reported valuable. E.g. the myocardial triglyceride content (MTGC) can be increased due to obesity or impaired diastolic function and decreased due to hypertrophic and dilated cardiomyopathy. Additionally, an increased level of creatine (Cr) can be found e.g. in patients with chronic heart failure. However, long acquisition times and technical challenges such as the compensation of cardiac and respiratory motion impair a frequent and broader usage in a clinical setting5. Even though non-respiratory gated CMRS has been reported in combination with metabolite-cycling6 at 1.5T7, gating may still be demanded at higher field strengths. Often, many averages such as e.g. 512 averages8 are used to enhance SNR for a reliable quantification. However, this also leads to long acquisition times. This abstract suggests the combination of metabolite-cycling, local shimming and respiratory bellows for efficient CMRS. The proposed protocol is easy to implement, circumvents planning of a respiratory navigator and provides reliable quantification results of myocardial lipids, creatine and choline in the interventricular septum while keeping the scan duration within an acceptable range by using only 32NSAs.Methods
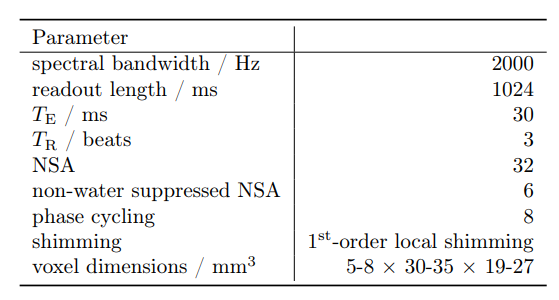
The proposed protocol for cardiac spectroscopy is based on a metabolite-cycled PRESS sequence in combination with ECG-triggering, first-order, ECG-triggered local shimming9,10 and F0-determination and respiratory gating (respiratory bellows). Furthermore, a volume-based power optimization8,11 was used to optimize the flip angle in the volume-of-interest (VOI). A cardiac trigger delay between 200-300ms was used to acquire data in the interventricular septum and to determine the shim coefficients, F0 and the power optimization in the systolic resting phase12. The VOI and shimming volumes were adapted to each volunteer. A repetition time of 3beats was chosen to ensure sufficient T1-relaxation of the metabolites and it was adapted to the cardiac frequency of each volunteer. For quantification, a water spectrum with about 8beats repetition time was used to eliminate possible T1-weighting. Detailed acquisition parameters are summarized in tab.1.The spectroscopy volume was planned using standard breath-held, retrospectively gated cine-images.
In total, nine healthy volunteers (male 7, female 2), with an average age of 26years and an average BMI of 22.7kg/m2, were investigated. All volunteers underwent the same protocol, which consisted of two subsequent scans, which were repeated after repositioning and subsequent planning leading to four spectra per volunteer. With this data, inter- and intrasession reproducibility was assessed.
Data analysis and post-processing was performed offline with a custom MATLAB (Natick, MA, USA) script and quantification was done with LCModel13 using the "muscle-5" option. Bland-Altman and correlation plots were used to assess intra- and intersession reproducibility. Additionally, the repeatability coefficient (RC) was calculated which provides a value for the difference of repeated measurements on the same volunteer with 95% probability14,15. All experiments were carried out on a Philips Ingenia 3.0T CX MRI with a 32-channel cardiac receive phased-array coil (Philips Healthcare, Best, NL).
Results
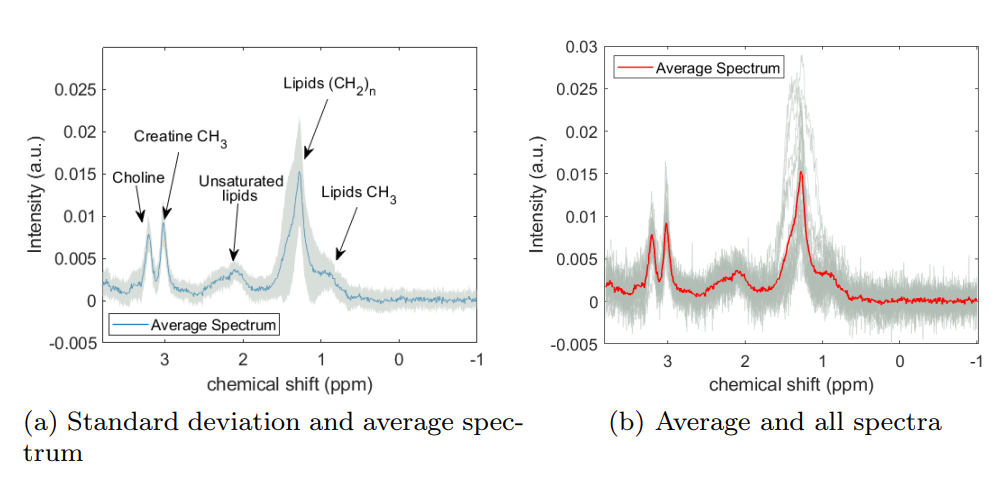
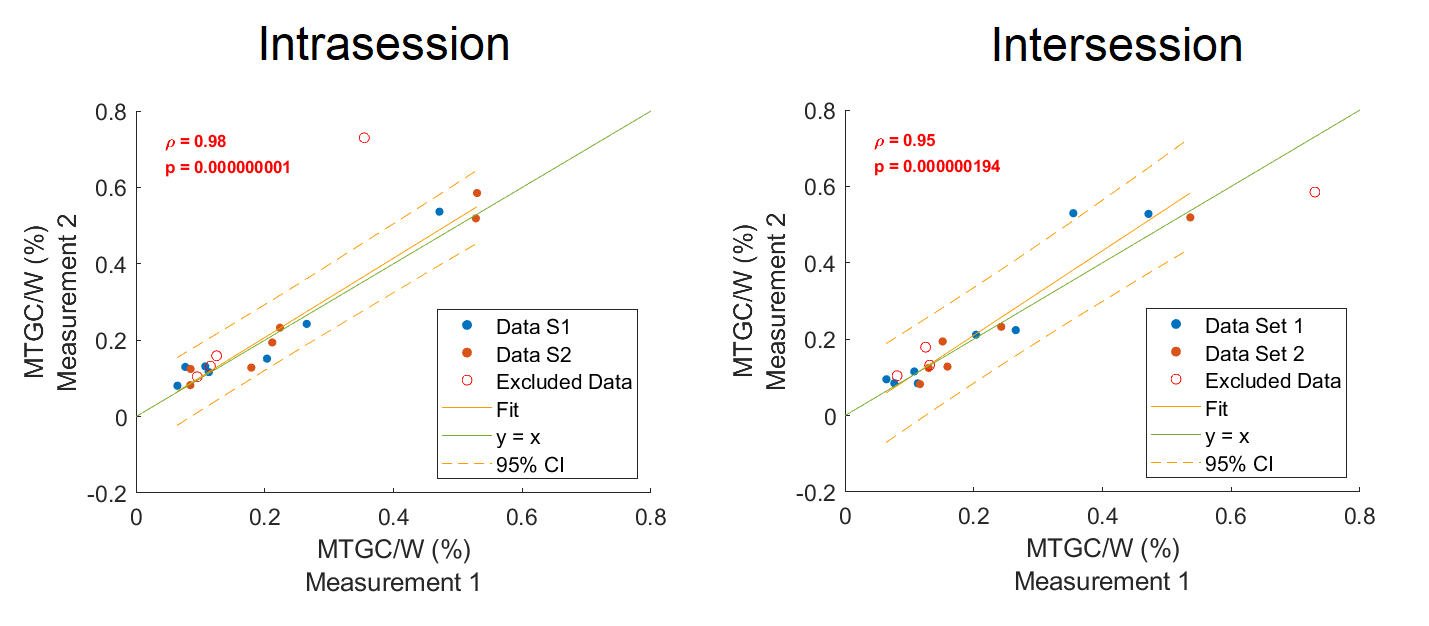
The scans could be successfully performed in all volunteers with a mean (± standard deviation (SD)) linewidth of water of (14±4)Hz. The mean scan time for one spectrum with 32NSAs was 440s including the preparation phase and six water-only spectra used as reference for quantification. The average spectra with corresponding standard deviation is shown in fig.1(a). The correlation plot for the intra- and intersession quantification results of MTGC is provided in fig.2 together with its Pearson's correlation coefficient and the corresponding p-value.Excellent interscan- (r=0.95;p<0.001) and intrascan-correlation (r=0.98;p<0.001) was obtained for MTGC. The intrasession RC is 0.073%, which is 33% of the mean MTGC (±SD), (0.22±0.17)%, of all volunteers. The intersession RC is 0.109%, which translates to 49% of the mean MTGC.
Moderate interscan- (r=0.56;p=0.04) and intrascan-correlation (r=0.48;p=0.08) was obtained for the creatine-water fraction. The intrasession RC is 0.017%, which is 49% of the mean creatine content (±SD), (0.036±0.008)%, of all volunteers. The intersession RC is 0.016%, which translates to 45% of the mean creatine content.
The average Cramér-Rao lower bound for the intramyocellular lipid methylene group was 4.4% and for the total creatine peak 8.3%.
Discussion
All results indicate that the protocol exhibits technical stability and reliability while reducing necessary scan durations. Metabolites such as lipids/MTGC, creatine but also choline are well quantifiable. The method is easy to implement and to use, which could lead to broader usage in a clinical environment. Reasons for the moderate correlation of the creatine concentrations can be manyfold. The remaining water residual, magnetization transfer but also physiological variations may have cause the observed variations. In a next step, the proposed method is tested in patients to evaluate the performance of the protocol in a clinical setting.Acknowledgements
The authors thank Paul de Heer for helpful discussions about CMRS and shimming. Furthermore, the authors thank the Ulm University Center for Translational Imaging MoMAN for its support. Technical support from Philips Healthcare is gratefully acknowledged.References
1. Hwang JH, Choi CS. Use of in vivo magnetic resonance spectroscopy for studying metabolic diseases. Exp Mol Med. 2015 Feb 6;47(2).
2. Szczepaniak LS, Babcock EE, et al. Measurement of intracellular triglyceride stores by 1H spectroscopy: validation in vivo. Am J Physiol. 1999 May;276(5):E977-89.
3. van Ewijk PA, Schrauwen-Hinderling VB, et al. MRS: a noninvasive window into cardiac metabolism. NMR Biomed. 2015 Jul;28(7):747-66.
4. Kankaanpää M, Lehto HR, et al. Myocardial triglyceride content and epicardial fat mass in human obesity: relationship to left ventricular function and serum free fatty acid levels. J Clin Endocrinol Metab. 2006 Nov;91(11):4689-95.
5. Holloway CJ, Suttie J, et al. Clinical cardiac magnetic resonance spectroscopy. Prog Cardiovasc Dis. 2011 Nov-Dec;54(3):320-7.
6. Dreher W, Leibfritz D. New method for the simultaneous detection of metabolites and water in localized in vivo 1H nuclear magnetic resonance spectroscopy. Magn Reson Med. 2005 Jul;54(1):190-5.
7. Peereboom SM, Gastl M, et al. Navigator-free metabolite-cycled proton spectroscopy of the heart. Magn Reson Med. 2020 Mar;83(3):795-805.
8. Fillmer, A., Hock, A., et al. Non-Water-Suppressed 1H MR Spectroscopy with Orientational Prior Knowledge Shows Potential for Separating Intra- and Extramyocellular Lipid Signals in Human Myocardium. Sci Rep 7, 16898 (2017).
9. Gruetter R. Automatic, localized in vivo adjustment of all first- and second-order shim coils. Magn Reson Med. 1993 Jun;29(6):804-11.
10. Gruetter R., Boesch C. Fast, noniterative shimming of spatially localized signals. In vivo analysis of the magnetic field along axes. J. Magn Reson 1992; 96(2): 323-334.
11. Versluis MJ, Kan HE, et al. Improved signal to noise in proton spectroscopy of the human calf muscle at 7 T using localized B1 calibration. Magn Reson Med. 2010 Jan;63(1):207-11.
12. de Heer P, Bizino MB, et al. Parameter optimization for reproducible cardiac 1 H-MR spectroscopy at 3 Tesla. J Magn Reson Imaging. 2016 Nov;44(5):1151-1158.
13. Provencher, S. W. Estimation of Metabolite Concentrations from Localized in Vivo Proton NMR Spectra. Magn Reson Med 30, 672–679 (1993).
14. Quantitative Imaging Biomarkers Allicance. Indices of Repeatability, Reproducibility, and Agreement. 2013 Apr.
15. Bakermans AJ, Boekholdt SM, et al. Quantification of Myocardial Creatine and Triglyceride Content in the Human Heart: Precision and Accuracy of in vivo Proton Magnetic Resonance Spectroscopy. J Magn Reson Imaging. 2021 Aug;54(2):411-420.
Figures