3857
Neurochemical profile of major depressive disorder in adolescents: 7 T MRS study1Center for Magnetic Resonance Research, University of Minnesota, Minneapolis, MN, United States, 2Department of Psychiatry and Psychology, Mayo Clinic, Rochester, MN, United States
Synopsis
Keywords: Spectroscopy, Psychiatric Disorders, Ultra-High Field 7 T, Adolescents, Neuro, Major Depressive Disorder
Major depressive disorder in adolescents (MDD) is a substantial public health problem. Existing treatments are often ineffective and do not target relevant neurobiological markers. It has been hypothesized that neurobiological mechanism underlying depression involves a dysfunction of the excitatory/inhibitory neurotransmitters. Here, the neurochemical profile from the occipital lobe of twenty adolescents with MDD and twenty-four age-matched healthy volunteers (HV) were acquired at 7 T. Larger SDs were observed for some metabolites in MDD versus HV and suggest heterogeneity of depression severity in the MDD cohort. Positive correlation in MDD between aspartate and GABA could be indicative of a neurotransmitter imbalance.Introduction
Major depressive disorder (MMD) in adolescents is a substantial public health problem and it increased with the onset of the COVID-19 pandemic1. Existing treatment approaches are often ineffective and do not target relevant neurobiological markers2. However, it has been hypothesized that the neurobiological mechanism underlying MMD involves a dysfunction of the neurotransmitters glutamate (Glu) and γ-aminobutyric acid (GABA)3. So far, 1H-MRS studies in patients with MDD have reported inconsistent results4-6, probably because findings are influenced by different regions of interest, magnetic field strengths, and MRS sequences. To the best of our knowledge, this is the first study, which compares the neurochemical profile from the occipital lobe of adolescents with MDD and age-matched healthy volunteers (HV) acquired at 7 T.Methods
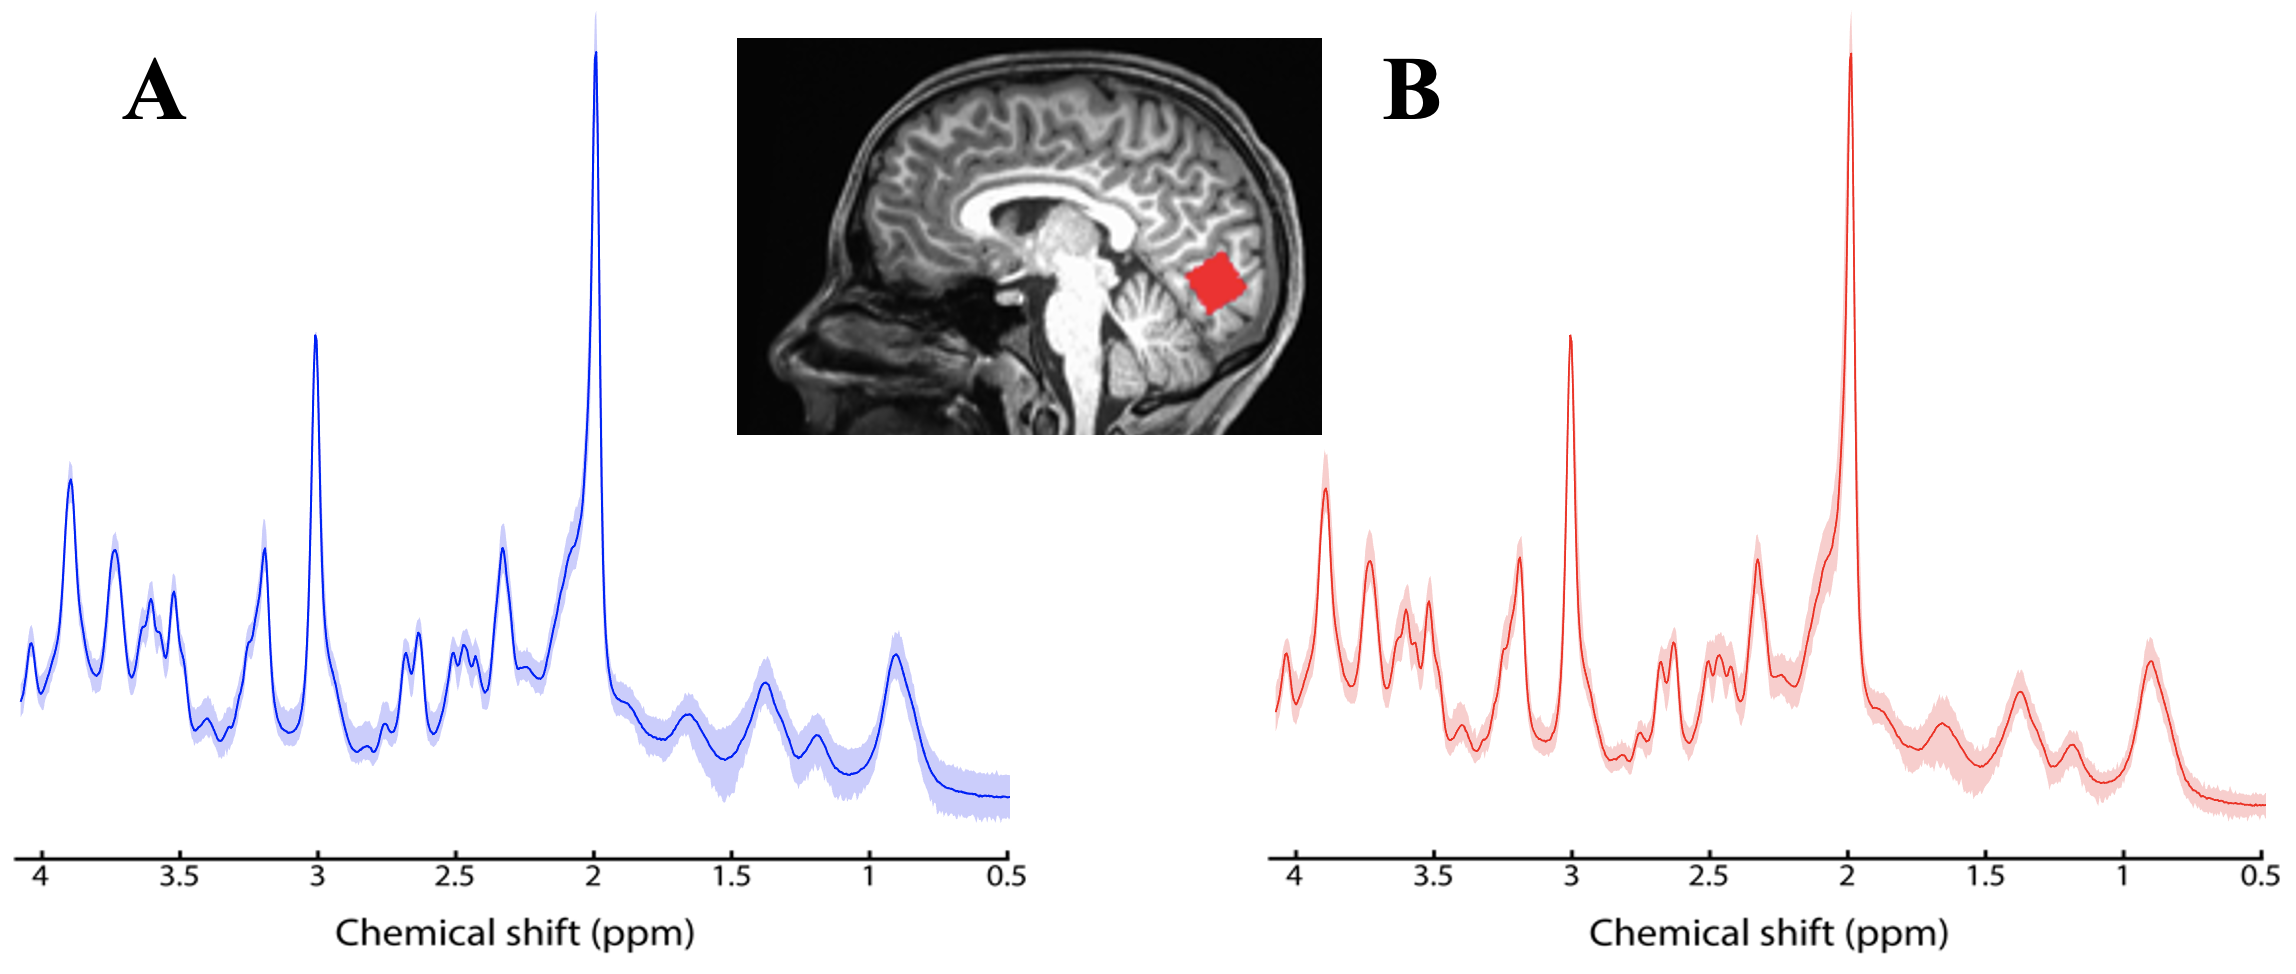
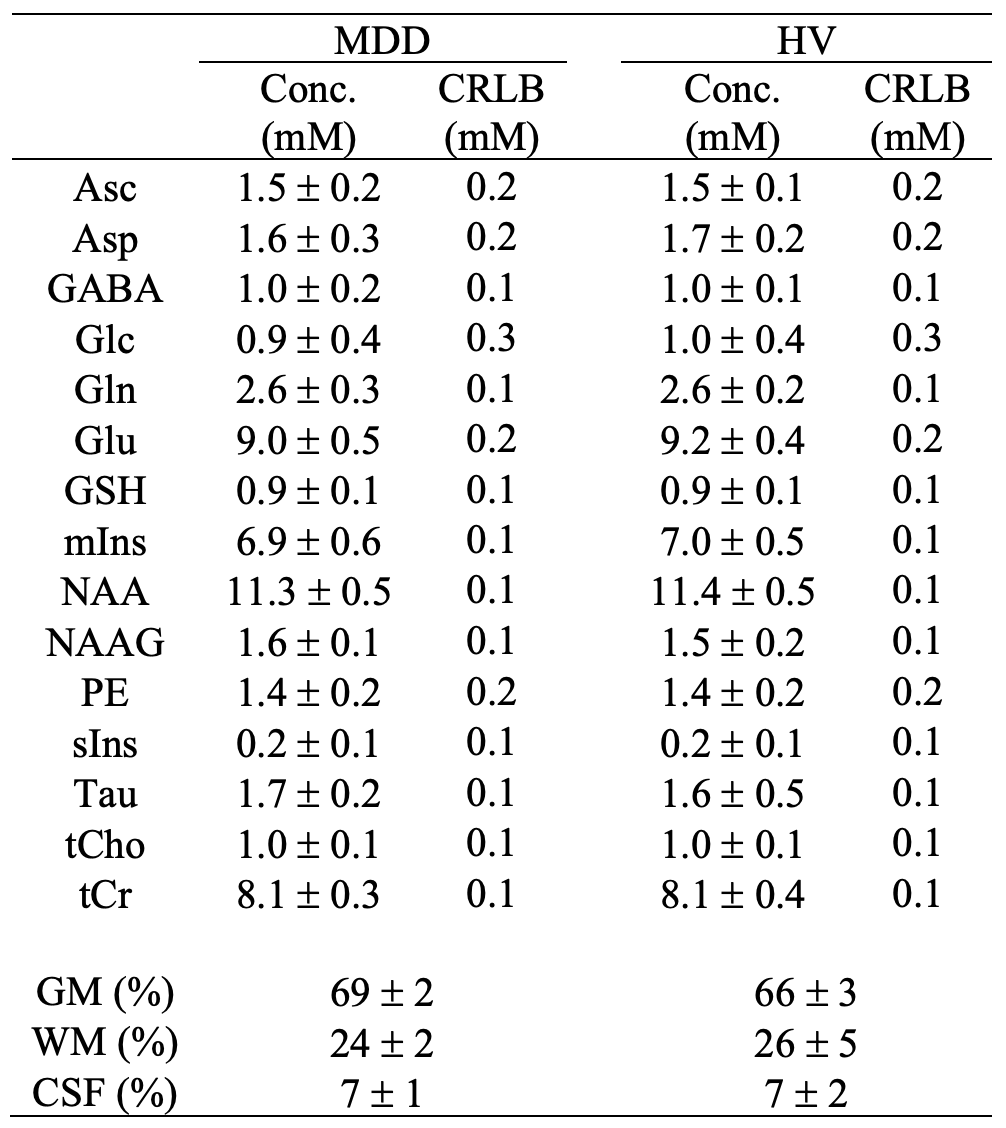
In-vivo spectra were acquired on 7 T system (Siemens, Syngo VB17, Erlangen, Germany) using a quadrature surface coil and an ultra-short STEAM sequence (TR = 5 s, TE = 8 ms, TM = 32 ms and 128 shots) in twenty-four MDD (mean ± standard deviation (SD): 16 ± 2 years; eleven men) and in twenty healthy volunteers (HV; 16 ± 2 years; nine men). B0 shimming of first- and second-order terms was performed in the VOI (2×2×2 cm3) using FAST(ESTMAP)7. The B1 field for the 90° pulse was calibrated for each subject.Spectra were individually saved (spectral width: 6 kHz; 2048 complex points) and post-processed with phase and frequency correction. Non-suppressed water spectra were acquired for eddy-current correction and as internal reference in LCModel8. With this experimental setup, the quantification of fifteen metabolites was achieved, including aspartate (Asp), GABA, Glu, glutamine (Gln), N-acetylaspartate (NAA), N-acetylaspartylglutamate (NAAG), and myo-inositol (mIns). Metabolite concentrations were corrected for gray matter (GM), white matter (WM), and cerebral spinal fluid (CSF) content. Unpaired t-tests were performed to assess which metabolites exhibited significant difference between MDD and HV. Pairwise correlations of metabolite concentrations were investigated in both groups.
Results
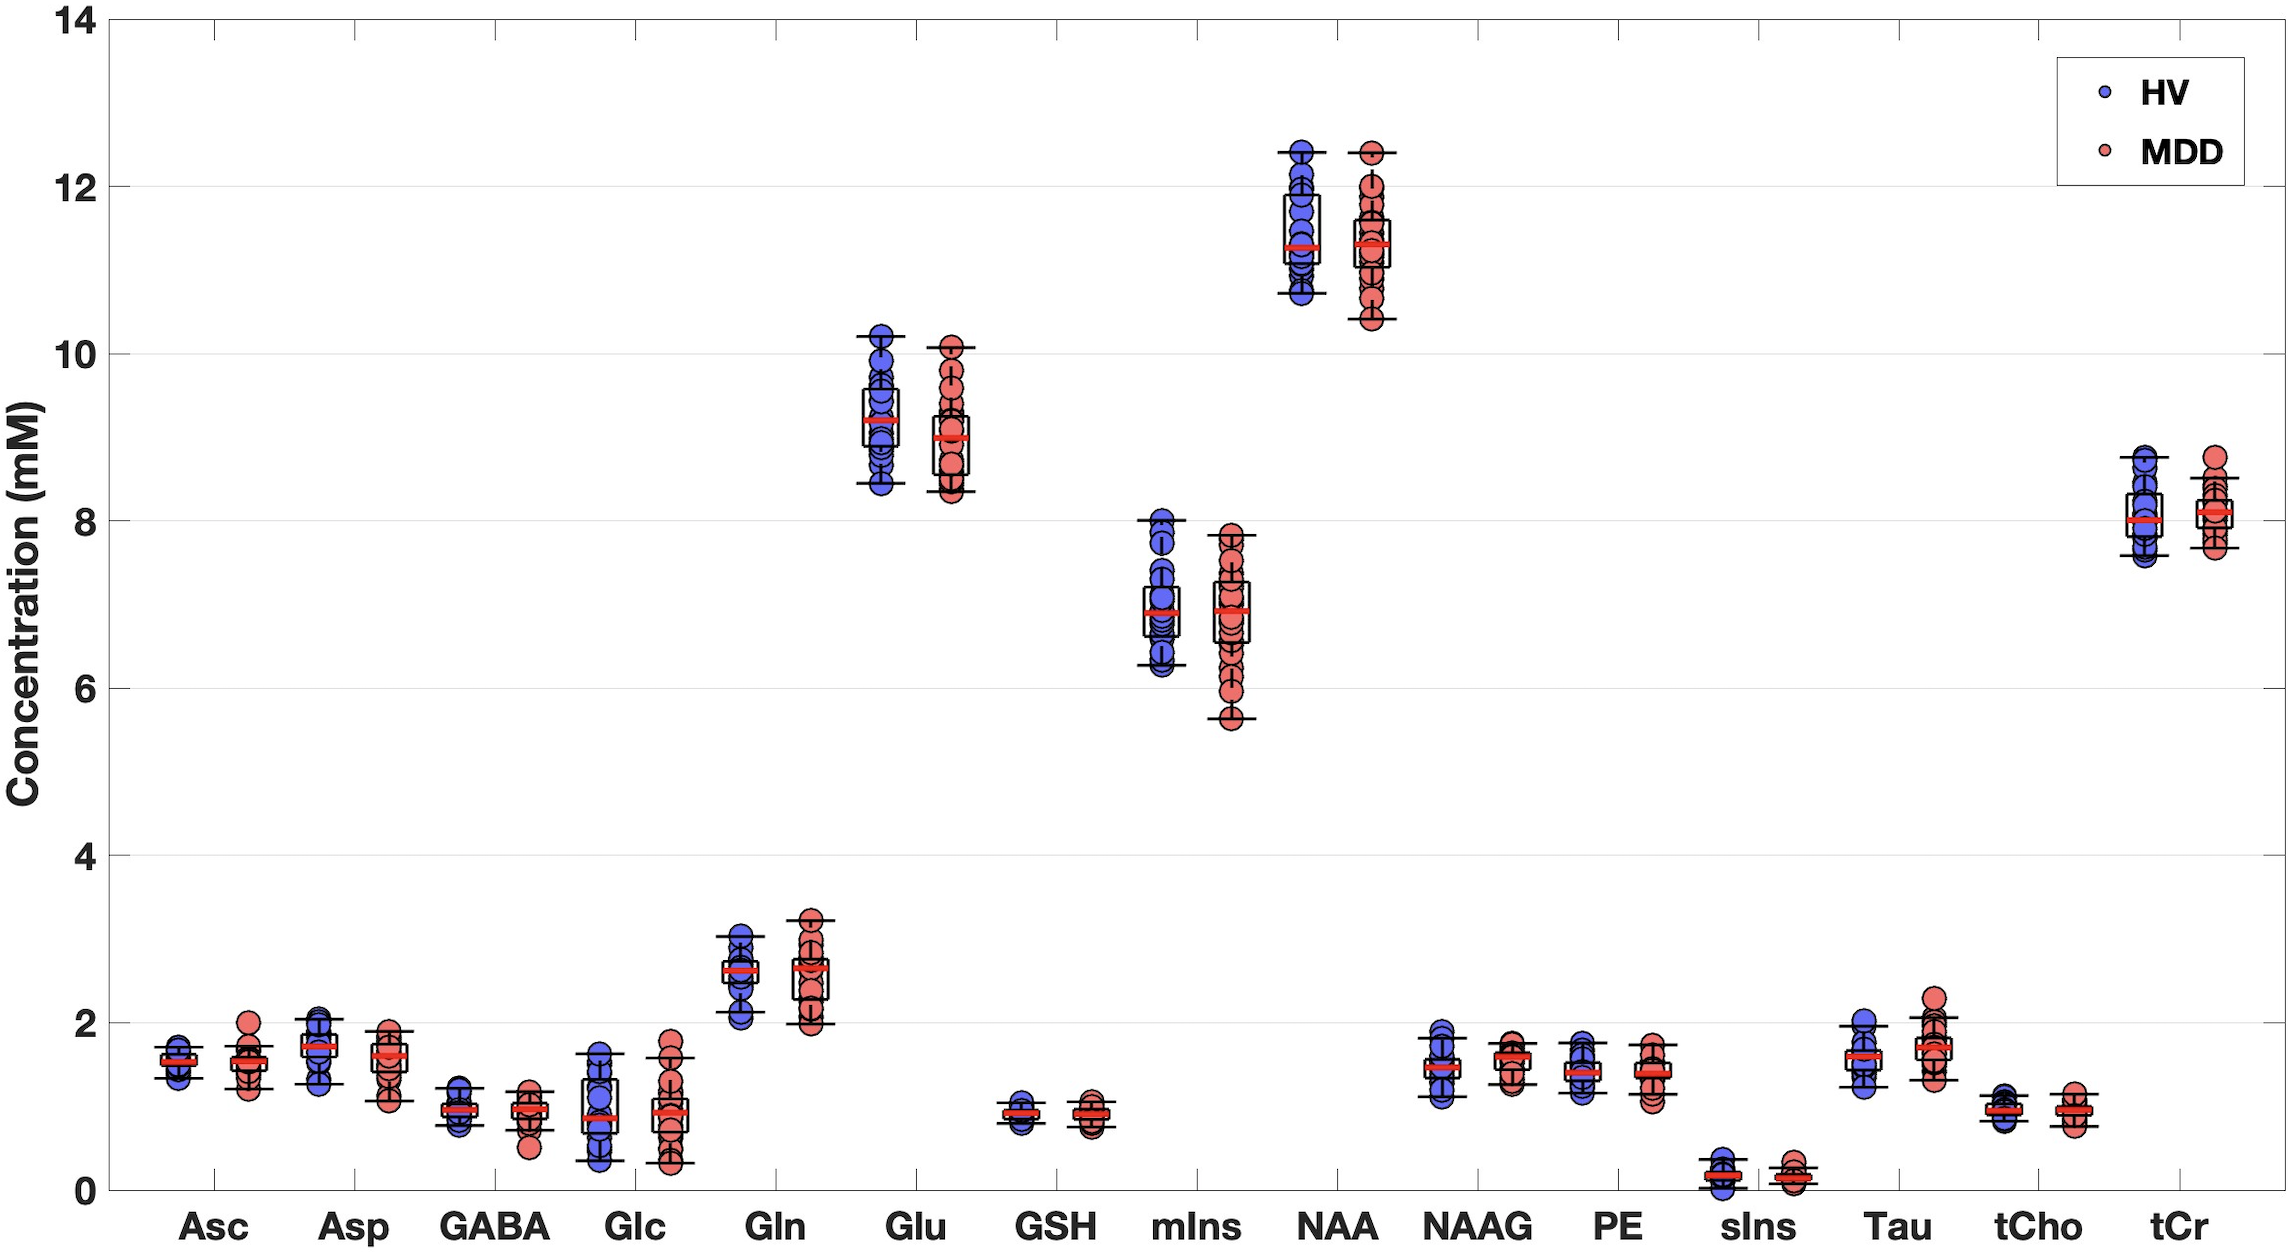
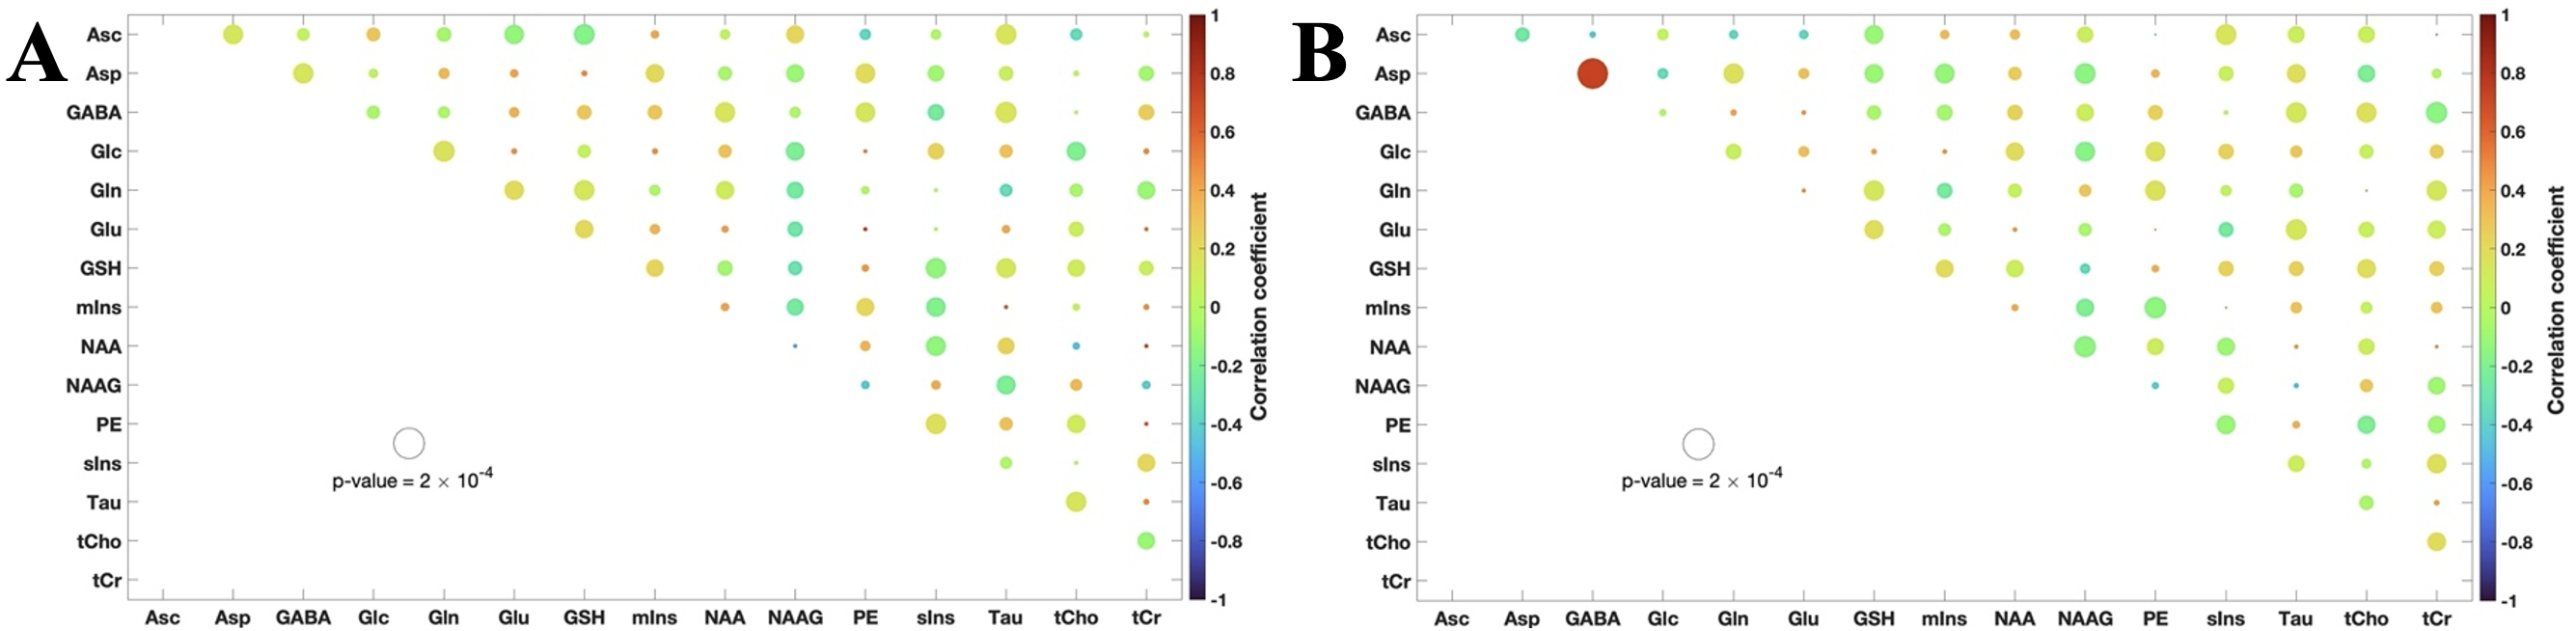
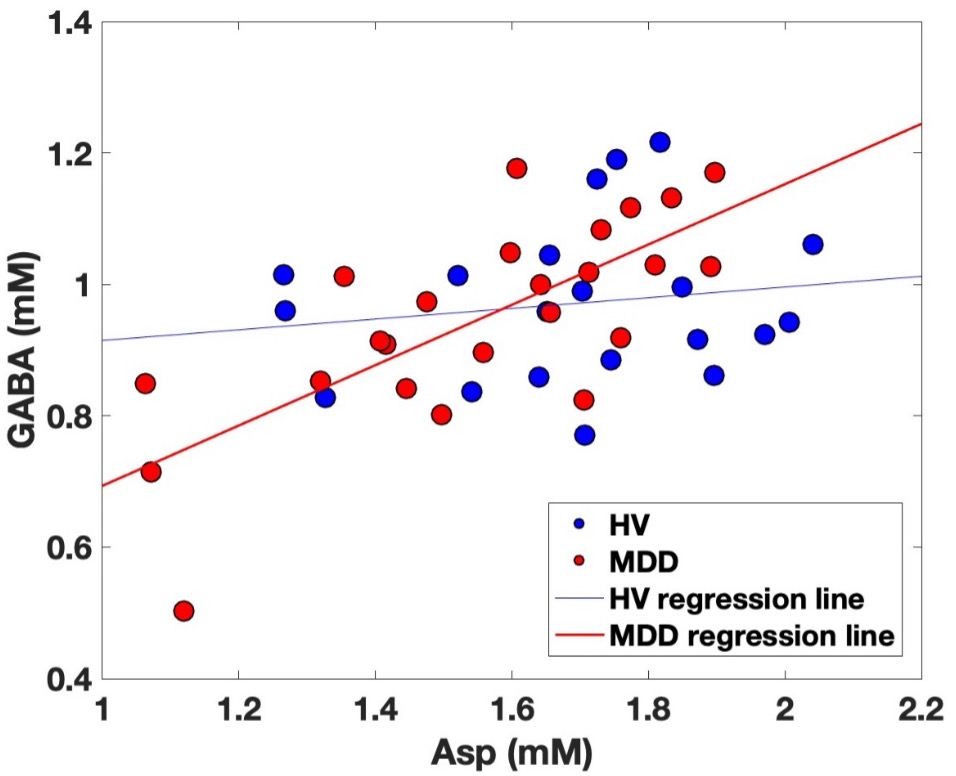
High signal-to-noise ratios (340 ± 60) and narrow linewidths (12 ± 1 Hz) were obtained in both groups (Figure 1). No thresholds based on Cramer-Rào lower bounds (CRLBs) of metabolites were used9. No significant differences were observed between groups (Table 1). However, larger group standard deviations (SDs) in MDD versus HV were observed for different metabolites (Figure 2), including GABA (~21%), Gln (~28%), and mIns (~12%).In Figure 3, the pairwise-correlation matrixes are reported for both groups. After Bonferroni corrections for multiple comparison (p = 0.05/210 ≈ 2 × 10⁻⁴, where 210 was the number of the investigated correlations), a significant correlation between Asp and GABA in MDD (Figure 4; p = 5 × 10⁻⁵) was observed.
Discussion
Larger SDs, and larger range of concentrations, observed for many metabolites in MDD versus HV could be due to a more heterogeneous cohort of the MDD group. In previous work, variations of Gln + Glu (Glx) were correlated to the severity of the clinical outcome of depression (i.e., Hamilton Depression Rating scale)10. Glx differences were also observed between MDD with and without suicidal ideation11. Also, correlation between mIns and the Maryland Trait and State Depression score was previously observed12.The significant positive correlation between Asp and GABA observed exclusively in MDD may be indicative of an imbalance between excitatory and inhibitory neurotransmitters. Indeed, Asp is an excitatory neurotransmitter13, and it is involved in both GABAergic and glutamatergic metabolism14.
Conclusion
Although significant metabolites concentration differences between MDD and HV were not observed, both larger SDs of GABA, Gln, and mIns, and the positive correlation in MDD between Asp and GABA could be indicative of an altered GABAergic and glutamatergic metabolism. Also, Asp may be an interesting marker to investigate in MDD.Acknowledgements
The authors thank Alicia Herman, Sarah Bedell, Theresa Whitney, Wendy Elvendahl and Matthew White for help with the study;
Funding: NIH grant number R01MH113700.
References
[1] L Lebrun-Harris et al., JAMA Pediatr. (2022), doi: 10.1001/jamapediatrics.2022.0056.
[2] D Warden et al., Curr. Psychiatric Rep. (2007), doi: 10.1007/s11920-007-0061-3.
[3] W Shamseddeen et al., J. Am. Acad. Child. Adolesc. Psychiatry (2011), doi: 10.1016/j.jaac.2010.11.019.
[4] P Bhattacharyya et al., Front. Psychiatry (2021), doi: 10.3389/fpsyt.2021.665347.
[5] J Levitt et al., J. Psychiatry Neurosci. (2019), doi: 10.1503/jpn.180230.
[6] J Evans et al., AMCN (2018), doi: 10.1038/s41386-018-0057-1.
[7] R Grutter et I Tkác, Magn. Res. Med. (2006), doi: 10.1002/(SICI)1522-2594(200002)43:2<319::AID-MRM22>3.0.CO;2-1.
[8] SW Provencher, Magn. Res. Med. (1993), doi: 10.1002/mrm.1910300604.
[9] R Kreis, Magn. Res. Med. (2016), doi: 10.1002/mrm.25568.
[10] DI Horn, Front. Syst. Neurosci. (2010), doi: 10.3389/fnsys.2010.00033.
[11] CP Lewis, Transl. Psychiatry (2020), doi: 10.1038/s41398-020-0792-z.
[12] J Chiappelli, Neuropsychopharmacology (2015), doi: 10.1038/npp.2015.57.
[13] M Patri, IntechOpen (2018), doi: 10.5772/intechopen.82121.
[14] A Sarawagi, Front. Psychiatry (2021), doi: 10.3389/fpsyt.2021.637863.
Figures