3855
A Magnetic Resonance Spectroscopy Method in Characterization of Urine Metabolomics for Prostate Cancer1Massachusetts General Hospital, Harvard Medical School, Boston, MA, United States, 2Massachusetts General Hospital, Boston, MA, United States
Synopsis
Keywords: Spectroscopy, Prostate, Metabolomics
Currently, Prostate Cancer (PC) diagnosis is achieved either through invasive measures, like biopsies, or imaging techniques, such as sonography, CT, and MRI. The biomarker PSA in blood is used for screening, however its use is considered controversial. It doesn’t show to reduce PC all-cause mortality and PSA screening comes with a high number of false-positive results and associated risks. Here, using HRMAS MRS, we studied human urine samples obtained from prostate cancer patients and healthy controls to reveal potential PC-associated metabolomic changes, which may assist with early and non-invasive PC diagnosis and screening.Introduction
Prostate Cancer (PC) ranks among the cancers highest in incidence and mortality. According to the GLOBOCAN 2020, it is the second most frequent cancer and the fifth leading cause of cancer death in men. Worldwide, there were almost 1.4 million new cases and 375,000 deaths in 2020 [1]. The cause of PC is not yet fully determined, but it is considered a result of a combination of genetic, environmental, and lifestyle factors such as obesity, high alcohol consumption, chronic pancreatitis, and type 2 diabetes.Currently, invasive diagnostic methods like digital rectal examination and biopsies or imaging like sonography, CT, or MRI are necessary for PC diagnosis. It remains a challenge to detect PC early on, leading to more severe disease. PSA blood levels are the gold standard for PC screening. However, its ability to reduce prostate cancer all-cause mortality and the risks that come with a high number of false-positive results make it a controversial screening marker [2 – 4].
Urine is a promising diagnostic fluid. It is noninvasive in its acquisition, low in cost and requires minimal time-demand. The overall metabolic status, or metabolomics, of the prostate and other organs must alter in PC patients, moving from the normal homeostasis of healthy individuals to states likely to precede the formation of PC pathologies. For this reason, discovering and understanding PC-associated metabolomic changes in prostate through urine may assist with PC early and definitive diagnosis and elucidate further mechanisms of pathogenesis.
Currently, the major methodologies used in PC metabolomic investigations have been mass spectrometry (MS) and MR spectroscopy (MRS). The development of high-resolution magic angle spinning (HRMAS) MRS for intact tissue analysis further enhanced MRS capability in evaluating blood specimens. The HRMAS method is capable of producing high resolution spectra from urine samples requiring only minimal fluid volumes.
Methods
The study was approved by the Massachusetts General Hospital IRB. A total of 40 human urine samples from 40 PC patients (n=20; Age 61.7±6.8) and non-PC subjects (n=20; Age=63.55±7.9) were obtained. All 40 individual samples were kept at -80°C. Before MRS measurements, all samples were allowed to thaw for approximately an hour on ice. After being vortexed, 10 μL of the sample was added to the rotor in addition to 2 μL of D2O. HRMAS MRS data were collected on a Bruker AVANCE III HD 600MHz instrument, at 4ºC, with a spinning rate of 3600 Hz, and with a rotor synchronized CPMG method. Spectra analyzed with Bruker Topspin 3.6.2 identified 49 common spectral regions among the individual samples. Statistical analyses on these regions were carried out on JMP from SAS. This includes univariate analysis according to Student’s t-test, or ANOVA (for normally distributed and equal variance data), Welch test (for normally distributed and unequal variance data), and Wilcoxon/Kruskal–Wallis test (KWW, for non-normally distributed data), as well as unsupervised multivariate principal component analysis (PCA).Results
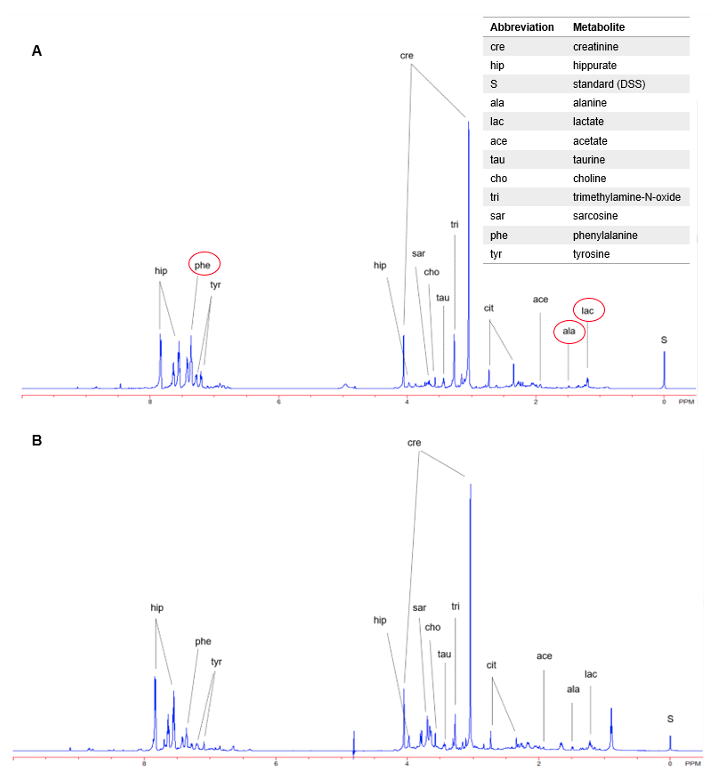
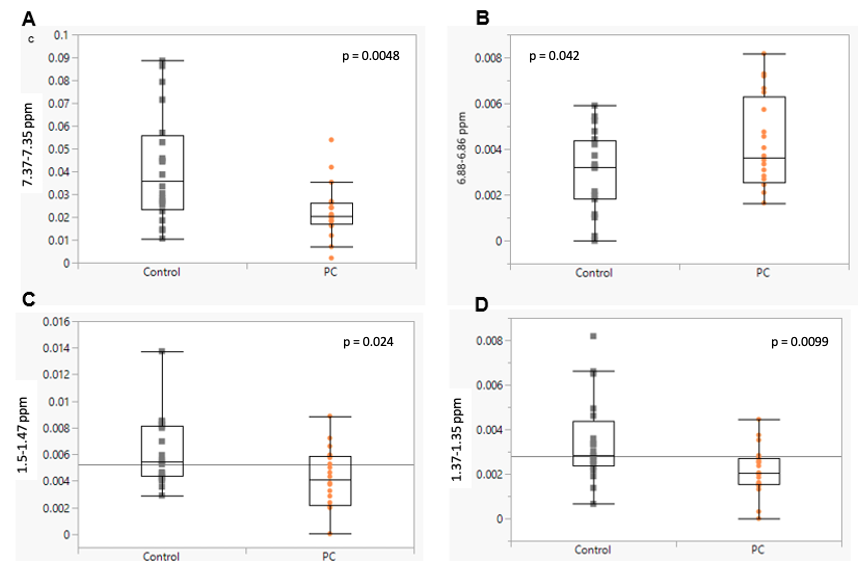
HRMAS 1H-NMR metabolic profiles provide the opportunity to identify and quantify metabolites based on analyzing chemical shift, coupling constant and shapes of peaks from NMR experiments. The region at 0.0–3.10 ppm shows aliphatic compounds that include signals from organic acids and amino acids, such as L-alanine, citrate, pyruvate, succinate, and L-lactate. The region at 5.5–9.5 ppm shows aromatic compounds, such as hippurate, phenylalanine and tyrosine, downshifted due to the adjacent carboxy group (Fig. 1). Statistical testing using univariate analysis according to Student’s t-test identified four regions that can significantly distinguish PC from nonPC patients. The regions between 1.37-1.35 ppm, 1.5-1.47 ppm and 7.37-7.35 ppm were decreased in the PC compared to control group, while the region between 6.88-6.86 ppm has shown an increase (Fig. 2). More detailed analyses are still underway.Discussion & Conclusion
It is to be noted that all regions may be contributed to by different metabolites and the other way around, and that metabolites may present in different spectral regions. Nevertheless, three of the analyzed regions can be attributed to alanine, lactate, and phenylalanine. Alanine and lactate concentrations were significantly lower in urine samples of PC patients compared with the control. Notably, this aligns with the recent (2021) findings of Yang et al., who found guanidinoacetate, phenylacetylglycine, and glycine to be upregulated, while L-alanine and L-lactate were downregulated in PC patients [5].The preliminary study to evaluate the ability of HRMAS MRS in the investigation of PC-associated metabolomics in human blood serum, out results present the significant potential for further research with this approach. In addition, some of the metabolites or metabolic profiles can be subject to further investigation as screening panels to find new screening biomarkers.
Acknowledgements
This study is supported in part by NIH grants CA115746, CA273010, and by MGH Martinos Center for Biomedical Imaging.References
1) Sung H, Ferlay J, Siegel RL, Laversanne M, Soerjomataram I, Jemal A, Bray F. Global Cancer Statistics 2020: GLOBOCAN Estimates of Incidence and Mortality Worldwide for 36 Cancers in 185 Countries. CA Cancer J Clin. 2021 May;71(3):209-249.
2) Schröder FH, Hugosson J, Roobol MJ, et al; ERSPC Investigators. Screening and prostate cancer mortality: results of the European Randomised Study of Screening for Prostate Cancer (ERSPC) at 13 years of follow-up. Lancet. 2014;384(9959): 2027-2035.
3) Schröder FH, Hugosson J, Carlsson S, et al. Screening for prostate cancer decreases the risk of developing metastatic disease: findings from the European Randomized Study of Screening for Prostate Cancer (ERSPC). Eur Urol. 2012;62(5): 745-752.
4) Martin RM, Donovan JL, Turner EL, et al; CAP Trial Group. Effect of a low-intensity PSA-based screening intervention on prostate cancer mortality: the CAP randomized clinical trial. JAMA. 2018;319(9):883-895
5) Yang, Zhang, C., Cheng, S., Li, G., Griebel, J., & Neuhaus, J. (2021). Novel Metabolic Signatures of Prostate Cancer Revealed by 1H-NMR Metabolomics of Urine. Diagnostics (Basel), 11(2), 149.
Figures