3854
Slope of the spectrum of low-frequency BOLD signal relation to the connectivity strength
Kazuhiro Nakamura1 and Toshibumi Kinoshita1
1Research Institute for Brain and Blood Vessels Akita, Akita, Japan
1Research Institute for Brain and Blood Vessels Akita, Akita, Japan
Synopsis
Keywords: fMRI (resting state), fMRI (resting state), spectrum analysis
For the valuation of BOLD fluctuations, we have investigated the slope of the spectrum (SLOPE) to exclude the respiratory and heartrate fluctuation. Functional connectivity (ROI to ROI) was evaluated by Conn v19.b software. The SLOPE was evaluated in the frequency range of 0.01 – 0.1Hz. Maximum connectivity in each ROI correlated well with the value of SLOPE, but the mean connectivity did not. Therefore, it will be possible to evaluate the strength of connectivity of rs-fMRI by evaluating SLOPE.Introduction
Low frequency BOLD fluctuations in the range 0.01-0.1 Hz are thought to reflect spontaneous neural activity. Therefore, fractional amplitude of low-frequency fluctuations(fALFF) is used for neuronal activity evaluation in resting state functional MRI (rs-fMRI)1. In fALFF, respiratory components and heartrate fluctuation components such as Mayer waves are also evaluated as low-frequency fluctuations. By using the slope of the spectrum (SLOPE), it might be possible to exclude the effect. Even in the electrical neuronal activities, fluctuations in low frequency depend on the state of consciousness such as sleep-wake cycles2. We have therefore preformed the spectral analyses for spontaneous BOLD signal change in healthy volunteers and evaluate the relation between the SLOPE and functional connectivity.Materials & Methods
Thirty healthy volunteers were evaluated. MRI was examined with a 3T MRI. Five minutes of rs-fMRI was performed by GRE-EPI sequence (TR/TE=2500/30ms, resolution 3×3 mm2). Functional connectivity (ROI to ROI) was evaluated by Conn v19.b software with MATLAB3. For individual ROI analysis, segmentation was processed by the Freesurfer v6.0 using anatomical T1-weighted image acquired by 3D MPRAGE sequence. ROI was selected using Destrieux atlas in Freesurfer (aparc.a2009s). Subject motion correction, slice timing correction, coregistraion and smoothing (8×8 mm) were calculated by Conn. The time series data analysis for power spectrum was evaluated home-made program in MATLAB software. The SLOPE was evaluated in the frequency range of 0.01 – 0.1Hz. The SLOPE was calculated by a logarithmic least-mean-square line fitted to the spectrum.Results
A typical spectrum in the healthy volunteer was shown in figure 1. The SLOPE was evaluated in the frequency range of 0.01 – 0.1Hz. For the connectivity evaluation, the maximum and mean z-values for functional connectivity between 146 ROIs in the cortex region defined by freesurfer were used . For 30 volunteers, the mean z-value of the ROI to ROI analysis in functional connectivity was 0.194 ± 0.009 and the maximum z-value was 0.944 ± 0.028. The SLOPE value for each ROI was 0.633±0.046. Relation between z-value in ROI to ROI analysis and the SLOPE value in each ROI was shown in figure2. Maximum connectivity in the each ROI correlated well with the value of SLOPE, but the mean connectivity did not.Discussion
The maximum value of connectivity correlated well with the value of SLOPE. It has been reported that the slope of the spectrum is related to the strength of coupling of the neural network, and that the slope increases when the coupling is strong2. Therefore, it is reasonable that the value of SLOPE correlated with the maximum value of connectivity. From this result, it will be possible to evaluate the strength of connectivity of rs-fMRI by evaluating SLOPE.Acknowledgements
No acknowledgement found.References
1. QH Zou et al., J Neurosci Methods 172; 2008: 137-141 2. K Nakamura et al., Sleep Research Online 3; 2000: 147-154 3. SW Gabrieli et al., Brain Connectivity,doi:10.1089/brain.2012.0073Figures
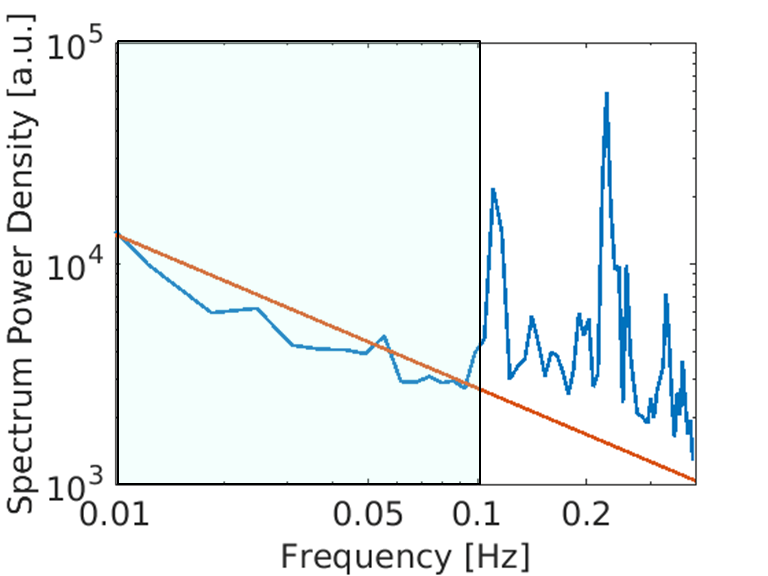
A typical spectrum in the healthy volunteer. Red line indicates the
estimated SLOPE calculated by a logarithmic least-mean-square line fitted to
the spectrum.
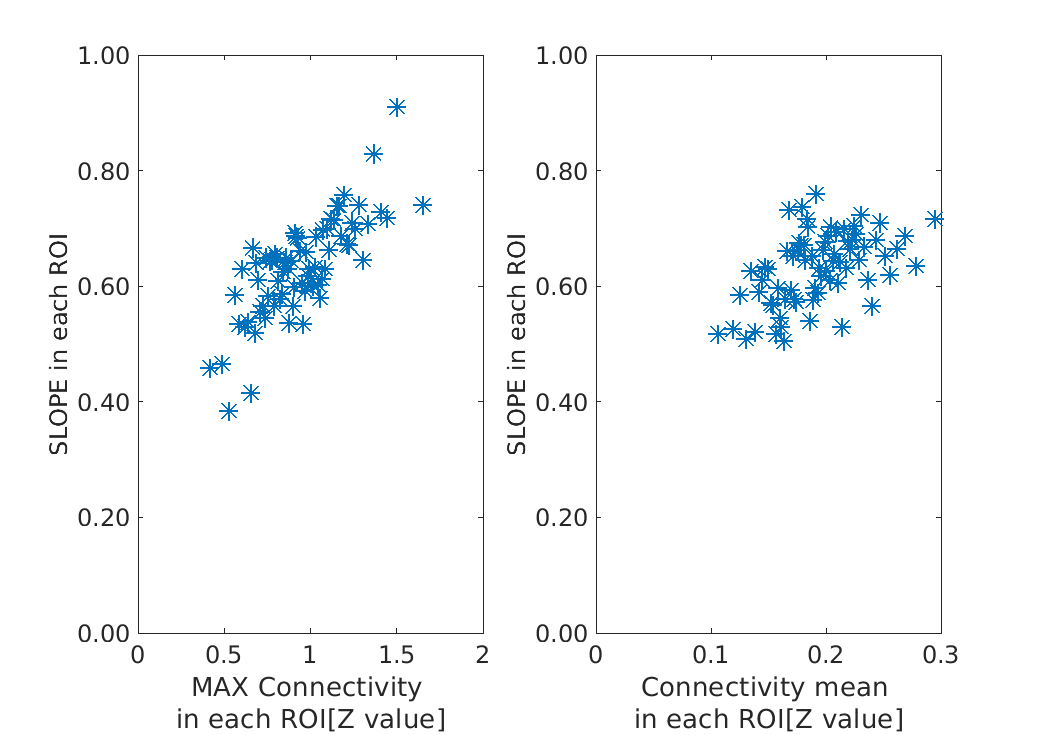
Relation between connectivity of z-value and the SLOPE value in each ROI. The maximum and mean z values of ROI to ROI analysis were used as
connectivity evaluation. For the purposes of
clarity, each value represents the average of 60 data.
DOI: https://doi.org/10.58530/2023/3854