3853
Clinical Functional MRI-derived Probabilistic Template of Primary Language Areas of Patients with Brain Tumors
Jian Ming Teo1,2, Jina Lee3, Ping Hou1, Vinodh A Kumar3, Kyle R Noll4, Sujit S Prabhu5, and Ho-Ling Liu1
1Department of Imaging Physics, The University of Texas MD Anderson Cancer Center, Houston, TX, United States, 2The University of Texas MD Anderson Cancer Center UTHealth Graduate School of Biomedical Sciences, Houston, TX, United States, 3Department of Neuroradiology, The University of Texas MD Anderson Cancer Center, Houston, TX, United States, 4Department of Neuro-Oncology, The University of Texas MD Anderson Cancer Center, Houston, TX, United States, 5Department of Neurosurgery, The University of Texas MD Anderson Cancer Center, Houston, TX, United States
1Department of Imaging Physics, The University of Texas MD Anderson Cancer Center, Houston, TX, United States, 2The University of Texas MD Anderson Cancer Center UTHealth Graduate School of Biomedical Sciences, Houston, TX, United States, 3Department of Neuroradiology, The University of Texas MD Anderson Cancer Center, Houston, TX, United States, 4Department of Neuro-Oncology, The University of Texas MD Anderson Cancer Center, Houston, TX, United States, 5Department of Neurosurgery, The University of Texas MD Anderson Cancer Center, Houston, TX, United States
Synopsis
Keywords: fMRI, Data Processing
This study aims to develop a functional template of primary language areas based on 306 presurgical language fMRI scans from 102 patients with brain tumors. The template was constructed from voxelwise probabilistic distribution of fMRI results of three common clinical language paradigms. An independent dataset of 38 patients was used to test the template from this study and compare with a template derived from the meta-analysis of 1101 published studies. The results showed that our template agreed better with the test dataset, with significantly higher dice coefficients in both anterior and posterior primary language areas, comparing with the literature-based template.Introduction
Templates of functional brain regions, such as the primary language areas, have been applied in clinical fMRI analyses including evaluation of language lateralization, guiding seed selection for the detection of functional connectivity with resting-state fMRI (rs-fMRI), and categorizing functional networks obtained from independent component analysis with rs-fMRI1-3. Existing functional templates were developed based on brain anatomy, task-based fMRI studies, or rs-fMRI studies, primarily from healthy subjects. However, significant inter-subject variations of functional anatomy can arise due to brain lesions. This study aims to develop a functional template of primary language areas based on voxelwise probabilistic distribution of presurgical fMRI results from three common clinical paradigms: sentence completion (SENT), letter fluency (LETT) and category naming (CAT).Methods
A total of 306 SENT, LETT and CAT presurgical fMRI scans from 102 randomly selected brain tumor patients (53 males and 49 Females, mean age 50 ± 15 y; age range 16-80 y) were utilized in this study. All fMRI studies were performed on clinical 3T scanners using a single-shot gradient-echo EPI sequence (TR/TE=2000 ms/25 ms, 32 slices, voxel size = 3.4 x 3.4 x 4 mm3, 130 dynamics). Each language paradigm started with a 20-s control block, followed by six 20-s task blocks interleaving with 20-s contrast blocks. fMRI preprocessing included motion correction, slice timing correction, co-registration with 3D T1-weighted images with AFNI4 and normalization to MNI space using SPM12. Isotropic 6.0mm FWHM smoothing was applied. The inclusion criteria for head motion were less than 2mm translation and 2⁰ rotation. General linear model was applied to generate activation t-value maps using the AFNI 3dDeconvolve and 3dRemlfit functions. The t-value maps were then thresholded at FWE-corrected p<0.05.Probabilistic overlap maps (POMs) for each task were obtained by overlaying the binary mask of activation maps for each patient5. The pooled probabilistic overlap map (PPOM) was obtained from overlaying the POMs from the three tasks. LONI probabilistic brain atlas was used to confine PPOM to the left hemisphere anterior language area (inferior frontal gyrus) and left hemisphere posterior language area (union of angular, supramarginal, superior temporal, and middle temporal gyri)3,6. An independent dataset of language maps obtained from SENT and LETT fMRI (FWE-corrected p<0.05) from 38 patients (22 males and 16 Females, mean age 47 ± 15 y; age range 13-77 y) was used to test the developed template. Activated clusters within anterior and posterior primary language areas were selected for each of the dataset by an experienced neuroradiologist. The primary language regions were constrained in the left hemisphere within the posterior inferior frontal gyrus (including pars triangularis and pars opercularis) for the anterior language area; and within the posterior superior and middle temporal gyri for the posterior language area. Dice coefficients were obtained for the PPOM, with respect to testing dataset, at varying thresholds to determine the optimal probability threshold for the PPOM. The mask obtained from using the threshold resulting the highest mean dice coefficient is compared to a language functional template derived from the meta-analysis of 1101 studies in Neurosynth (using “language” search term) and constrained with the same anatomical regions as described above using the LONI probabilistic brain atlas3,6.
Results
Figure 1 illustrates the POMs obtained from SENT, LETT and CAT fMRI overlaid on the single subject MNI T1 template. LETT and CAT activate the anterior language areas more extensively, whereas SENT activates the posterior language areas. Figure 2 shows the PPOM in comparison to the Neurosynth z-map. Comparing with the Neurosynth result, the PPOM covers slightly wider anterior language areas but its posterior language areas appear more focused. Figure 3 demonstrates the anterior and posterior left hemisphere PPOM dice coefficient with respect to test dataset at different probabilistic thresholds. For anterior left hemisphere PPOM, the highest mean dice of 0.273 ± 0.168 is obtained at threshold 52 out of 306 (17.0%). For posterior left hemisphere PPOM, the highest mean dice of 0.164 ± 0.135 is obtained at threshold 42 out of 306 (13.7%). Figure 4 presents boxplots comparing the dice coefficients for PPOM vs the literature-based template. Wilcoxon paired t-test shows that the PPOM template had significantly higher dice coefficients than the literature-based template in the anterior (p-value < 10-4) and posterior (p-value<10-5) language areas.Discussion
Dice coefficient results indicate the degree of agreement between language functional templates and test dataset primary language regions. By design, the functional template is meant to be sufficiently large to account for inter-subject variations when used for SBC in rs-fMRI analysis which will depress the magnitude of mean dice coefficients. In this study, the same test dataset was used to obtain dice coefficients for the PPOM template and Neurosynth derived template. Due to significantly higher dice coefficients in both anterior and posterior language regions, the PPOM template displays better agreement with tb-fMRI test dataset.Conclusion
A language functional template for anterior and posterior primary language areas was developed from clinical fMRI of brain tumor patients. The preliminary language functional template displays better agreement with tb-fMRI test dataset than the literature-based template. Inclusion of fMRI data from a larger patient population is currently underway.Acknowledgements
This work is supported by NIH grant R01CA258788.References
- Tie Y, Rigolo L, Norton IH, Huang RY, Wu W, Orringer D, Mukundan S, Jr., Golby AJ. Defining language networks from resting-state fMRI for surgical planning--a feasibility study. Hum Brain Mapp 2014;35(3):1018-1030.
- Branco P, Seixas D, Deprez S, Kovacs S, Peeters R, Castro SL, Sunaert S. Resting-State Functional Magnetic Resonance Imaging for Language Preoperative Planning. Front Hum Neurosci 2016;10:11.
- Hsu AL, Chen HS, Hou P, Wu CW, Johnson JM, Noll KR, Prabhu SS, Ferguson SD, Kumar VA, Schomer DF, Chen JH, Liu HL. Presurgical resting-state functional MRI language mapping with seed selection guided by regional homogeneity. Magn Reson Med 2020;84(1):375-383.
- Cox RW. AFNI: software for analysis and visualization of functional magnetic resonance neuroimages. Comput Biomed Res 1996;29(3):162-173.
- Fedorenko E, Hsieh PJ, Nieto-Castanon A, Whitfield-Gabrieli S, Kanwisher N. New method for fMRI investigations of language: defining ROIs functionally in individual subjects. J Neurophysiol 2010;104(2):1177-1194.
- Shattuck DW, Mirza M, Adisetiyo V, Hojatkashani C, Salamon G, Narr KL, Poldrack RA, Bilder RM, Toga AW. Construction of a 3D probabilistic atlas of human cortical structures. Neuroimage 2008;39(3):1064-1080.
Figures
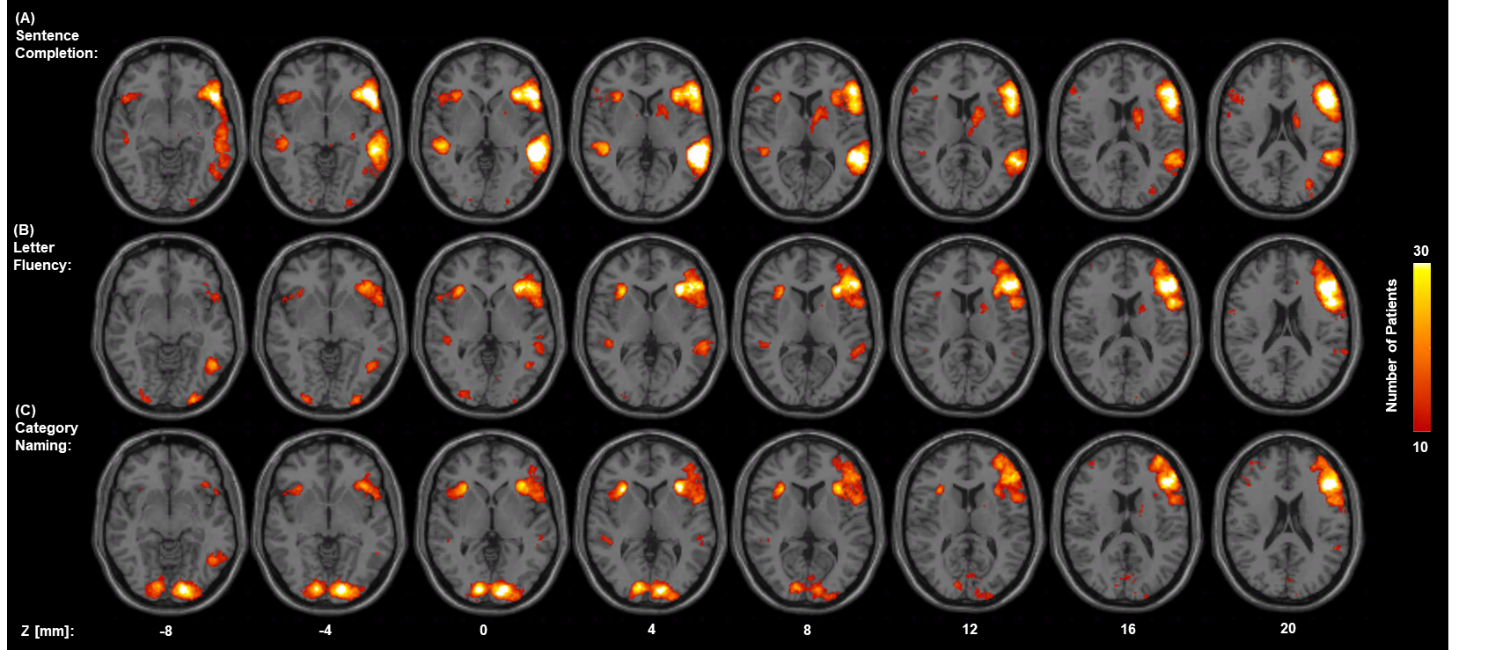
Figure 1. Probabilistic
overlap map of the three different language tasks. Each probabilistic overlap
map comprises of 102 presurgical tb-fMRI from brain tumor patients. (A)
Probabilistic overlap map obtained from sentence completion tb-fMRI. (B)
Probabilistic overlap map obtained from letter fluency tb-fMRI. (C)
Probabilistic overlap map obtained from category naming tb-fMRI.
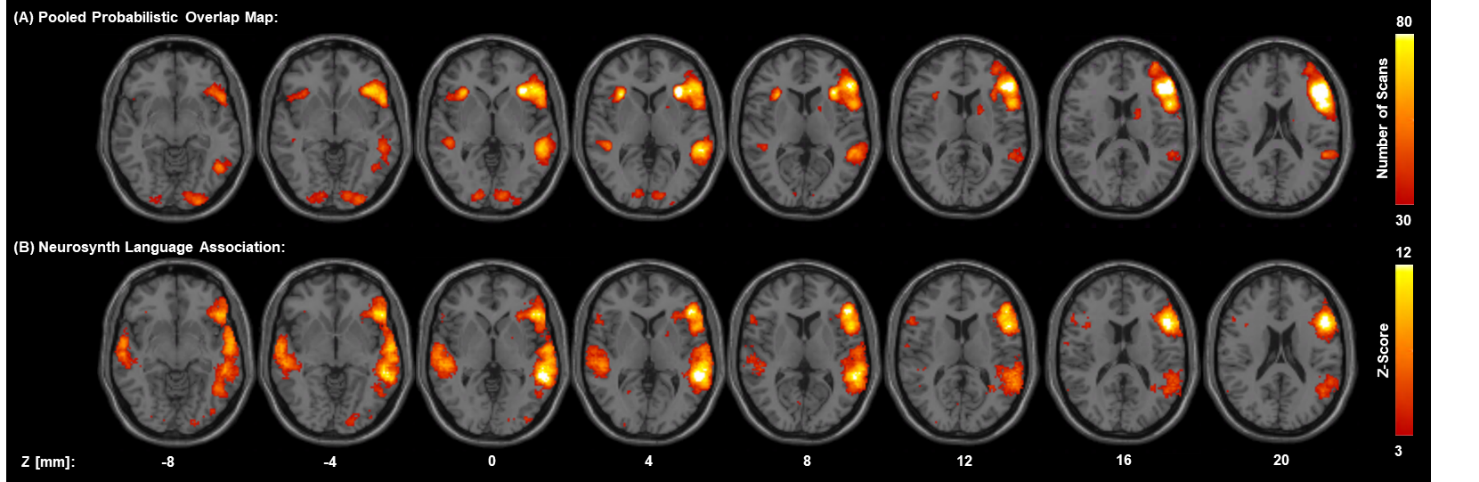
Figure
2. Pooled probabilistic overlap map vs Neurosynth “Language” z-map. (A) Pooled
probabilistic overlap map obtained from overlaying the probabilistic overlap
maps in Figure 1. The pooled probabilistic overlap map comprises of 306 tb-fMRI. (B) Neurosynth z-map obtained from 1101 studies using the search term
“language”.
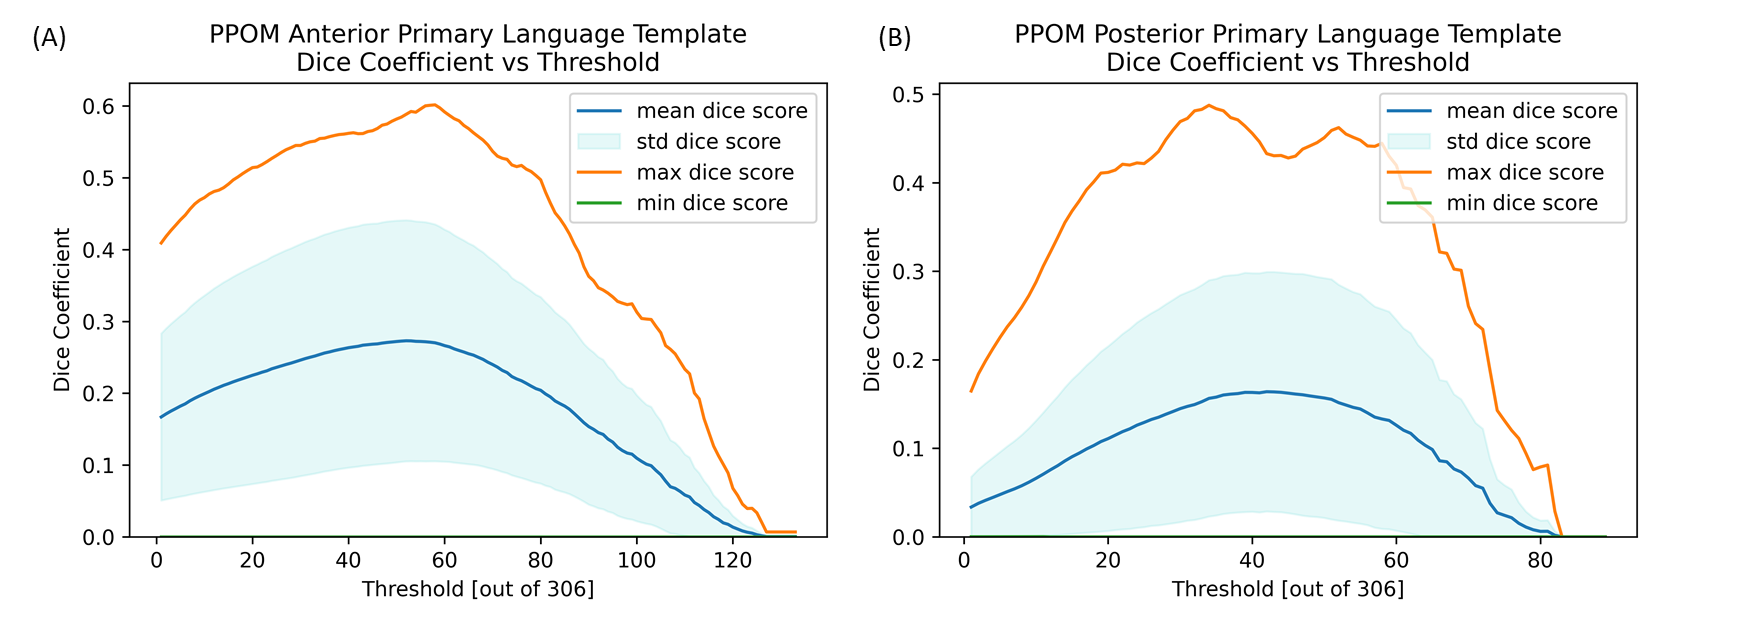
Figure 3. Dice
coefficients at various thresholds for left hemisphere anterior and posterior
primary language templates. (A) Mean dice coefficients for left
hemisphere anterior primary language functional template with respect to test
dataset evaluated at different thresholds. Maximum mean dice of 0.273 is
obtained at threshold 52 out of 306. (B) Mean dice coefficient for left
hemisphere posterior primary language functional template with respect to test
dataset evaluated at different thresholds. Maximum mean dice of 0.164 is
obtained at threshold 42 out of 306.
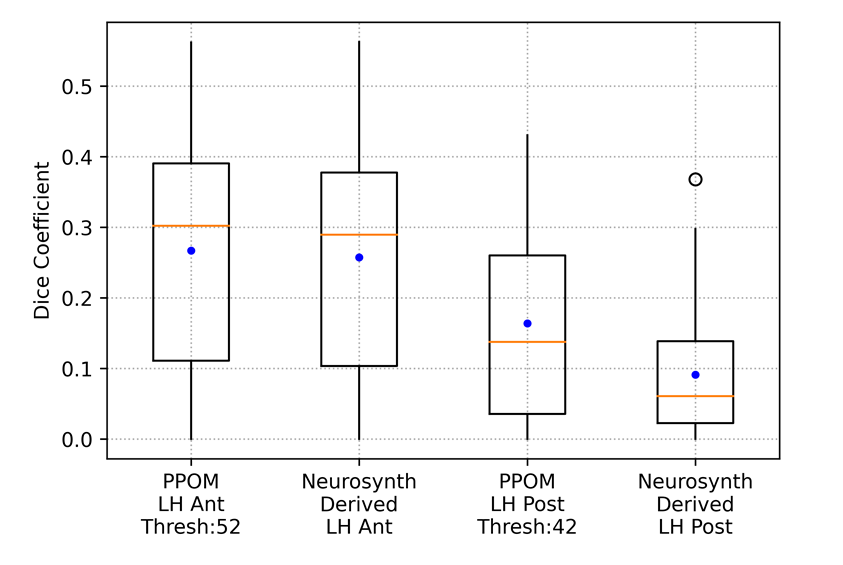
Figure 4. Boxplots comparing distribution of dice coefficients for
PPOM vs the template derived from the Neurosynth meta-analysis of 1101 studies.
Orange line indicates the median dice coefficient while the blue dot indicates
the mean dice coefficient. The statistical significance was determined using
Wilcoxon paired t-test performed on the anterior (p-value* < 10-4)
and posterior templates (p-value** < 10-5) respectively
indicating difference in PPOM template and literature template is significant.
DOI: https://doi.org/10.58530/2023/3853