3850
Cerebrovascular reactivity mapping using breath-hold BOLD-fMRI: comparison of signal models when using voxelwise lag optimization1Institute for Systems and Robotics - Lisboa and Department of Bioengineering, Instituto Superior Técnico, Universidade de Lisboa, Lisbon, Portugal
Synopsis
Keywords: fMRI, fMRI
We investigate the best modeling approach for mapping cerebrovascular reactivity (CVR) using voxelwise lag optimization. We considered two types of regressors (Block, PetCO2), three convolution models (no convolution, single gamma, double gamma), and a variable haemodynamic delay. We found that the CVR values obtained when using the PetCO2 signal without convolution, or convolved with a single gamma, are better than those obtained with the canonical HRF (double gamma, time-to-peak = 6s), while convolution with a canonical HRF remains the best option when using a Block design.INTRODUCTION
Cerebrovascular reactivity (CVR) measures the capability of the vessels to alter their caliber in response to a vasoactive stimulus1. CVR can be mapped using blood oxygenation level dependent (BOLD) functional MRI (fMRI) during a breath-hold (BH) task, which induces hypercapnia1. The BOLD signal is usually modeled as the convolution of the Block paradigm or the partial pressure of end-tidal CO2 (PetCO2) with a haemodynamic response function (HRF)1 (canonical HRF - double gamma with a time-to-peak=6s). Although the canonical HRF appears to be an appropriate choice2, variations in its delay and shape should be considered3. However, previous studies comparing different signal modeling approaches did not consider voxelwise lag optimization between the BOLD response and the BH task, which has been shown to improve CVR mapping4,5. Here, we investigate the optimal modeling approach when mapping CVR with voxelwise lag optimization.METHODS
14 healthy women were studied on a 3T Siemens Vida MRI system using a 64-channel head RF coil.BOLD-fMRI was acquired during a BH task (4 trials of 15s BH alternated with 30s cued normal breathing) using 2D-EPI (TR/TE=1260/30ms, in-plane GRAPPA-2, SMS-3, 60 slices, 2.2mm isotropic resolution). Expired CO2 was measured using a Medlab CAP10 capnograph and a nasal cannula, and the PetCO2 signal was obtained by peak detection of the capnograph trace. The PetCO2 change was averaged across the four BH tasks for each subject to yield the mean ΔPetCO2 in mmHg.
Image analysis was performed using FSL6 and included: motion correction, distortion correction, spatial smoothing (FWHM=3.5mm) and high-pass temporal filtering (cutoff=100s).
GM and WM masks were obtained and registered to the functional space. The average percent BOLD signal change in GM and WM was computed for each subject. The bulk lag of the BH response was obtained for each subject by computing cross correlation between the GM BOLD time series and the Block/PetCO2 signal.
Lagged voxelwise analysis was performed by fitting the following general linear models (GLM) to the BOLD time series: Block, PetCO2 (regressor type), each without convolution (WoC), convolution with: single gamma HRF (CSg) or double gamma HRF (CDb) (convolution). For convolution models, the HRF time-to-peak was varied between 3-11s (step 1s). Motion parameters and outliers were included as confounds in each GLM .
Each regressor type (Block, PetCO2) was shifted between ±9s in increments of 1s around the bulk lag, for each subject. The CVR map was obtained by selecting, for each voxel, the lag that explained the most variance (F-value) and dividing the parameter estimate by the mean BOLD signal and the mean ΔPetCO2 to yield values in %/mmHg.
To evaluate the differences between models, an ROI and a voxelwise analysis were performed, in terms of the F-value and the CVR value. For the ROI analysis, both F-value and CVR were averaged across GM and WM and a Conover’s non-parametric test (factors: regressor type, convolution, delay) was performed, corrected for multiple comparisons with Bonferroni correction. For the voxelwise analysis, FSL’s Randomise tool was used to perform permutation testing (factors: regressor type, convolution: with a 6s fixed delay), corrected for multiple comparisons (p<0.017).
RESULTS AND DISCUSSION
The average GM BOLD signal overlaid with each regressor type (Block, Ramp7, PetCO2) is plotted in Fig.1 for the haemodynamic lag that maximizes their correlation. The plots show that PetCO2 is more correlated with the signal than the Block for some subjects. Because the Block and Ramp explain similar amounts of signal variation, we excluded the Ramp from a voxelwise analysis.Fig.2 presents the group median maps of CVR and respective optimal lag. The CVR is higher for PetCO2 than Block and lower in WM than GM, as expected8,9. In terms of optimal lag, the values are consistent with the literature9, indicating a higher optimal lag for WM and Block when compared with PetCO2.
The mean voxelwise F-value and CVR obtained in GM and WM, are shown in Fig.3. The F-value only differs significantly between the canonical delay (6s) and a delay of up to 10s, for the CDb model. There are no differences between regressors; for the models the only differences are between CSg vs WoC and CDb vs WoC, with the CSg explaining slightly more. Despite the differences in delays, we decided to keep the canonical delay for model consistency and because these values are outside the range of the most commonly reported HRF delays in the literature10. The Block and PetCO2 median CVR values are around 0.25%/mmHg and 0.45%/mmHg, respectively, with the two regressors being significantly different. For models: we found a significant difference between CSg vs CDb (PetCO2) and CSg vs WoC, CDb vs WoC (Block).
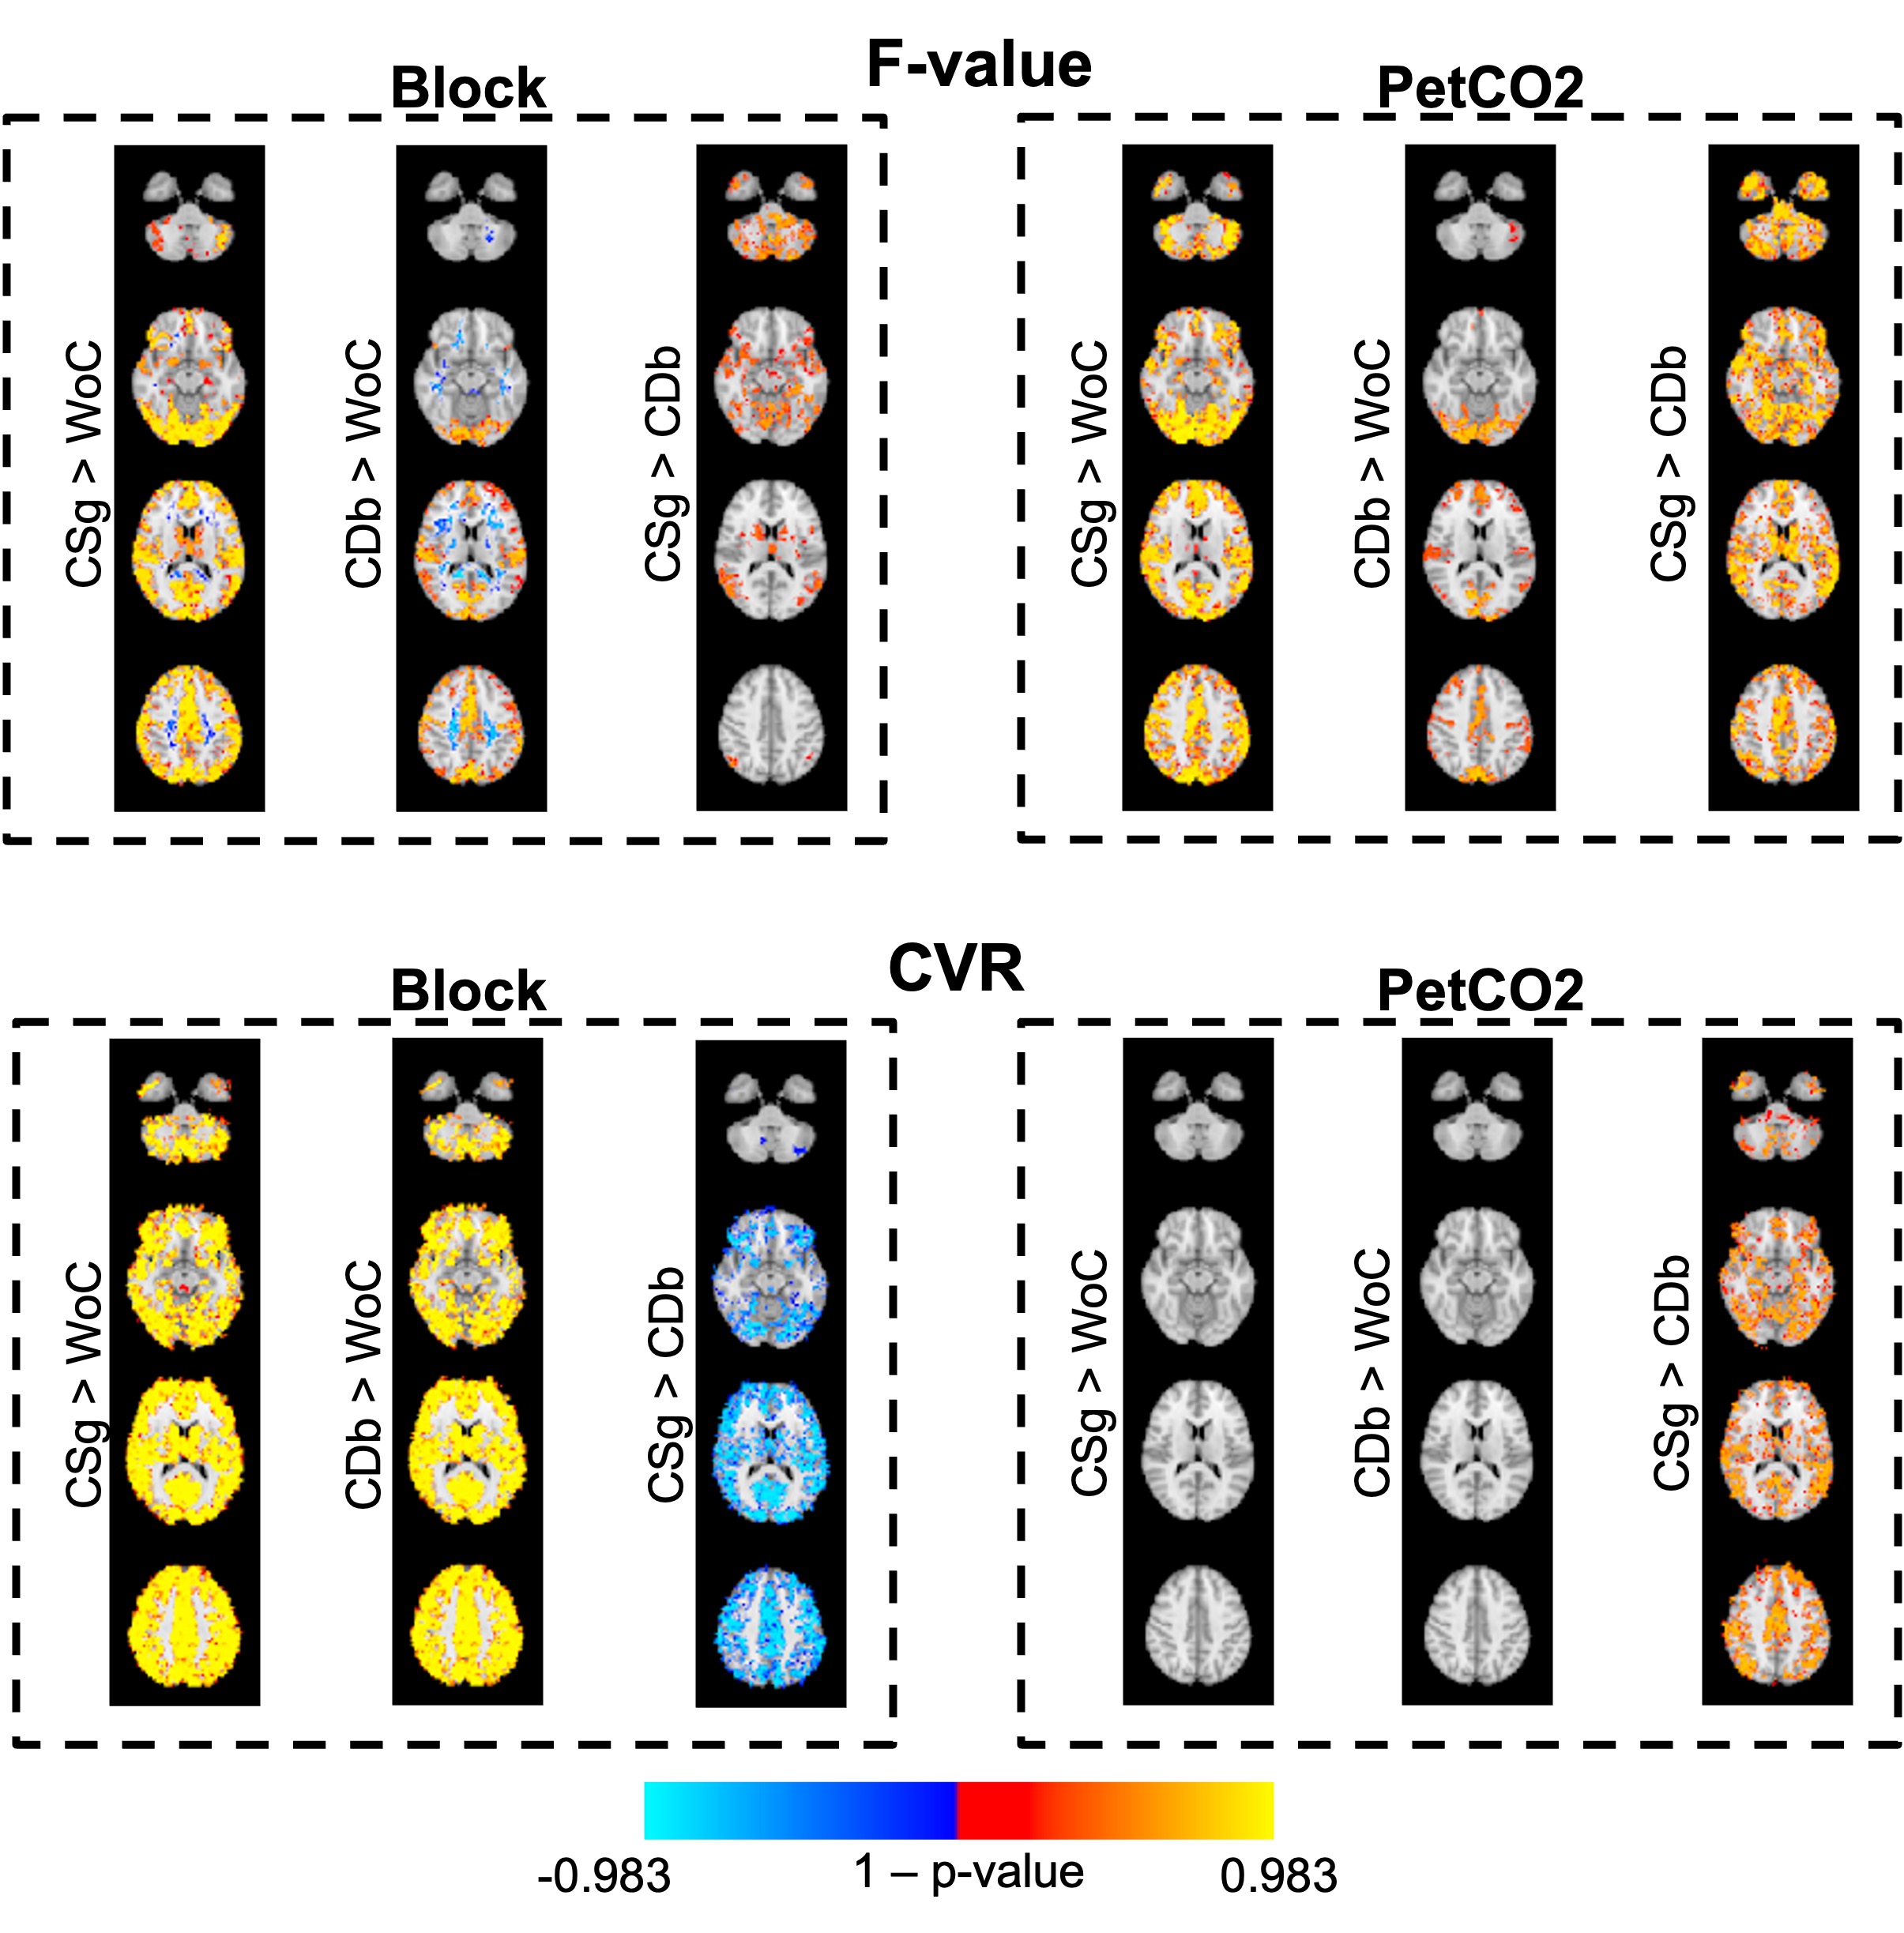
Fig.4 shows voxelwise analysis results that are consistent with ROI results. The F-value also differs between CSg vs WoC and CDb vs WoC, with the WoC appearing to be a better option in some cases for WM. For PetCO2, CSg is a better model, and for Block the CDb appears to be the best.
CONCLUSION
We found that using the PetCO2 signal without convolution, or convolved with a single gamma HRF, provides the best model for mapping CVR with voxelwise lag estimation, while convolution with a canonical HRF remains the best option for a Block design.Acknowledgements
We acknowledge the Portuguese Science Foundation through grants PTDC/EMD-EMD/29675/2017, LISBOA-01-0145-FEDER-029675 and UIDB/50009/2020.References
[1]. Pinto J et al., Front Physiol, 11:608475, 2021.
[2]. Murphy K et al., Neuroimage, 4(1):369-379, 2011.
[3]. Golestani AM et al., Neuroimage, 104:266-277, 2015.
[4]. Moia S et al., Annu Int Conf IEEE Eng Med Biol Soc, 2020:1489-1492, 2020.
[5]. Pinto J et al., Neuroimage, 135:223-231, 2016.
[6]. https://fsl.fmrib.ox.ac.uk/fsl/fslwiki/
[7]. Evanoff NG et al., Physiol Funct Imaging, 40(3):183-189, 2020.
[8]. Bright MG et al., Neuroimage, 83:559-568, 2013.
[9]. Moia S et al., Neuroimage, 233:117914, 2021.
[10]. Buxton RB et al., Neuroimage, 23(Suppl1):220-233, 2004.
Figures
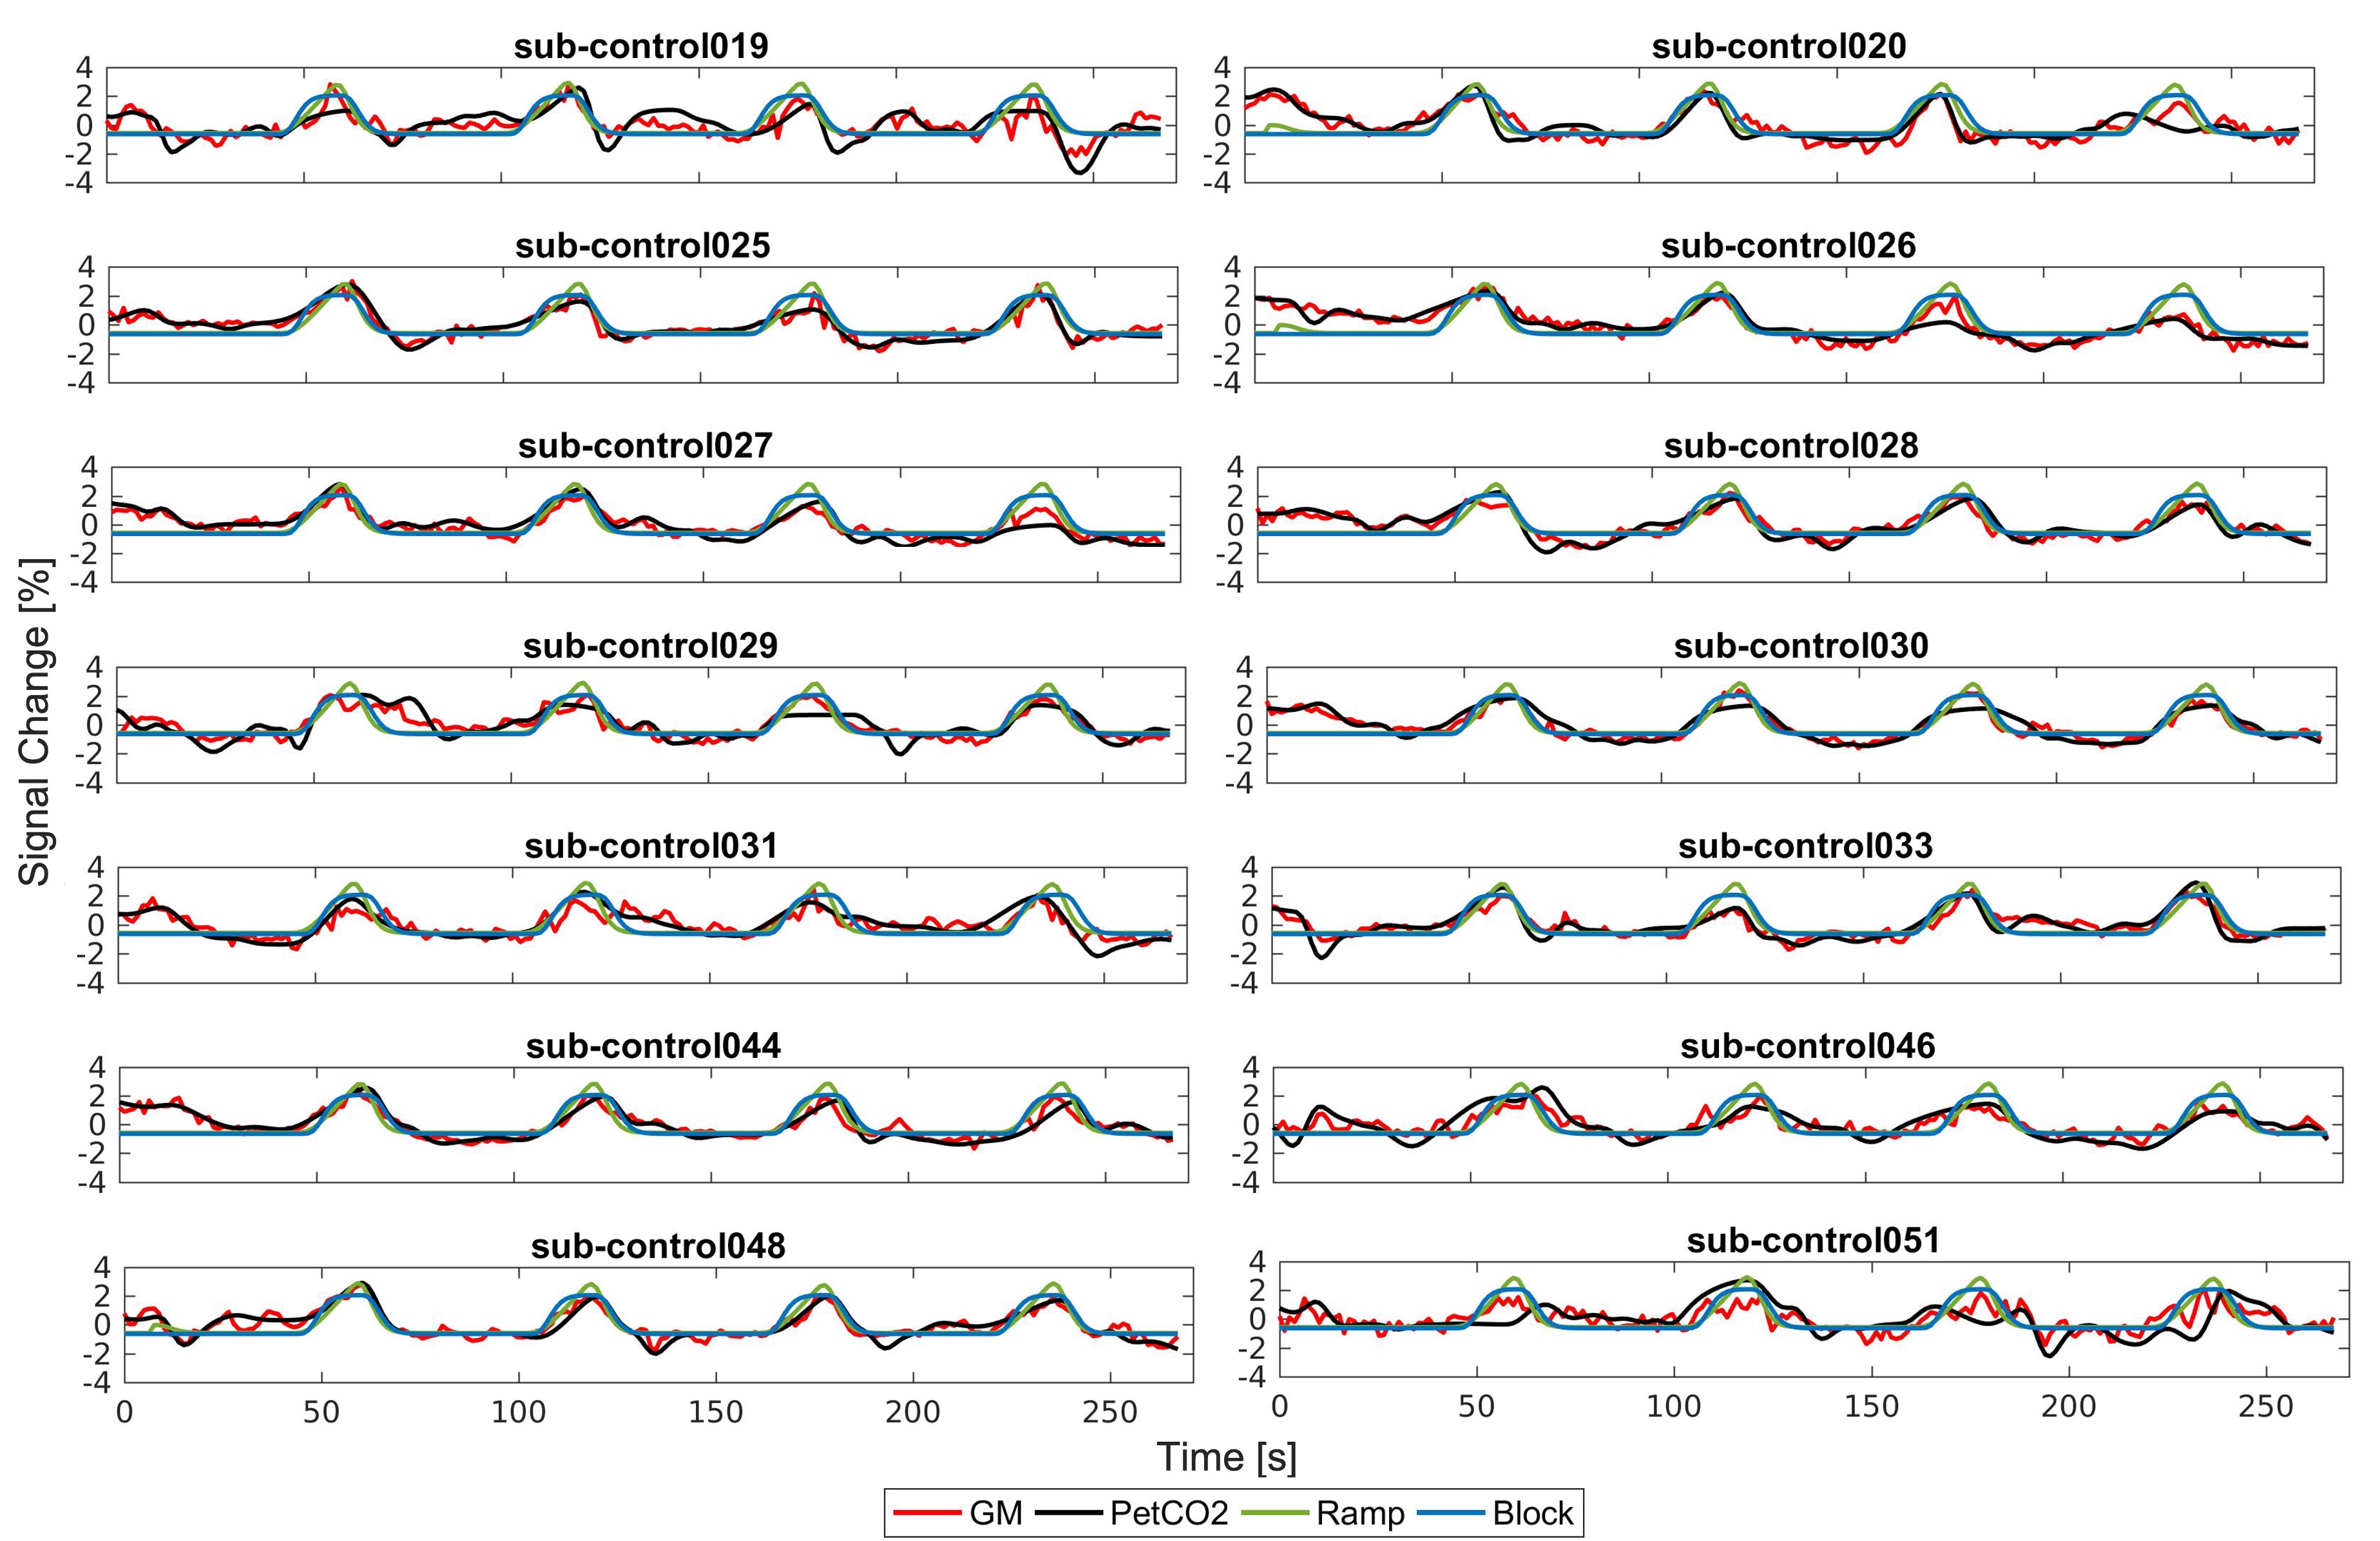
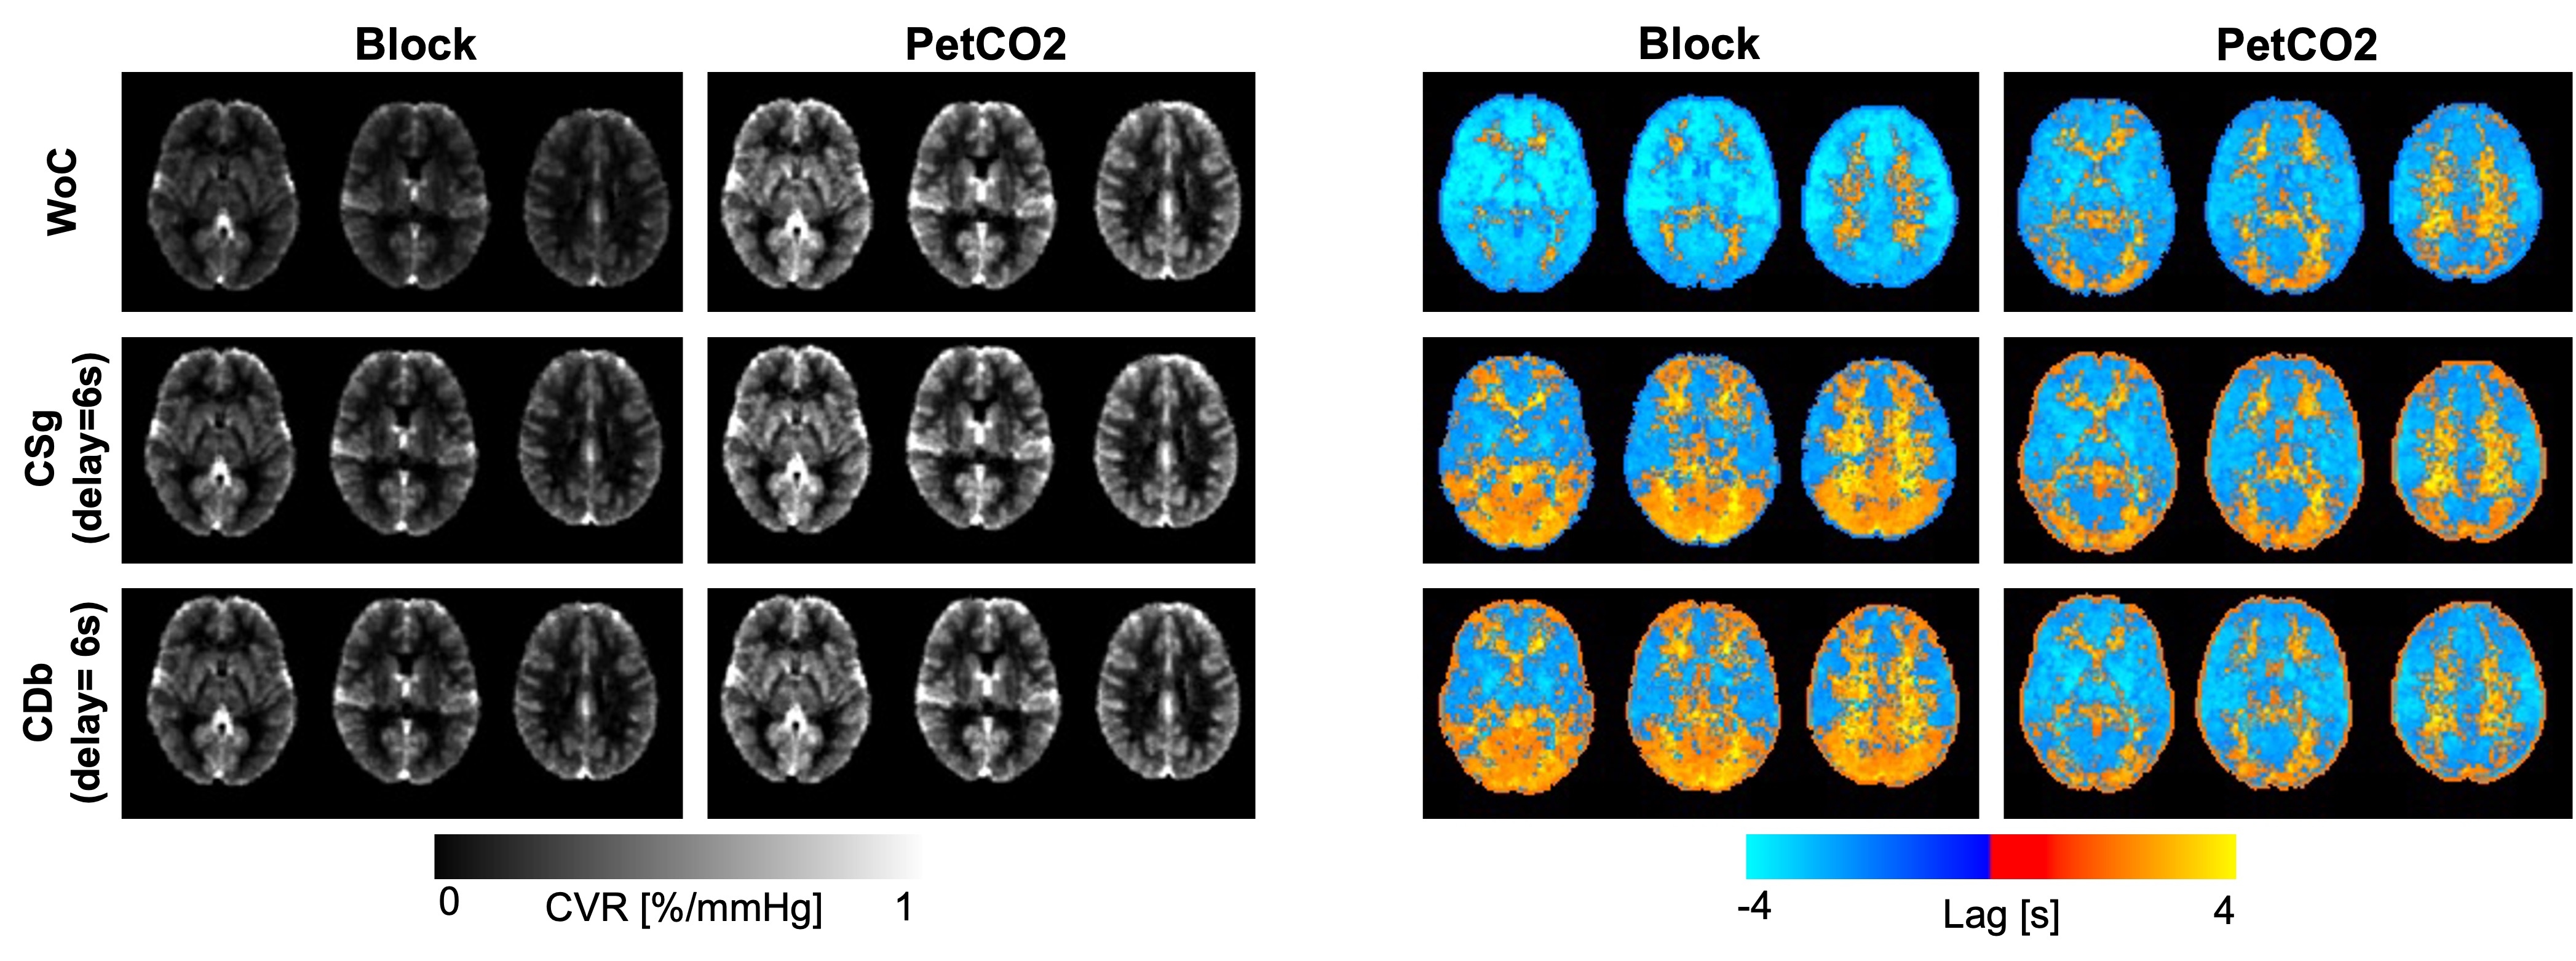
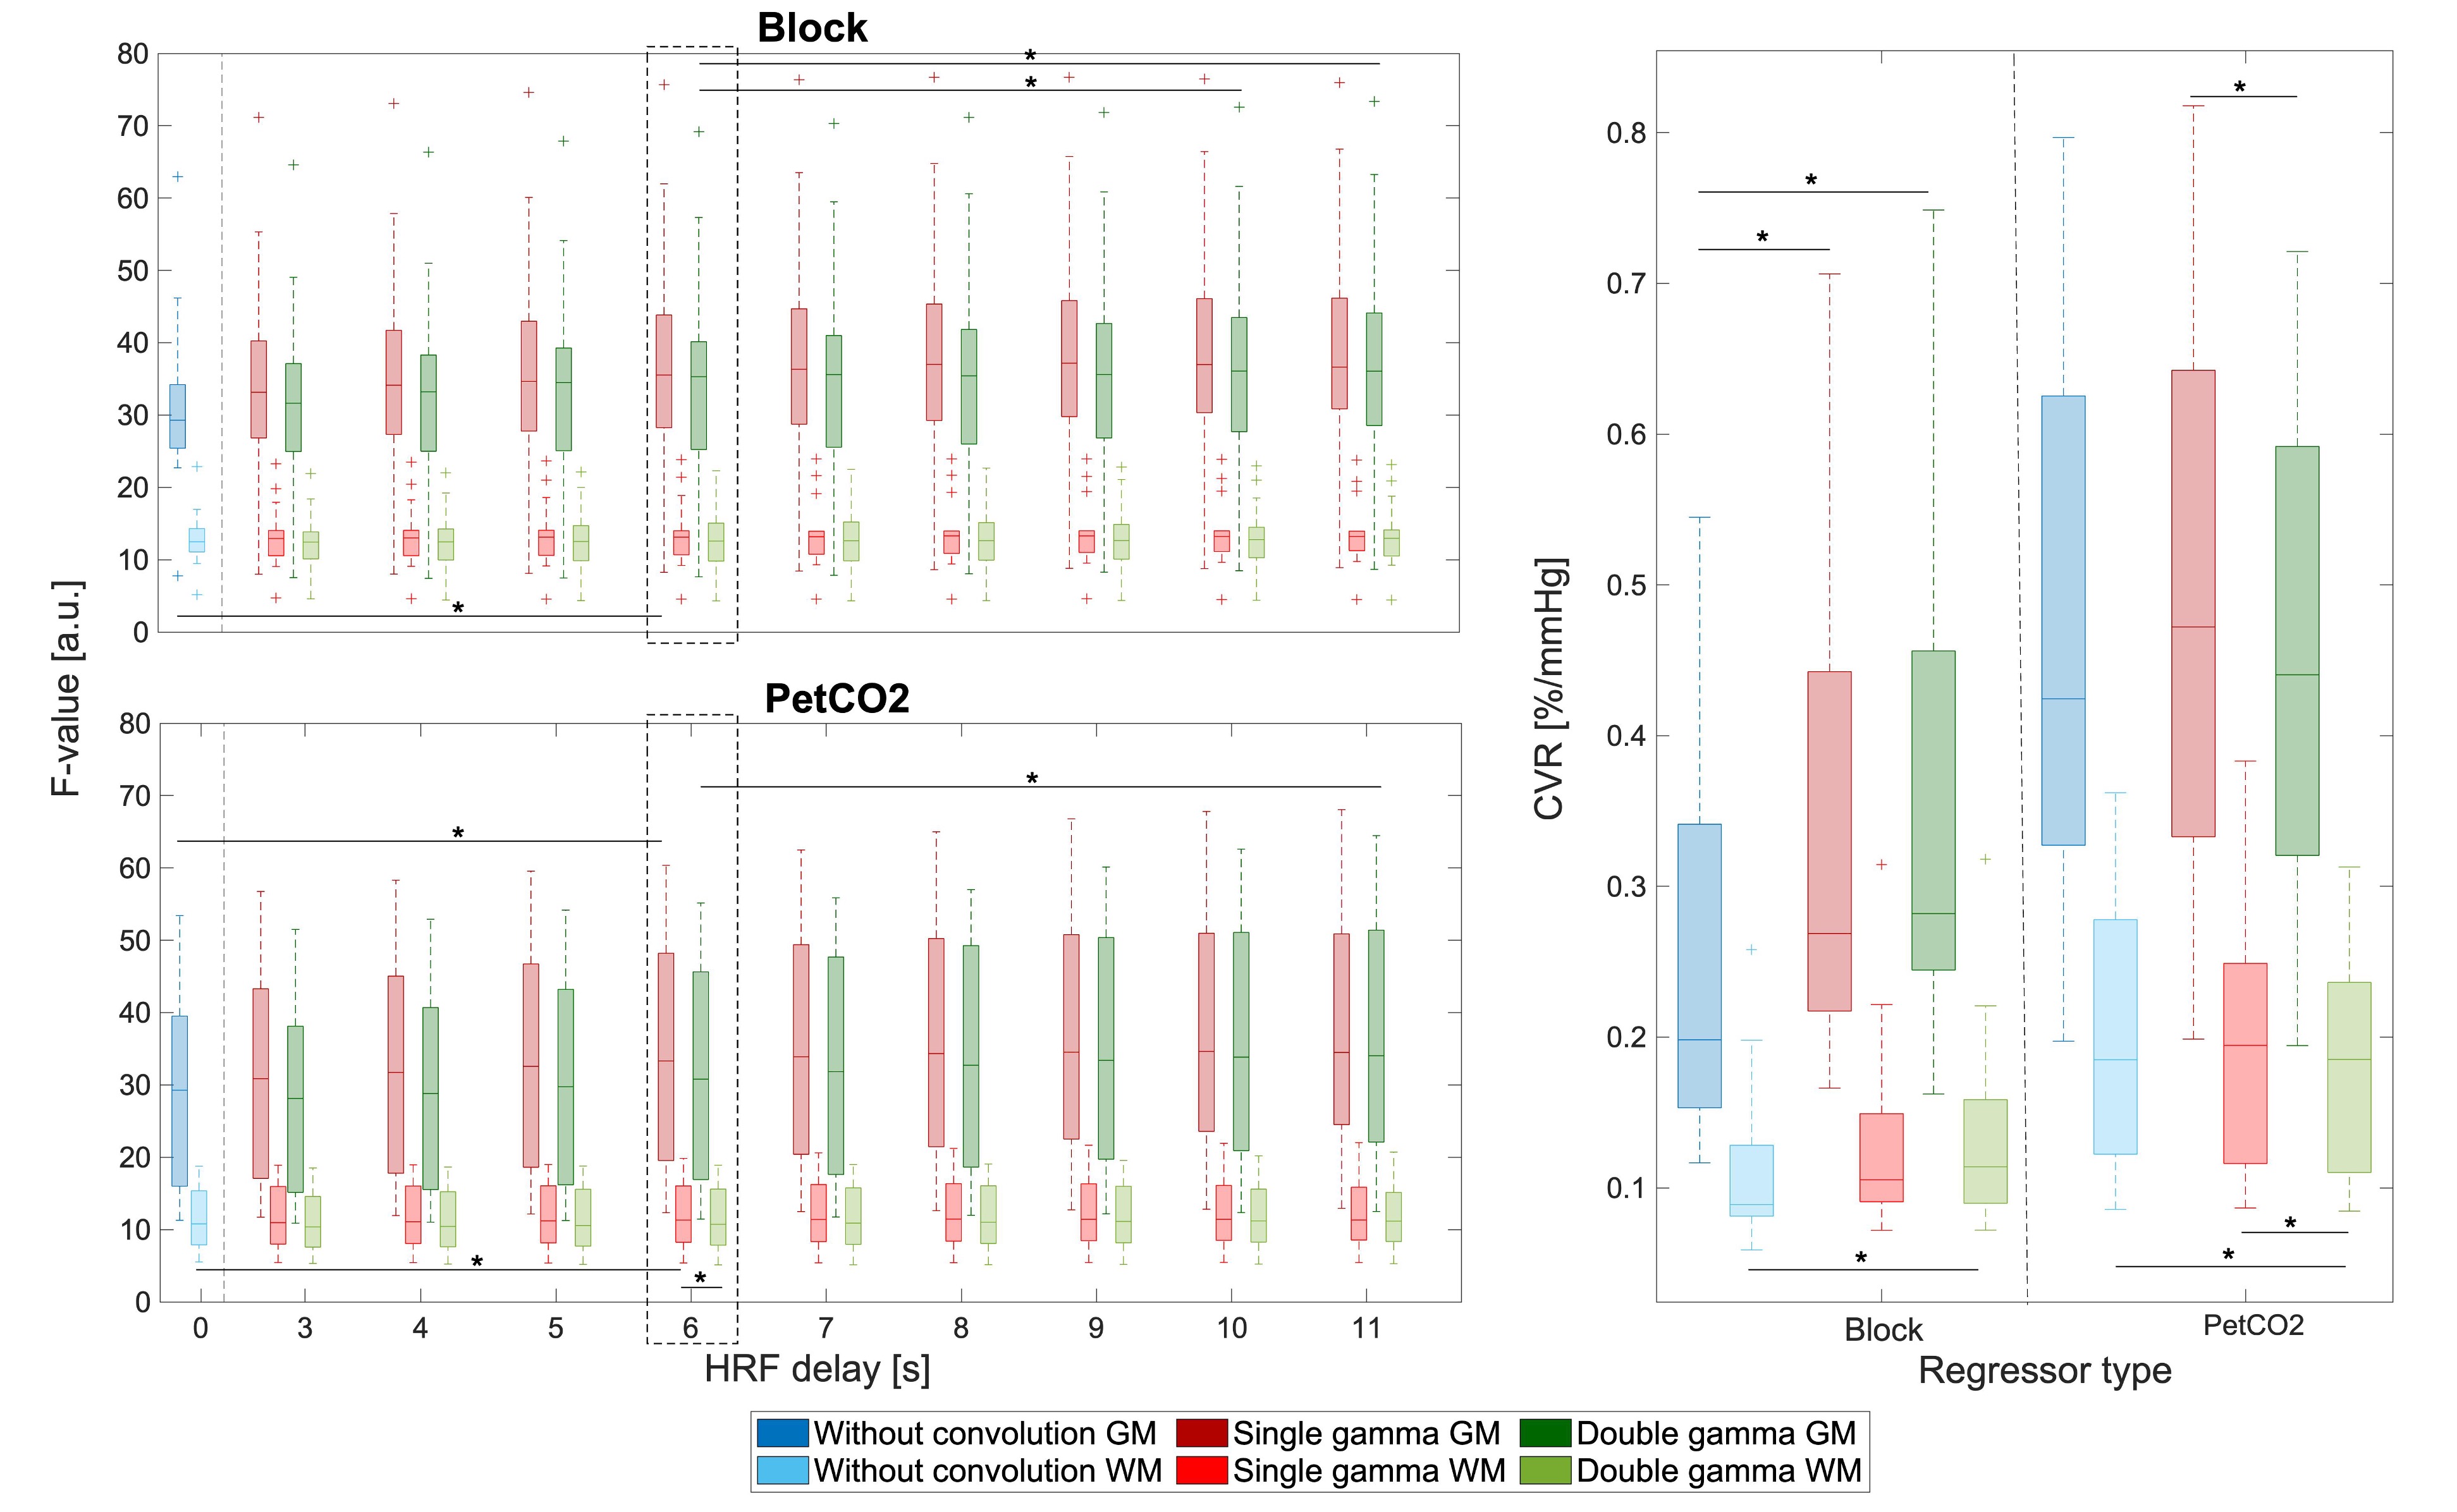
Figure 3: ROI analysis of model comparisons: GM and WM average F-value (left) and cerebrovascular reactivity (CVR) (right) values obtained with lagged voxelwise analysis. Boxplots of the F-value (left) represent the distributions across subjects, for three models with different HRFs delays and two regressors. Boxplots of CVR (right) represent the distributions across subjects, for the same three models but only with HRF delay=6s. The asterisk represents the significant changes obtained with Post-hoc tests, corrected for multiple comparisons with Bonferroni correction.