3848
Altered resting state networks associated with REM sleep behavioral disorder in Parkinson’s disease
Destaw Bayabil Mekbib1, Miao Cai2, Weiying Dai3, Xiaoli Liu4, and Li Zhao1
1Key Laboratory for Biomedical Engineering of Ministry of Education, Zhejiang University, Hangzhou, China, 2Neurology, Zhejiang Hospital, Hangzhou, China, 3Computer Science, Binghamton Univeristy, State University of New York, Binghamton, NY, United States, 4Zhejiang Hospital, Hangzhou, China
1Key Laboratory for Biomedical Engineering of Ministry of Education, Zhejiang University, Hangzhou, China, 2Neurology, Zhejiang Hospital, Hangzhou, China, 3Computer Science, Binghamton Univeristy, State University of New York, Binghamton, NY, United States, 4Zhejiang Hospital, Hangzhou, China
Synopsis
Keywords: fMRI (resting state), Parkinson's Disease
Resting-state functional MRI has played a fundamental role in the study of Parkinson’s disease (PD) with rapid eye movement sleep behavior disorder (RBD). In this work, we investigated changes in functional connectivity within and between resting-state networks and their relationship to global fluctuations in 13 PD with RBD, 28 PD without RBD, 6 RBD without PD, and 20 healthy controls. Based on an in-house reliable data selection strategy, unique effects on the lateral visual network in RBD patients and on the sensorimotor network in PD patients were found. These may provide novel clues to understanding the pathology and improve diagnosis.INTRODUCTION
Many Parkinson’s disease (PD) patients with rapid eye movement sleep behavioral disorder (PD-RBD) suffer from motor, cognitive, and behavioral functional deficits (1). A few resting-state functional MRI (rsfMRI) studies have attempted to investigate the underlying neurophysiological mechanisms and found altered functional connectivity (FC) in RBD (2,3). However, these studies focused on specific RSNs, including prefrontal, default mode, sensorimotor, basal ganglia, and executive-control networks. We hypothesized that other brain networks, including the visual network, may also be disrupted with the progression of RBD. In addition, the interactions between local networks and the contribution of global fluctuations may provide further information (4). To elucidate brain network alterations associated with RBD, we performed FC analysis in patients with PD-RBD, PD without RBD (PD-NRBD), RBD without PD (NPD-RBD), and healthy controls (HCs). We hypothesized that PD-RBD patients have abnormalities in widespread brain networks that are not limited to sensorimotor and default mode networks but extended to visual networks.METHOD
With Institutional Review Board approval, MRI datasets were collected from 48 PD, 6 NPD-RBD, and 20 HCs using a 3T Siemens Skyra scanner. T1-weighted images were acquired using MPRAGE with an isotropic resolution of 1mm3, TR of 1900ms, TE of 2.3ms, and TI of 900ms. The rsfMRI images were acquired using EPI with TR of 2s, TE of 30ms, 4mm thickness of 33 slices, acceleration factor of 2, and 240 volume. The images were brain-extracted, motion-corrected, spatially smoothed, and temporally filtered. The images were also cleaned from motion and physiological-related artifacts using a single-subject independent component analysis (ICA) approach (5). Finally, the images were co-registered to the MNI152 space.The preprocessed data were decomposed into 37 components to obtain group-ICA maps using MELODIC ICA. Noise components were manually removed and the remaining group-ICA maps were used as masks in dual regression analysis to extract subject-specific mean timecourses and associated spatial maps from the preprocessed rsfMRI data (6). In addition, a time series of global brain network (GBN) was calculated by averaging whole brain voxels within the MNI152 gray matter mask (4). To compare voxel-wise intra-network FC differences between groups, the subject-specific spatial maps were analyzed using FSL-randomise with threshold-free cluster enhancement (5000 permutations). Five-fold cross-validation tests were also performed to assess outliers in the data that may introduce unreliable and biased results. In each fold, subjects were included based on 5 different motion exclusion criteria. If FC differences between PD patients and HCs were consistent across tests, results were considered reproducible; otherwise, outlier data were presented and a new exclusion criterion related to motion was used to exclude. To compare inter-network FC differences between groups, first, we calculated the partial correlation coefficients between the time course of 19 RSNs (i.e., 18 subject-specific timecourses and 1 GBN) and normalized them using Fisher’s Z-transformation, then we performed statistical tests using FSLNets with 5000 permutations. Results were corrected for multiple comparisons by considering family-wise error-corrected (FWE) p-value less than 0.05 as statistically significant. Data were processed using the MELODIC ICA, dual regression, and FSLNets of the FSL toolbox (Analysis Group, FMRIB, Oxford, UK.).
RESULTS and DISCUSSION
CohortReliable rsfMRI data were obtained from 13 PD-RBD, 28 PD-NRBD, 6 NPD-RBD, and 20 HCs. No significant group differences were found in demographic and clinical variables, except for rapid eye movement sleep behavior disorder questionnaire (RBDQ) scores, which were used to classify PD patients into RBD or NRBD (Table 1).
Intra-network FC
The MELODIC ICA method identified 18 functionally relevant RSNs from all subjects (Figure 1). Among the 18 RSNs, PD patients showed reduced FC within medial, lateral, occipital visual networks (MVN, LVN, OVN), default mode network 2 (DMN2), right sensorimotor network (rSMN) (Figure 2A, p<0.05), compared to the HC, which are consistent with previous studies (7,8).
More interestingly, within the PD patients group, PD-RBD patients showed significantly reduced FC in the LVN region primarily, compared to the PD-NRBD patients (Figure 2D, P<0.05). In addition, the PD patients, including PD-RBD and PD-NRBD, showed reduced FC in the rSMN regions, while NPD-RBD patients didn’t show that. It suggests the unique effects of RBD on the LVN region and PD on the SMN region. These findings may provide objective criteria to distinguish PD and RBD.
Inter-network FC
Between-group comparison results for inter-networks FC are shown in Figure 3. The GBN showed a significantly higher connection with the superior frontal network (SFN) in PD patients than in HCs (Fig. 3A). However, this relationship was not observed in PD-RBD patients compared with PD-NRBD patients and HCs. Although several significantly different connections related to the cerebellum were found in PD-RBD, the BOLD image quality in this region may require further investigation.
CONCLUSION
With reliable data selection stratagy, this work demonstrated functional disturbances within the visual and sensorimotor networks in RBD and PD patients respectively, suggesting a potential way to understand the pathogenesis of PD and RBD. In addition, this work demonstrated abnormal GBN-SFN connection in PD, suggesting a possible biomarker to distinguish PD patients from healthy controls. However, the sample size of PD-RBD patients was small, which may reduce the ability to detect possible inter-network changes.Acknowledgements
This work is supported in part by the Alzheimer’s Association through AARF-18-566347, the Fundamental Research Funds for the Central Universities, MOE Frontier Science Center for Brain Science & Brain-Machine Integration, Zhejiang University, and Zhejiang Medical and health science and Technology project SMN(2018KY190, 2021KY420).References
1. Liu Y, Zhu XY, Zhang XJ, Kuo SH, Ondo WG, Wu YC. Clinical features of Parkinson’s disease with and without rapid eye movement sleep behavior disorder. Transl. Neurodegener. 2017;6:1–6 doi: 10.1186/s40035-017-0105-5. 2. Wakasugi N, Togo H, Mukai Y, et al. Prefrontal network dysfunctions in rapid eye movement sleep behavior disorder. Park. Relat. Disord. 2021;85:72–77 doi: 10.1016/j.parkreldis.2021.03.005. 3. Rolinski M, Griffanti L, Piccini P, et al. Basal ganglia dysfunction in idiopathic REM sleep behaviour disorder parallels that in early Parkinson’s disease. Brain 2016;139:2224–2234 doi: 10.1093/brain/aww124. 4. Zhao L, Alsop DC, Detre JA, Dai W. Global fluctuations of cerebral blood flow indicate a global brain network independent of systemic factors. J. Cereb. Blood Flow Metab. 2019;39:302–312 doi: 10.1177/0271678X17726625. 5. Griffanti L, Douaud G, Bijsterbosch J, et al. Hand classification of fMRI ICA noise components. Neuroimage 2017;154:188–205 doi: 10.1016/j.neuroimage.2016.12.036. 6. Beckmann C, Mackay C, Filippini N, Smith S. Group comparison of resting-state FMRI data using multi-subject ICA and dual regression. Neuroimage 2009;47:S148 doi: 10.1016/s1053-8119(09)71511-3. 7. Yao N, Shek-Kwan Chang R, Cheung C, et al. The default mode network is disrupted in parkinson’s disease with visual hallucinations. Hum. Brain Mapp. 2014;35:5658–5666 doi: 10.1002/hbm.22577. 8. Kawabata K, Ohdake R, Watanabe H, et al. Visuoperceptual disturbances in Parkinson’s disease. Clin. Park. Relat. Disord. 2020;3:0–5 doi: 10.1016/j.prdoa.2020.100036.Figures
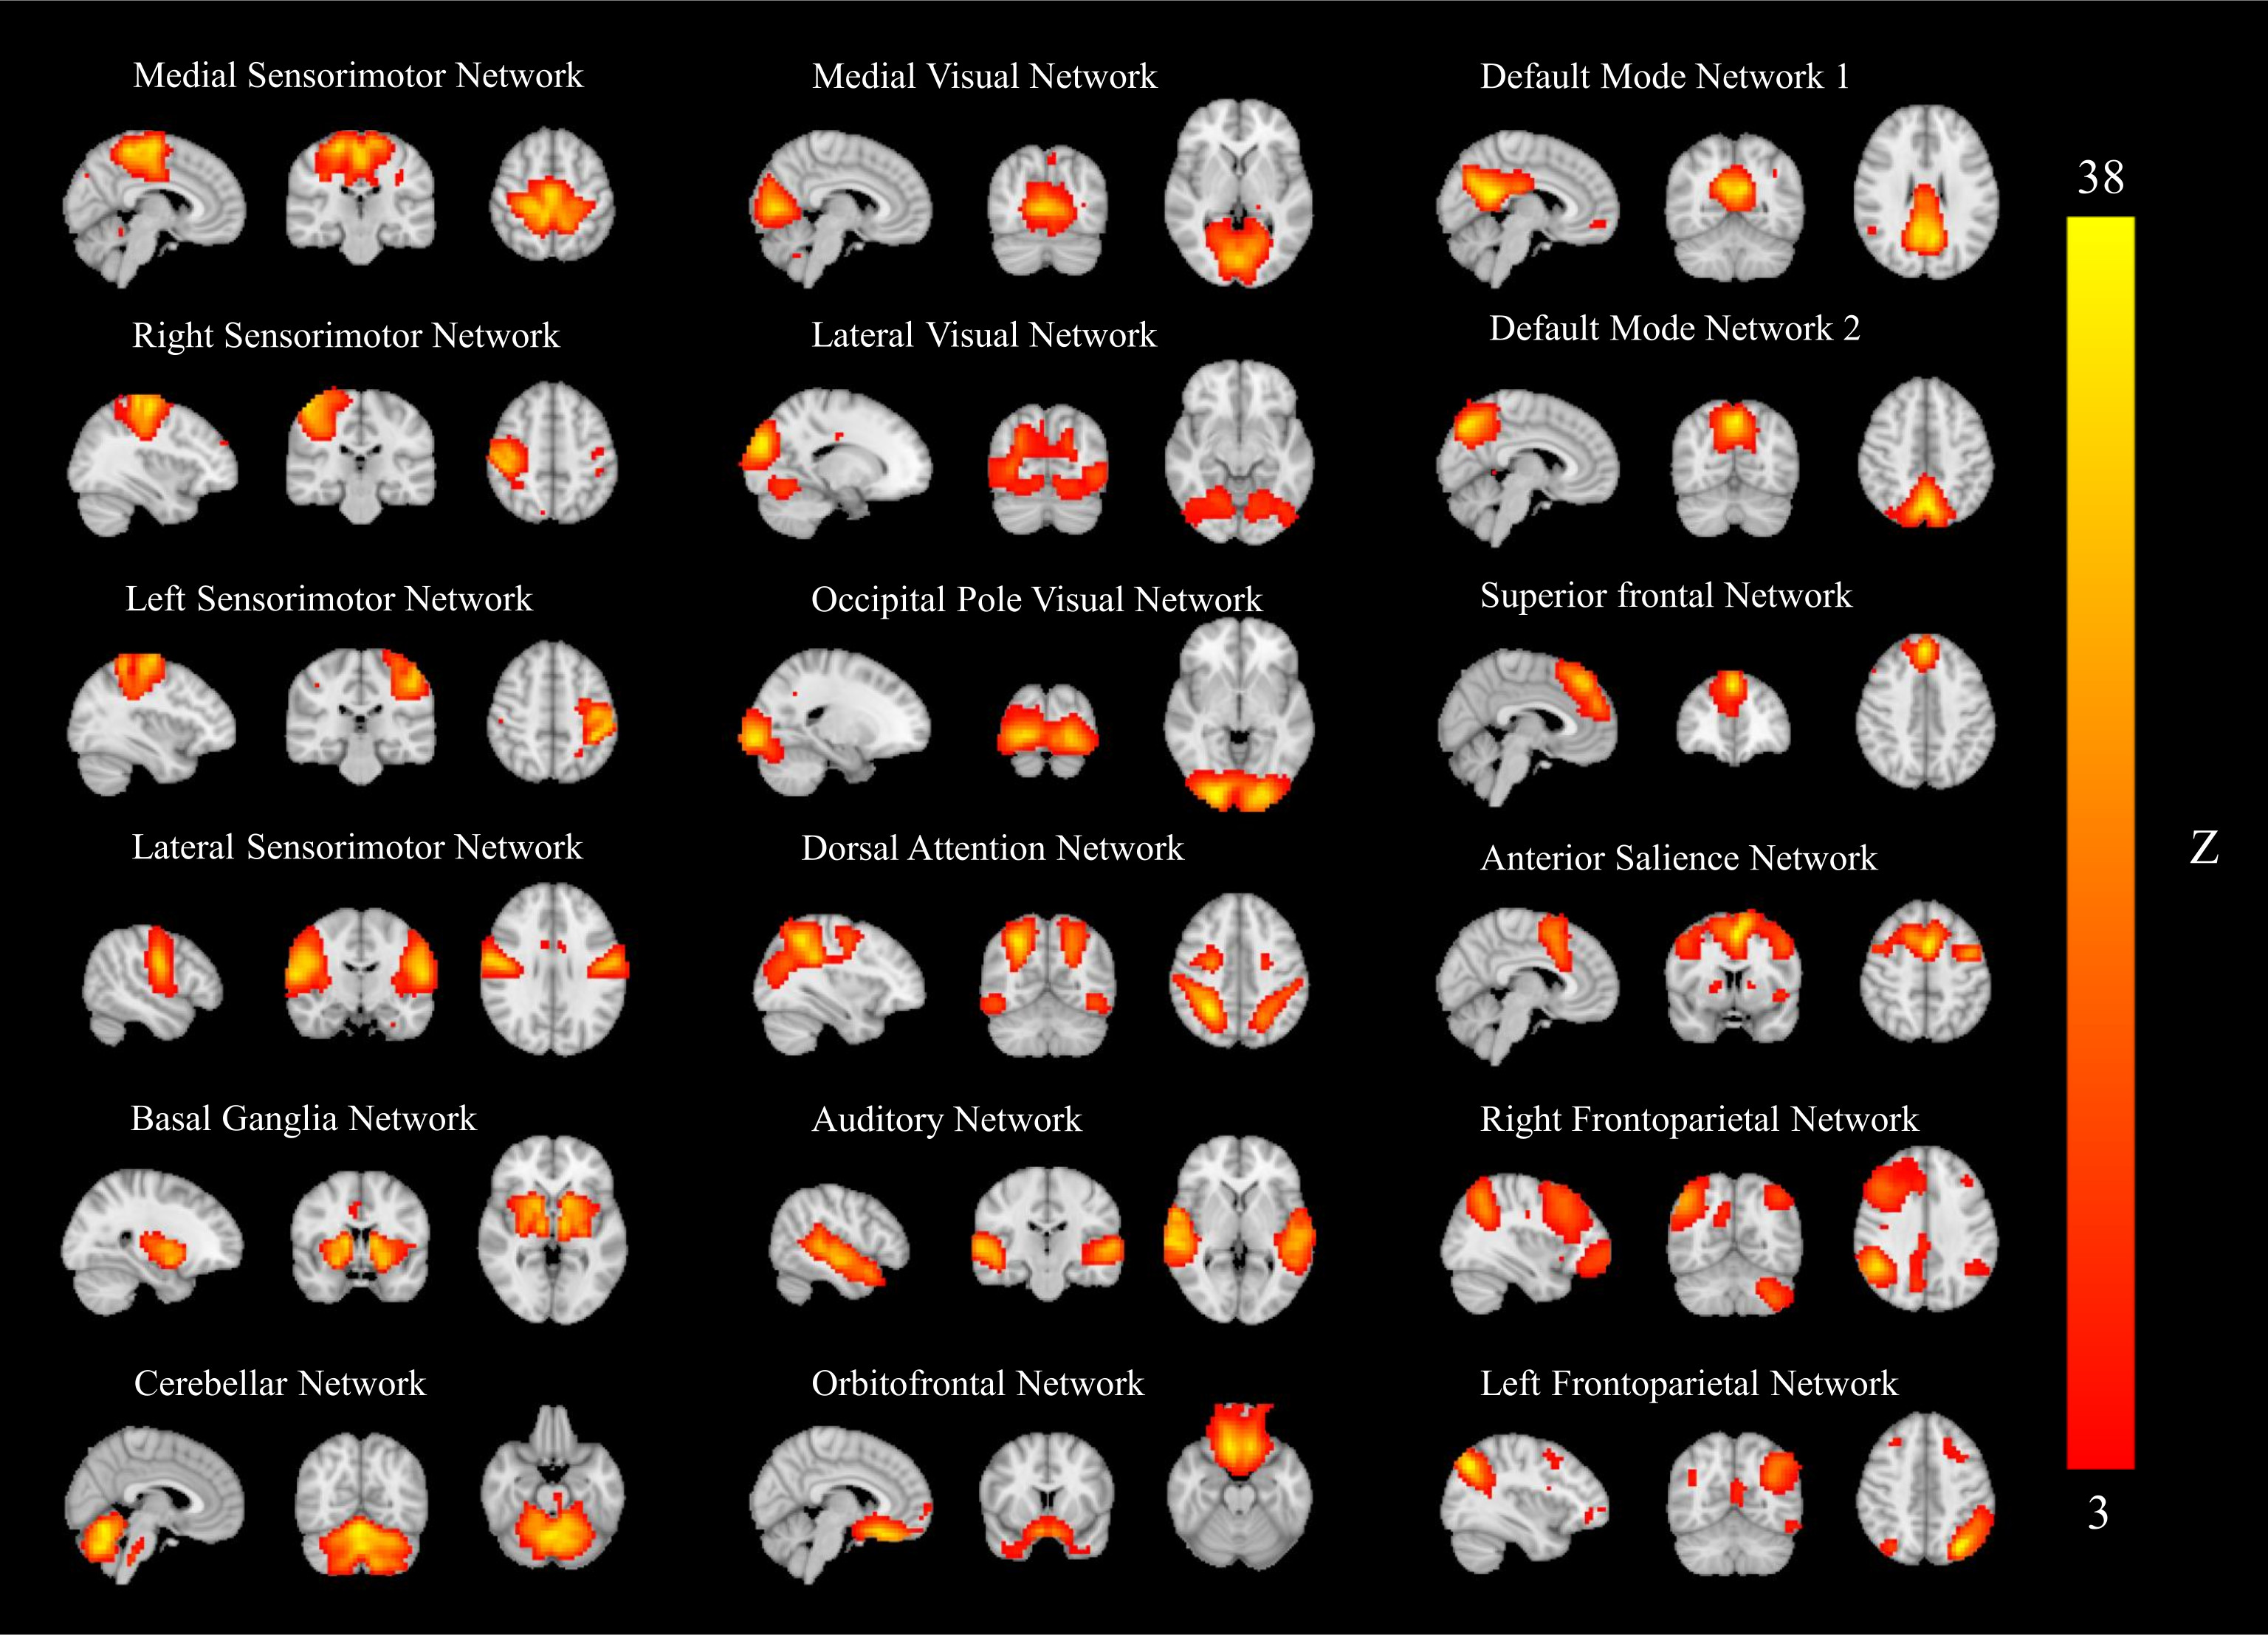
Figure
1.
Eighteen group ICA maps were identified from 13 RBD, 28 NRBD, 20 healthy
controls, and 41 PD patients. The group ICA maps were thresholded according to
the color bar at the right (3<Z<36). Images are displayed in the
radiological convention.
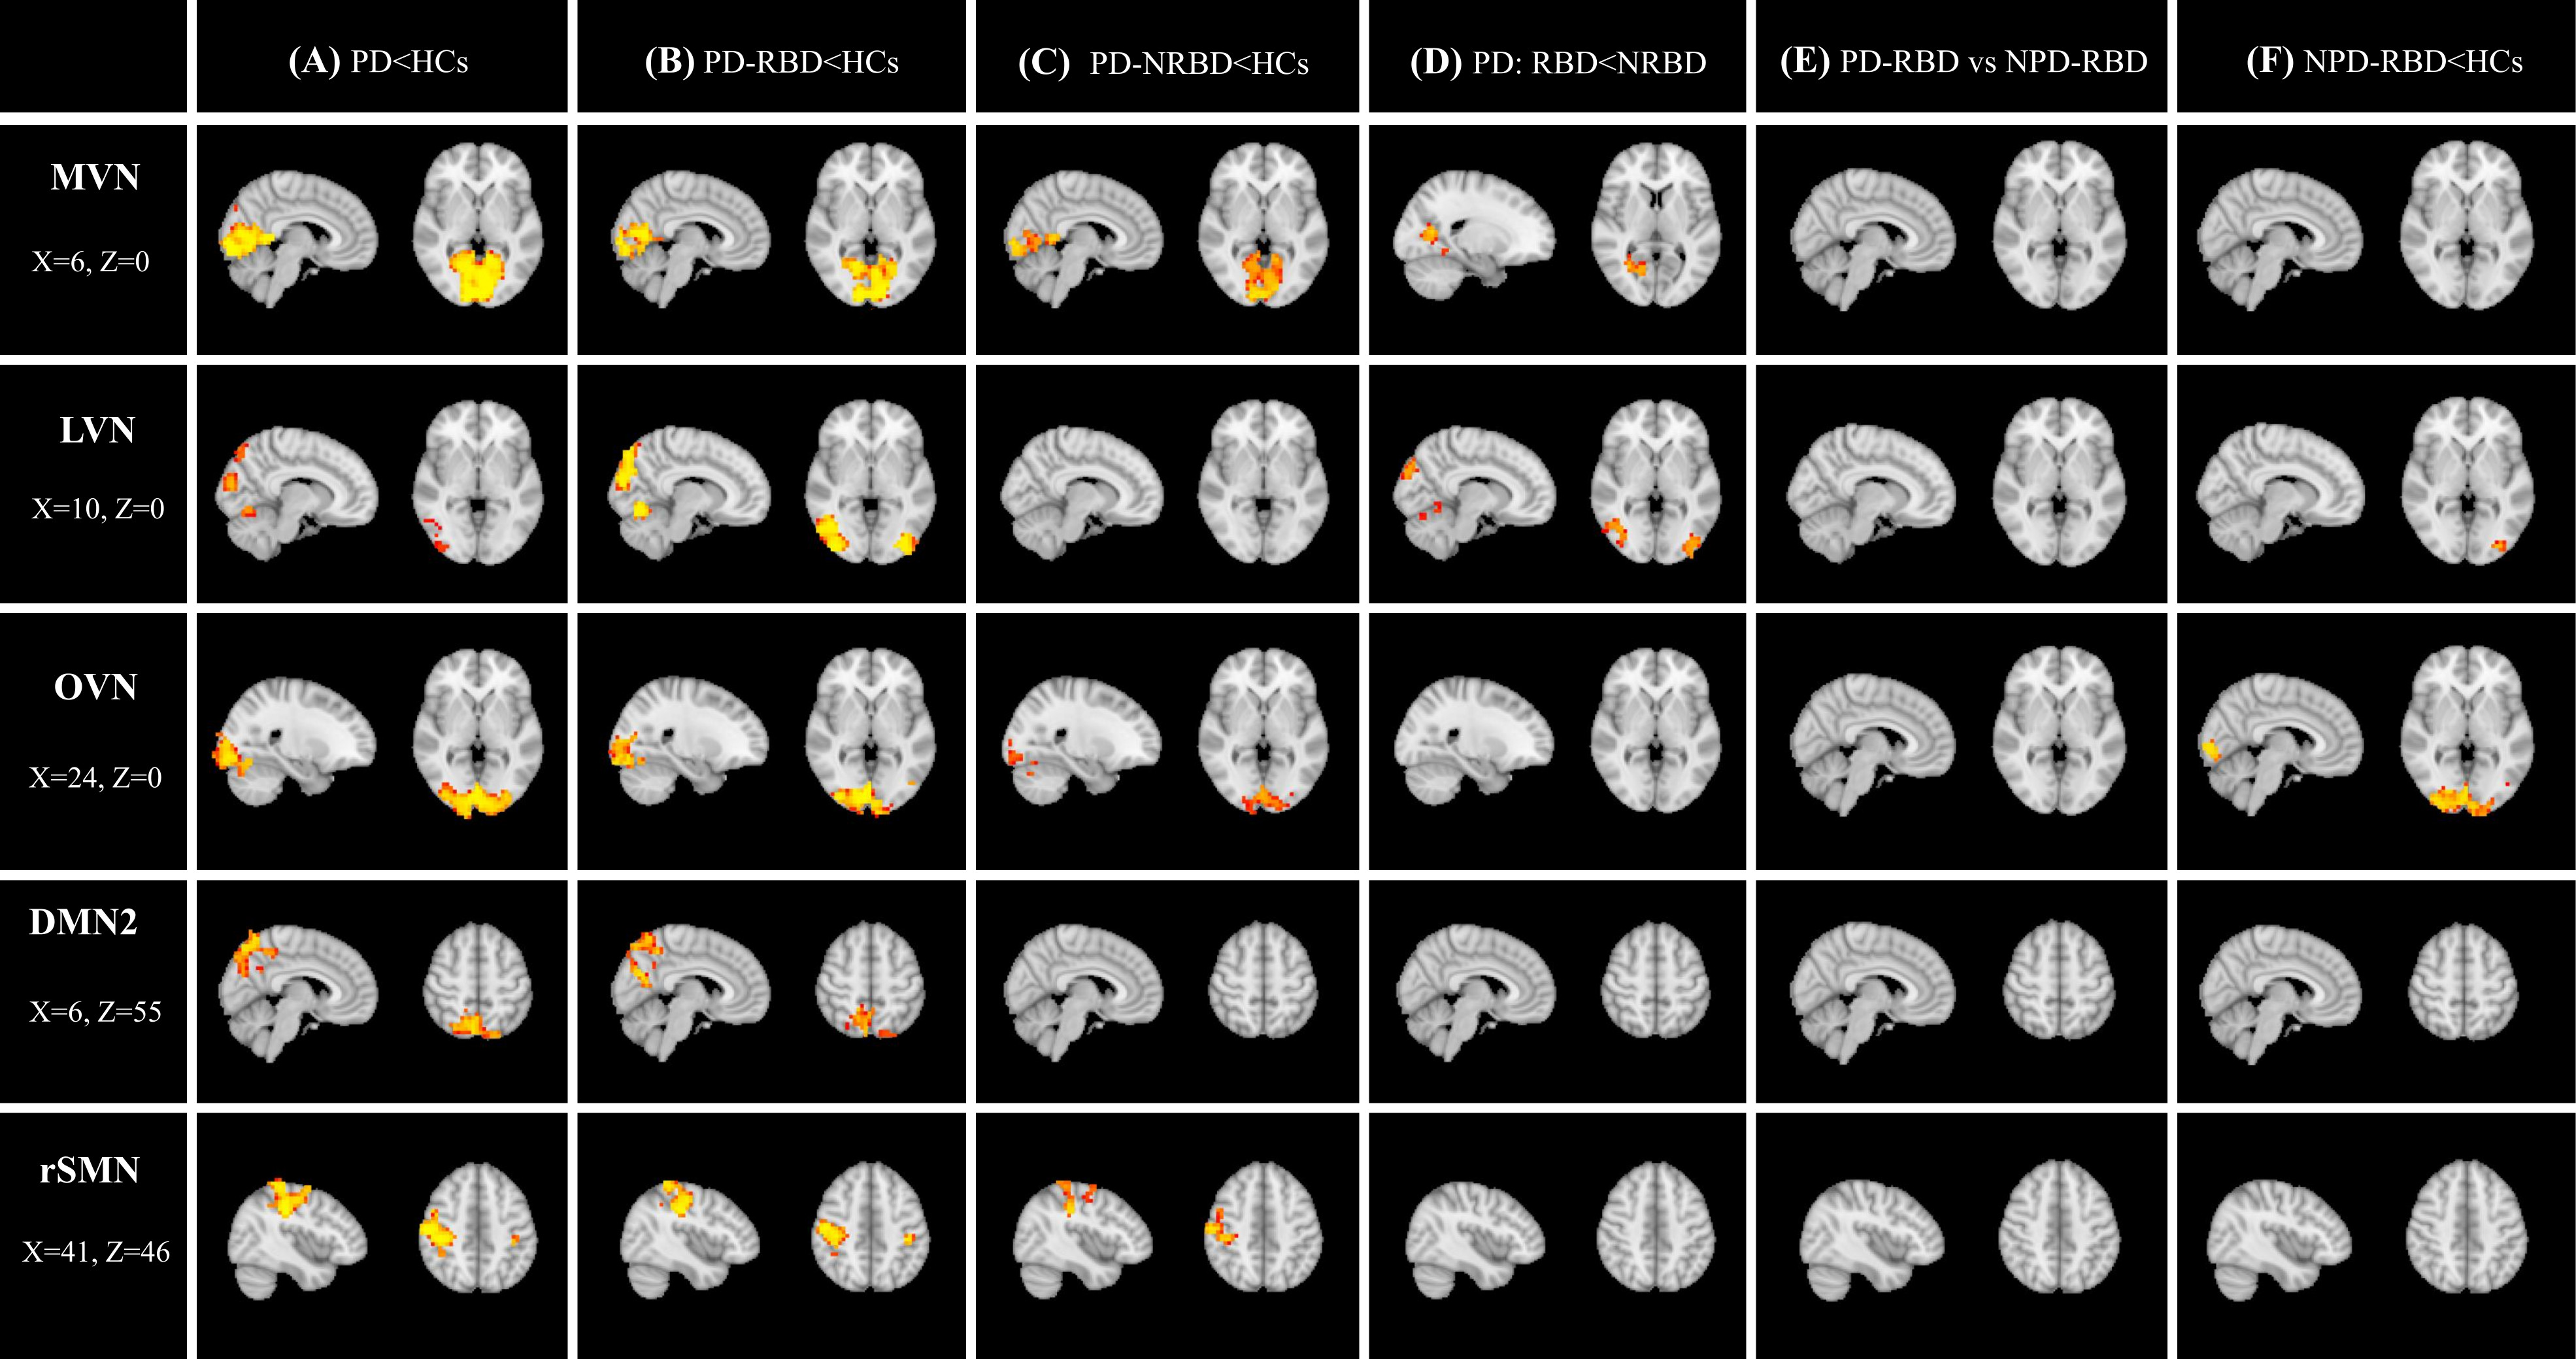
Figure
2.
Regions of decreased resting-state connectivity in the MVN, LVN, DMN, and SMN in (A) PD patients compared to HCs, (B) PD-RBD
compared to HCs, (C) PD-NRBD compared to HCs, (D) PD-RBD compared to PD-NRBD,
and (E) PD-RBD vs NPD-RBD (two-sample t-test,
FWE-corrected p-value<0.05). MVN, LVN, OVN = medial/lateral/occipital visual
networks, DMN2 =default mode network, rSMN = right sensorimotor network. PD =
Parkinson’s disease, RBD = rapid eye movement sleep behavioral disorder,
NPD-RBD = RBD without PD symptoms, HCs = healthy controls
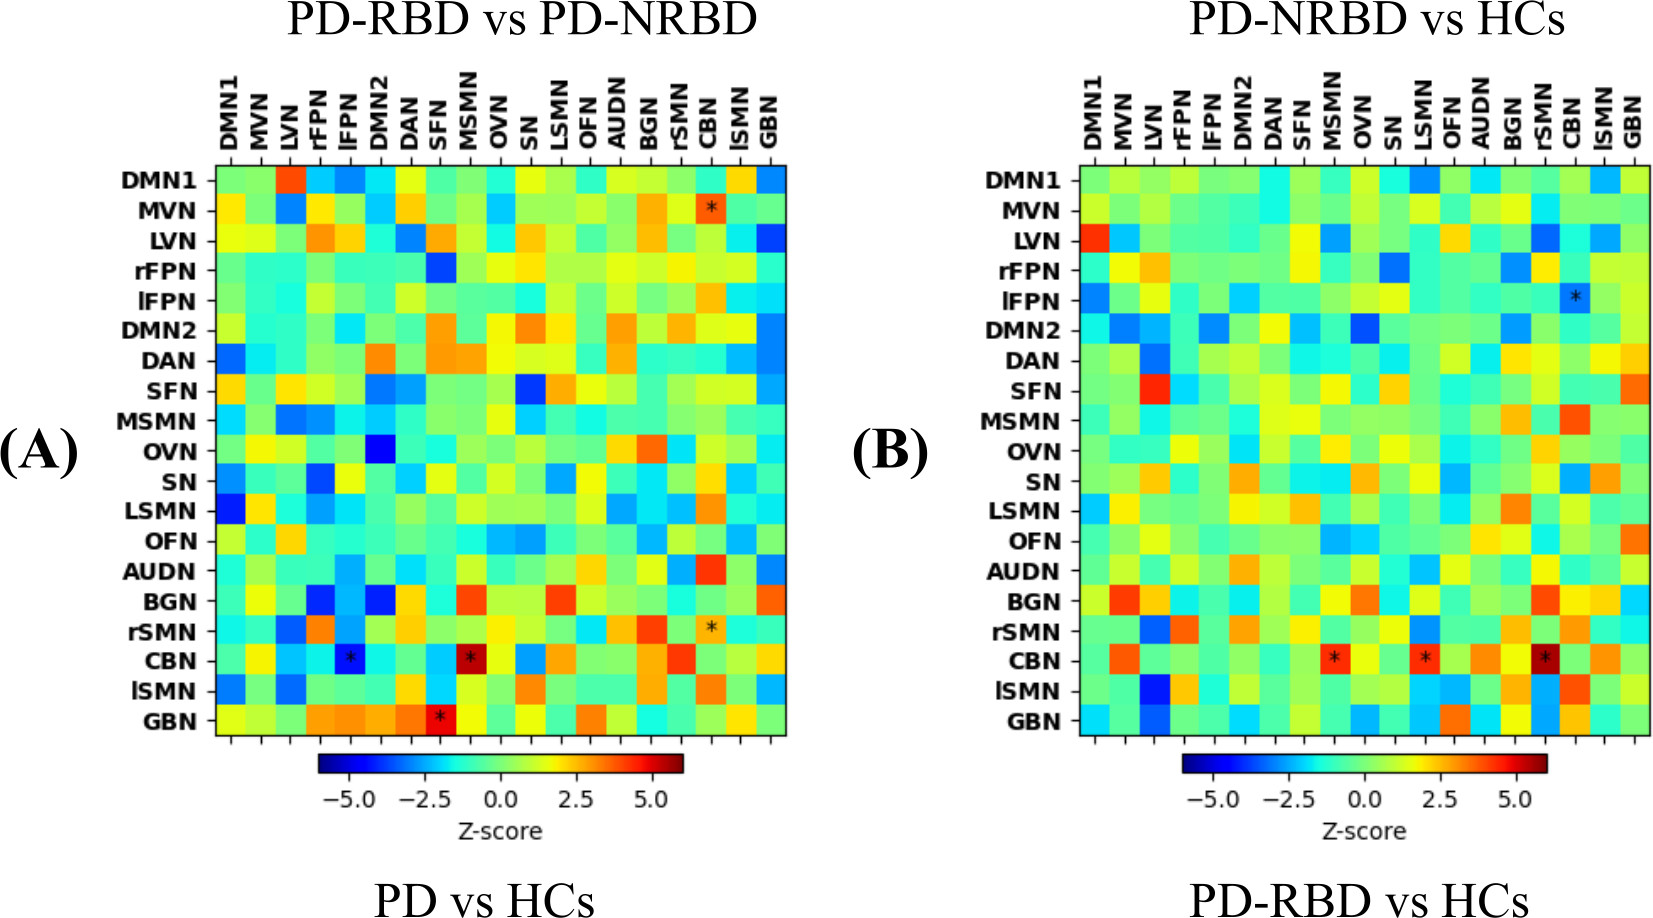
Figure 3. FSLNets analyzed inter-networks
FC correlation matrices. Between-group comparison results for (A) PD patients vs HCs (lower triangle)
and PD-RBD vs PD-NRBD (upper triangle) and (B)
PD-RBD vs HCs (lower triangle) and PD-NRBD vs HCs (upper triangle). Note: Warm * indicates that the first group had significantly stronger inter-networks FC than
the second group and cool color * indicates that the first group had significantly
weaker inter-networks FC than the second group
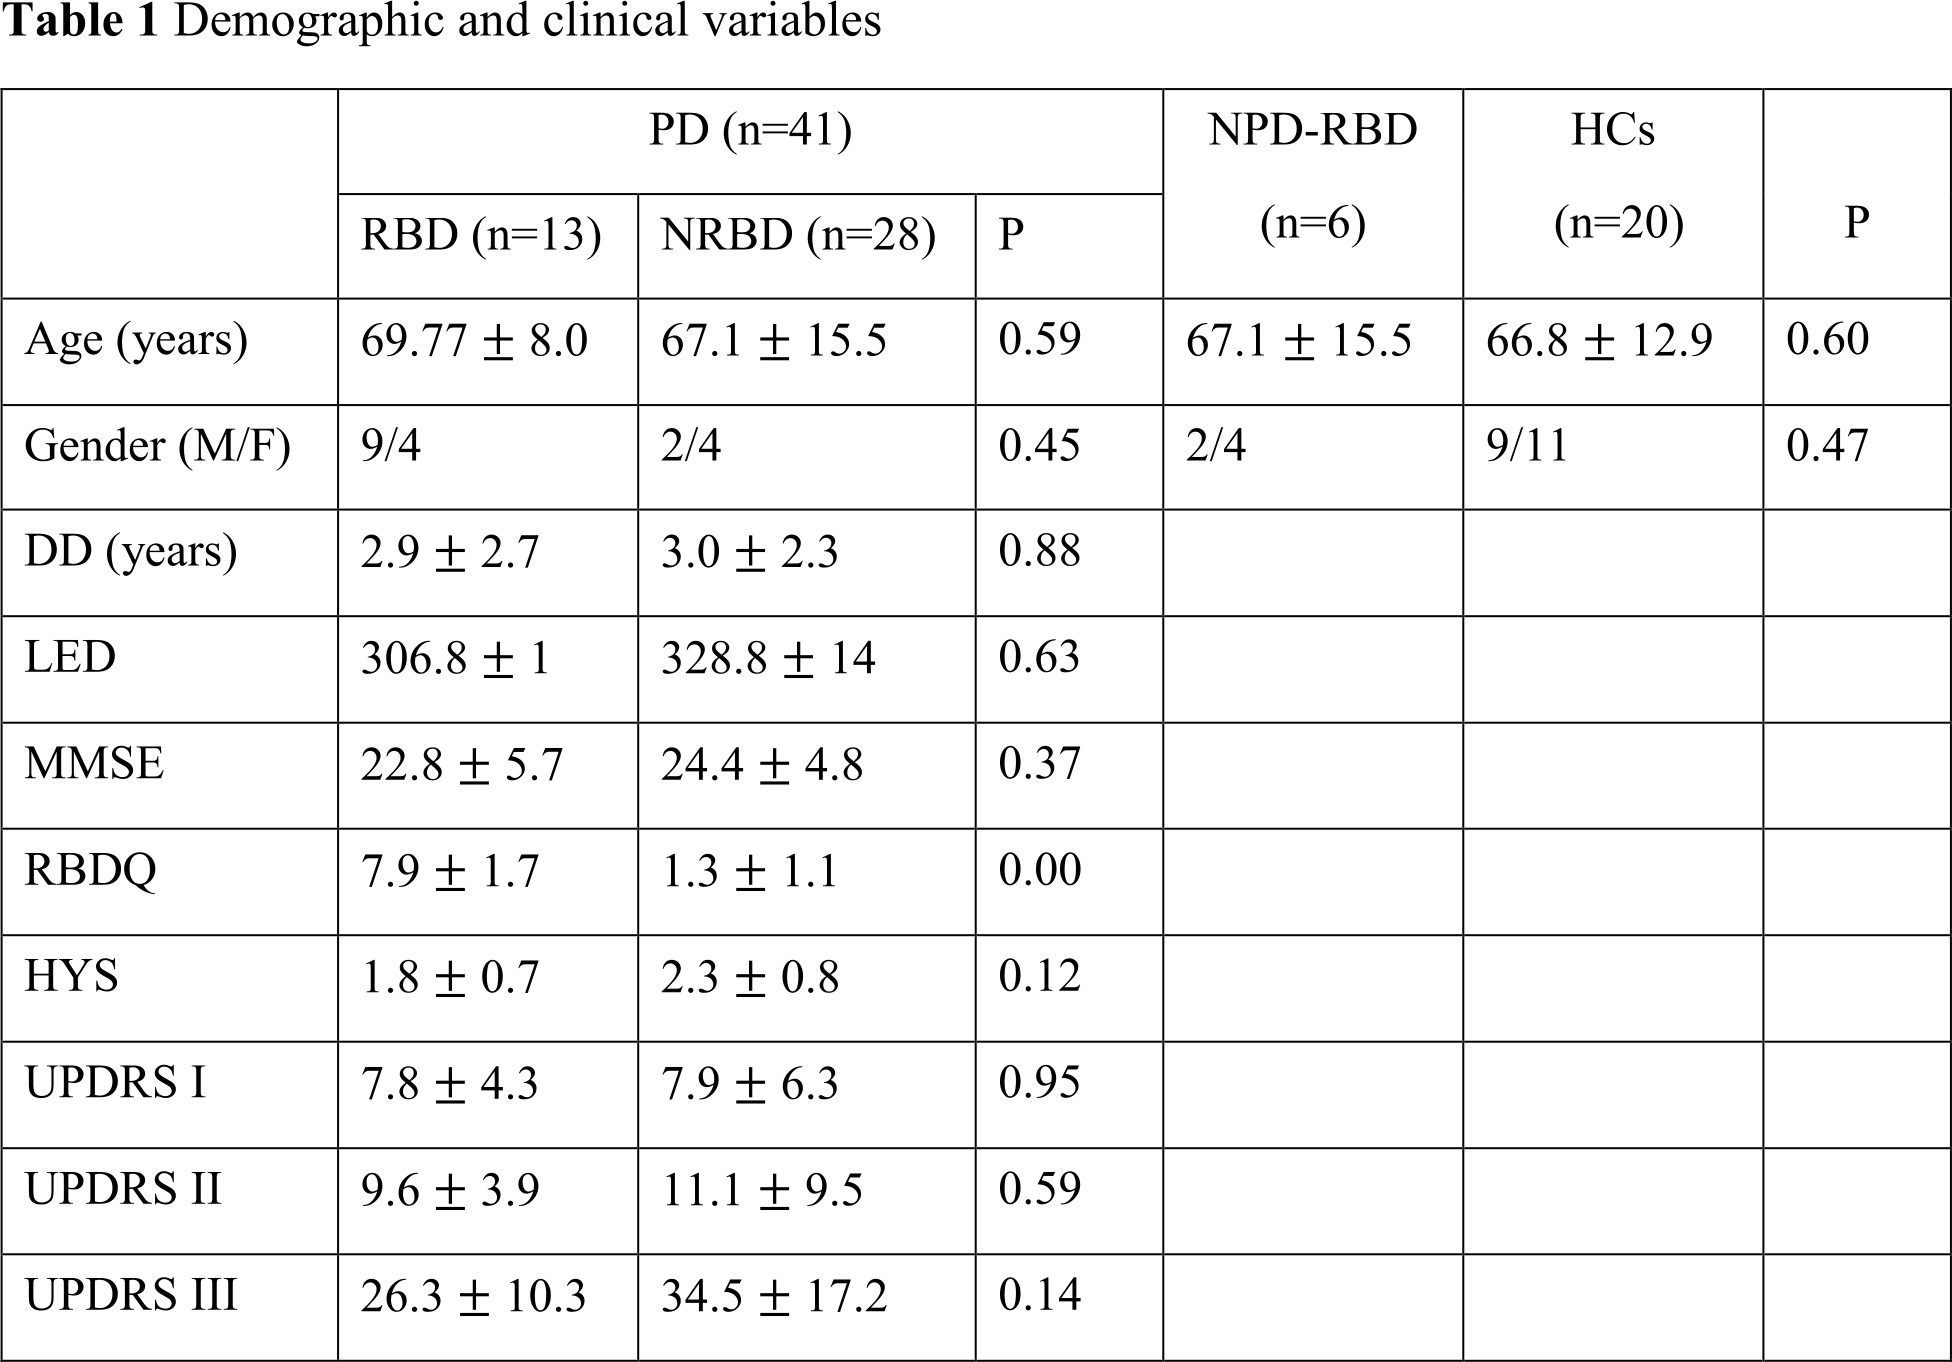
Results are
presented means (SD). DD = disease duration, LED = levodopa equivalent dosage,
MMSE = mini-mental state examination, RBDQ
= Rapid eye movement sleep behavior disorder questionnaire, HYS = Hoehn and
Yahr scale, UPDRS I, II, & III = Unified Parkinson’s Disease Rating Scale part
I, II, and II, PD = Parkinson’s disease, RBD = rapid eye movement sleep
behavioral disorder, NPD-RBD = RBD without PD symptoms, HCs = healthy controls
DOI: https://doi.org/10.58530/2023/3848