3847
Quantifying Organizational Changes of Functional Connectivity Linked to Hypertension in Resting-State Functional MRI1Department of Physics, University of Georgia, Athens, GA, United States, 2Department of Psychology, University of Georgia, Athens, GA, United States, 3Georgia Prevention Institute, Medical College of Georgia, Augusta, GA, United States, 4Department of Radiology and Imaging, Medical College of Georgia, Augusta, GA, United States
Synopsis
Keywords: fMRI (resting state), Hypertension
Using a graph theory approach, functional connectivity differences in a 52 (32 hypertensive, 20 normotensive) subject cohort were tracked using resting-state fMRI. A null generation modification to a difference degree test (DDT) is profiled that resulted in increased true positivity rates in simulations while maintaining nominal false positivity rates. Applying the modified DDT to the hypertension cohort resulted in the discovery of 7 brain regions that exhibit significant groupwise differential expression along with 33 unique differentially expressed connections to other areas in the brain. The results presented agree with previous studies and represent a promising application of the modified DDT.
Introduction
With an 1.28 billion people worldwide estimated to be living with hypertension1 defined by a systolic blood pressure of >140 and/or a diastolic blood pressure of >902, understanding disease progression remains an important topic of research. While chronic hypertension can lead to an increased risk for heart attack, stroke, and Alzheimer’s3, one of the disease’s early targets is cognitive function4, which can lead to brain damage and cognitive decline5. Resting-state functional magnetic resonance imaging (rs-fMRI) has demonstrated utility in tracking these disease-induced changes6-9.In this study we apply a graph theory approach to tracking functional organizational changes linked to hypertension in a 52 (32 hypertensive, 20 normotensive) subject cohort. We accomplish this task by employing a difference degree test (DDT)10 that utilizes binomial statistical testing to find regions of the brain exhibiting a significant number of altered connections to other regions in the brain. In this work, we present a modification of the DDT that results in higher accuracy when applied to simulation data. We will further apply this modified DDT to rs-fMRI data to characterize resting-state functional connectivity (rsFC) organizational changes in the brain of the hypertensive cohort compared with a normotensive group.
Materials and Methods
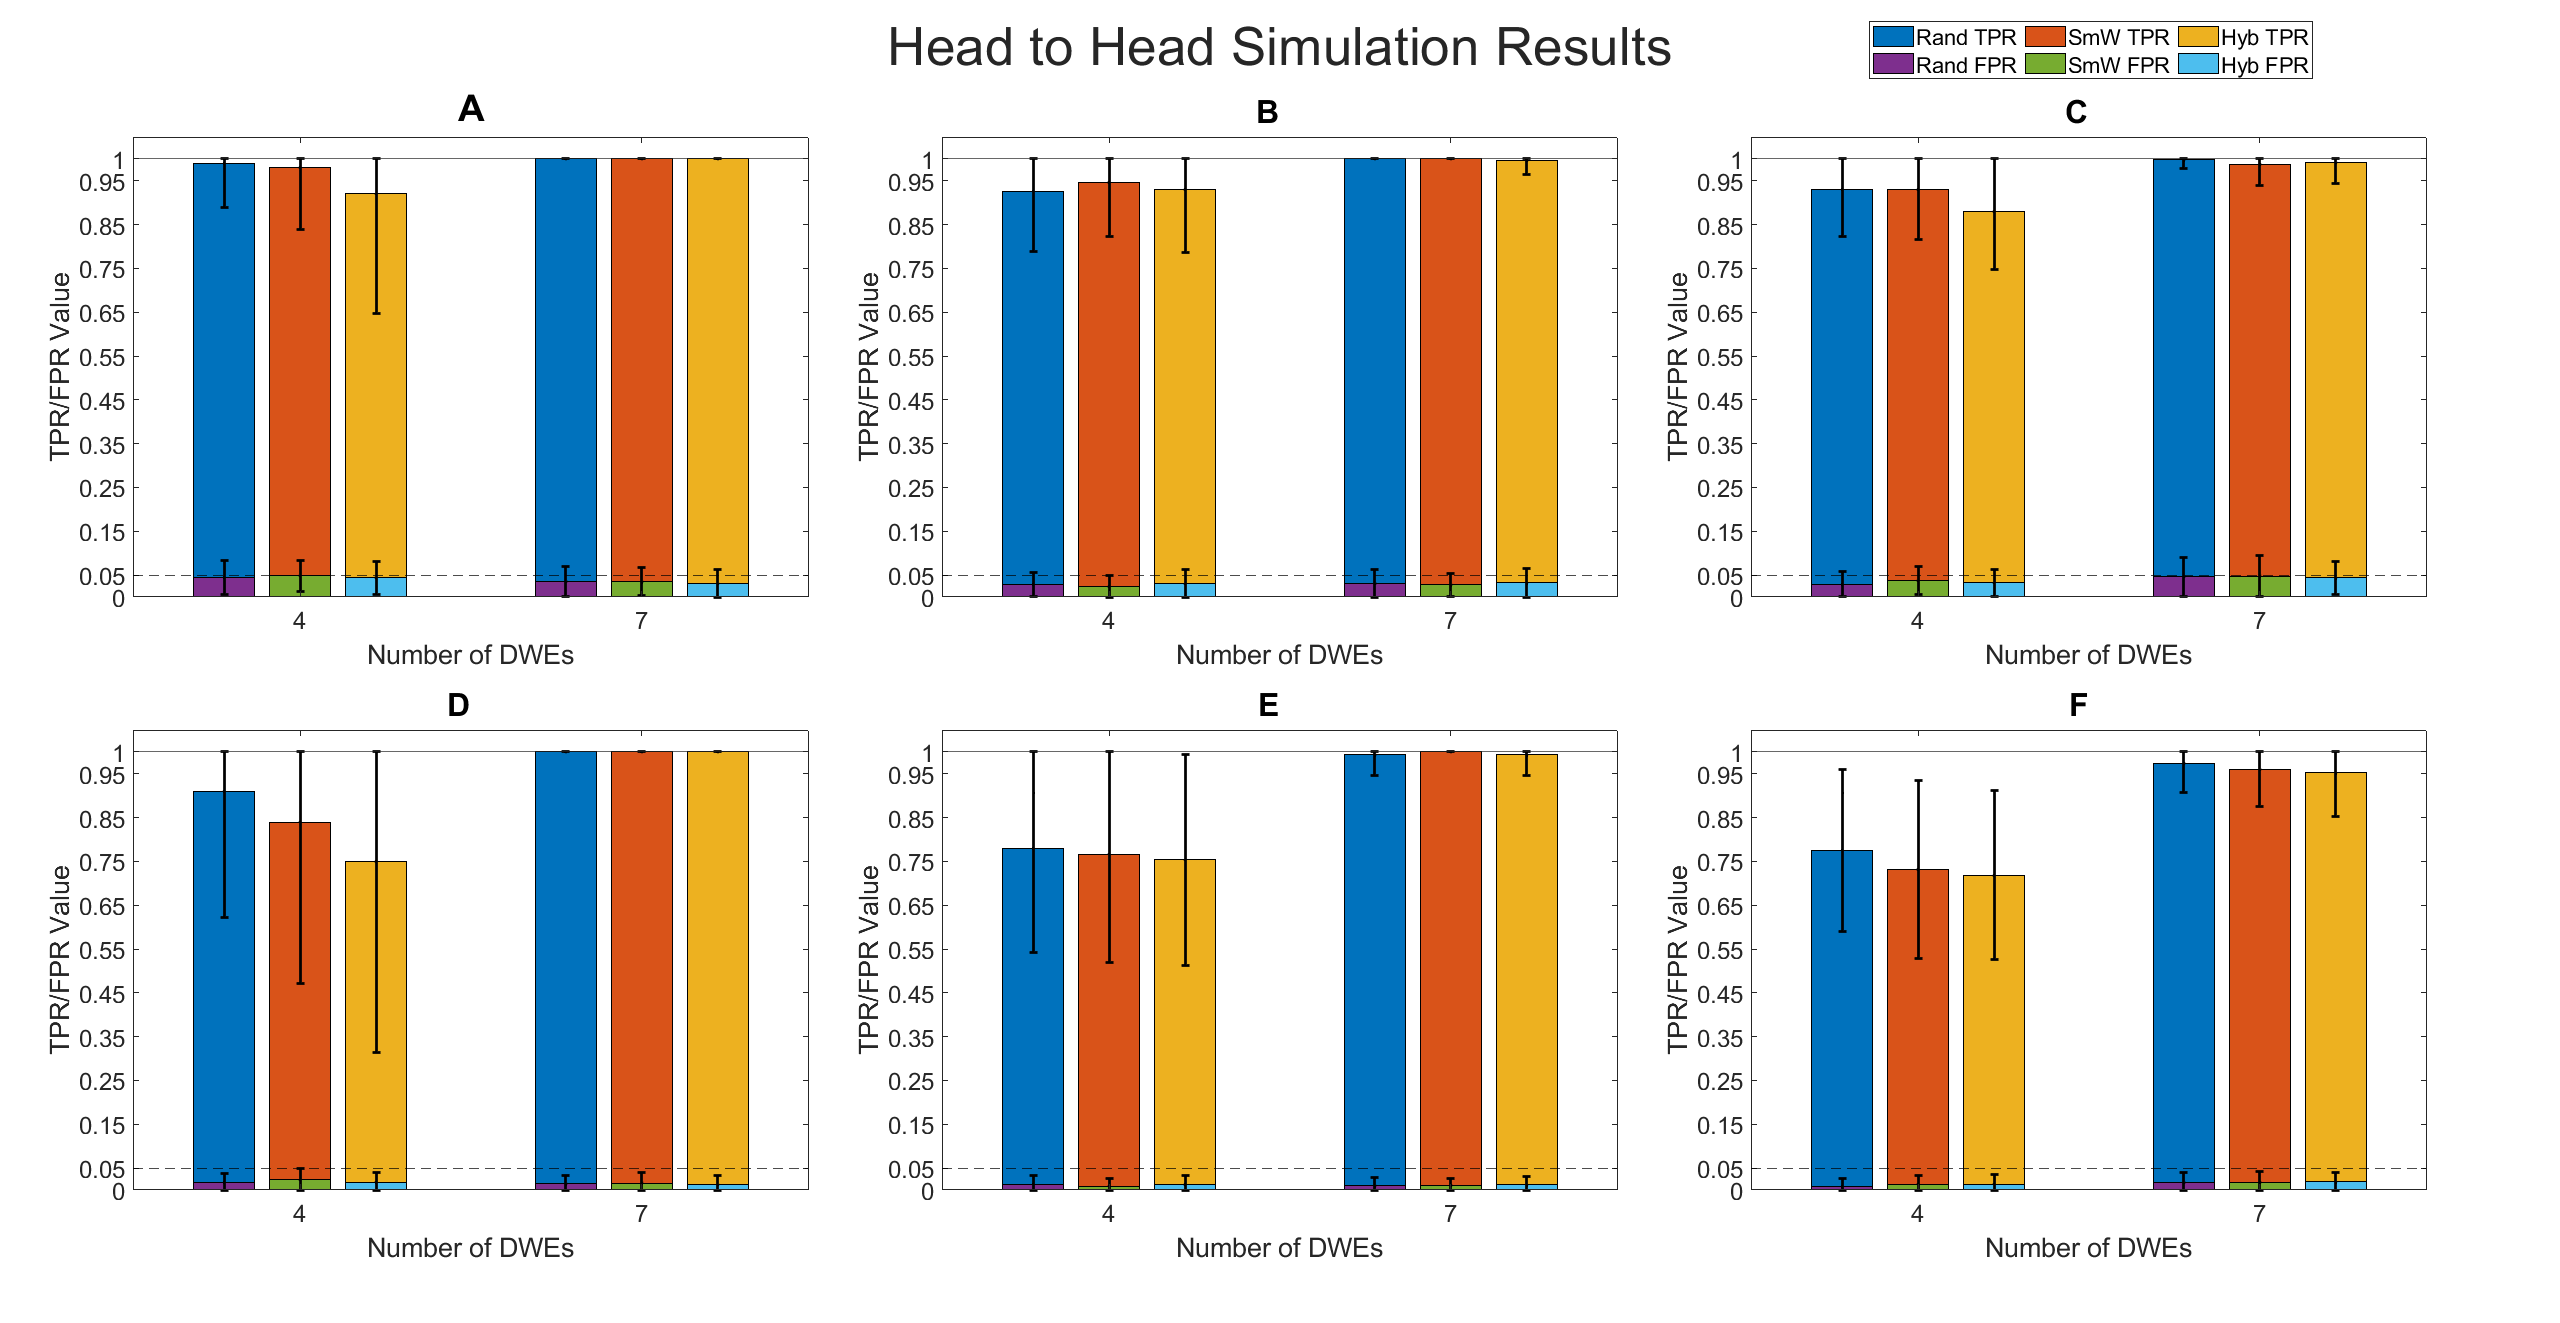
The unmodified DDT technique uses rsFC matrices to determine groupwise differential expression via linear regression. After a null model was built, the DDT performs statistical testing to find a null probability for the number of connections a region should have and tests that against the observed differential expression. In an attempt to improve null model accuracy, we redesigned the null model generation algorithm into a brute-force mean/variance matching algorithm (BFMV)11, which iteratively dialed in on the mean and variance of the matrix via vector addition.Simulation: We validated the modified DDT via three different simulation modalities – random, small world, and hybrid – and compared the performance to the unmodified DDT by examining true (TPR) and false positivity rates (FPR)10. The TPR and FPR values reported here differ from a per-run TPR/FPR as they were averaged over 100 trials.
Experiment: All 52 subjects (mean age of 40 years ± 3, with 22 males, 30 females, 19 Caucasian, and 33 African American subjects) – 32 who fit the criteria for hypertension, and 20 who were normotensive – underwent rs-fMRI scanning. Resting state fMRI scans (2D-EPI, 48 slices, TR=1200ms, TE=33.00ms, FA=57°, FOV=240x240 mm2, matrix=120x120, slice thickness=3mm, 500 total volumes) were acquired on a Siemens MAGNETOM Vida (Siemens Health Solutions, Malvern, PA) using a BioMatrix Head/Neck 20-channel receive coil.
Data preprocessing was performed using the Statistical Parametric Mapping 12 (SPM12)12 toolkit with MATLAB 2021b (The MathWorks, Inc., Natick, MA) and included unwarping, slice timing correction, and registration to a reference subject. Each subject was further processed using time series detrending and z-score normalization before masking into 90 cortical regions based on the MNI152 atlas13. After obtaining the mean regional time series matrix comprised of the mean activation of 90 cortical regions over 500 time-steps, partial correlation analysis was performed to obtain each subject’s individual rsFC matrix.
Results
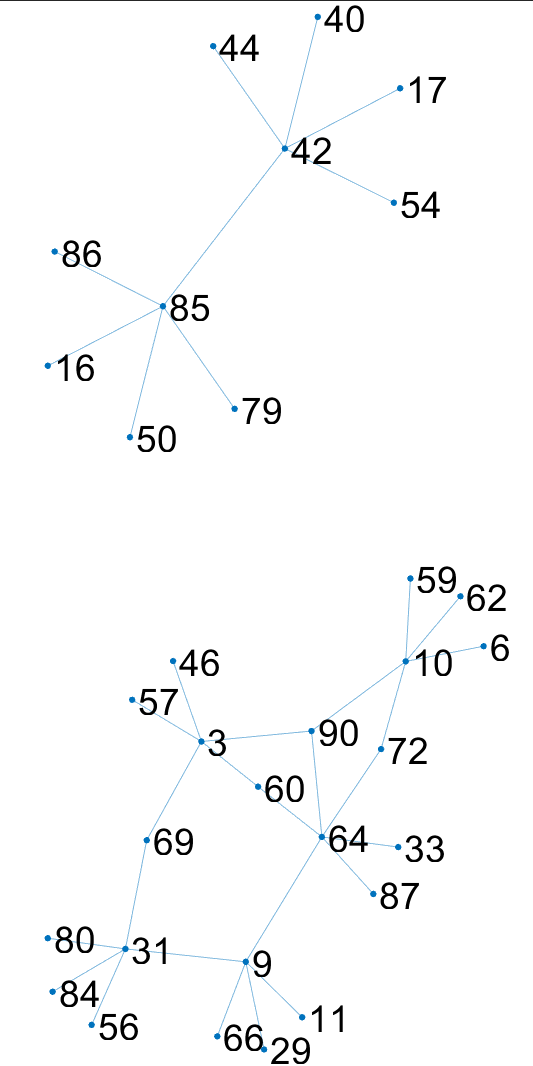
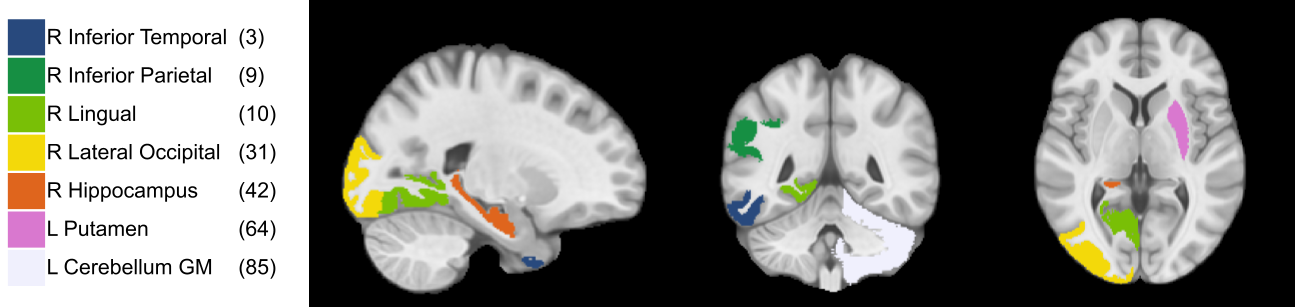
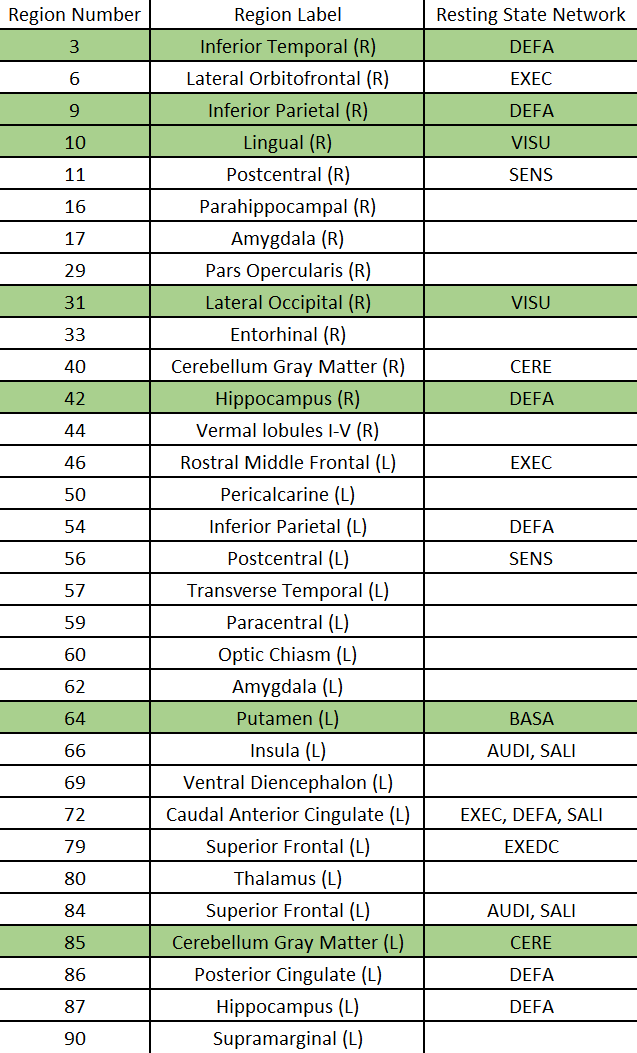
The results of simulation are seen in Figure 1 where the modified DDT shows higher or equivalent TPR in every simulation while maintaining a FPR below a nominal value of 5%. Also seen in Figure 1, the modified DDT experiences a lower standard deviation in every simulation when directly compared to the unmodified DDT.Applying the modified DDT to the experimental hypertension data finds 7 hub nodes and 33 unique DWEs, the graphical representation of which can be seen in Figure 2. The anatomical locations of the 7 hub nodes can be seen in Figure 3 where the node number has also been listed alongside the anatomical location. Lastly, a detailed breakdown of each node and their associated resting state network can be seen in Table 1 below.
Discussion
Through simulation, we have verified that the modified DDT produces higher TPR values with smaller variation in those results as compared to the unmodified DDT. Along with this TPR improvement, we have also shown that FPR values stay below the nominal value of 5%. These results imply that, with our BFMV modification to the DDT, we have increased the sensitivity to help ensure that we do not miss more subtle differences that can be observed between groups.When we applied the modified DDT to our experimental data, we were able to detect changes in the default mode, visual, basal ganglia, and cerebellar resting state networks. Previous study of rsFC changes linked to hypertension have shown changes in the default mode network14 as well as changes the visual network6, which are both supported by the results presented. Other work has also found a change in functional connection in the right inferior parietal (shown here as node 9) and the right lateral occipital15 (node 11), consistent with this work as well.
Conclusion
The modified DDT has shown sensitivity in detecting groupwise differences in rsFC. The BFMV modification resulted in improved TPR that maintained nominal FPR giving confidence to the experimental results of 7 hubs and 33 unique DWEs. The modified DDT represents a promising tool that can lead to better understanding of the hidden changes caused by disease.Acknowledgements
This work is funded by NIH grant R01HL143440 and the Augusta University MRI Intramural Program.References
1. (NCD-RisC), N.R.F.C., Worldwide trends in hypertension prevalence and progress in treatment and control from 1990 to 2019: a pooled analysis of 1201 population-representative studies with 104 million participants. Lancet, 2021. 398(10304): p. 957-980.
2. Unger, T., et al., 2020 International Society of Hypertension Global Hypertension Practice Guidelines. Hypertension, 2020. 75(6): p. 1334-1357.
3. Sierra, C., Hypertension and the Risk of Dementia. Front Cardiovasc Med, 2020. 7: p. 5.
4. Kelly, D.M. and P.M. Rothwell, Blood pressure and the brain: the neurology of hypertension. Pract Neurol, 2020. 20(2): p. 100-108.
5. Gąsecki, D., et al., Hypertension, brain damage and cognitive decline. Curr Hypertens Rep, 2013. 15(6): p. 547-58.
6. Carnevale, L., et al., Brain Functional Magnetic Resonance Imaging Highlights Altered Connections and Functional Networks in Patients With Hypertension. Hypertension, 2020. 76(5): p. 1480-1490.
7. Li, X., et al., Disrupted Frontoparietal Network Mediates White Matter Structure Dysfunction Associated with Cognitive Decline in Hypertension Patients. J Neurosci, 2015. 35(27): p. 10015-24.
8. Son, S.J., et al., Effect of hypertension on the resting-state functional connectivity in patients with Alzheimer's disease (AD). Arch Gerontol Geriatr, 2015. 60(1): p. 210-6.
9. Rashid, B., et al., Aberrant patterns of default-mode network functional connectivity associated with metabolic syndrome: A resting-state study. Brain Behav, 2019. 9(12): p. e01333.
10. Higgins, I.A., et al., A difference degree test for comparing brain networks. Hum Brain Mapp, 2019. 40(15): p. 4518-4536.
11. Zalesky, A., A. Fornito, and E. Bullmore, On the use of correlation as a measure of network connectivity. Neuroimage, 2012. 60(4): p. 2096-106.
12. Penny, W.D., et al., Statistical parametric mapping: the analysis of functional brain images. 2011: Elsevier.
13. Fonov, V., et al., Unbiased average age-appropriate atlases for pediatric studies. Neuroimage, 2011. 54(1): p. 313-27.
14. Shah, C., et al., Changes in brain functional connectivity and cognition related to white matter lesion burden in hypertensive patients from SPRINT. Neuroradiology, 2021. 63(6): p. 913-924.
15. Tseng, P., et al., The dorsal attentional system in oculomotor learning of predictive information. Front Hum Neurosci, 2013. 7: p. 404.
Figures