3843
Neurovascular coupling of the human brain in complex naturalistic stimuli viewing1Physical Sciences Platform, Sunnybrook Research institute, Toronto, ON, Canada, 2Department of Medical Biophysics, University of Toronto, Toronto, ON, Canada, 3University of Waterloo, Waterloo, ON, Canada, 4University of Toronto, Toronto, ON, Canada, 5Turku PET Centre, University of Turku, Turku, Finland
Synopsis
Keywords: fMRI (task based), fMRI (task based), EEG-fMRI
Simultaneously acquired EEG and fMRI data allow for elucidating the neurovascular coupling. Here, we use temporally sparse fast fMRI and continuous EEG to study the correlations between hemodynamic signals and neural oscillations across the cerebral cortex during movie watching.Introduction
The human brain has evolved to deal with complex naturalistics, which can elicit neuronal responses more reliably than simplified stimuli in conventional laboratory experiments 1–3. Accordingly, there is an emerging trend of using naturalistic stimuli, including movies and musical pieces, to study human brain function. (For review, see 4). This experimental technique is more appropriate for probing the neuronal responses related to complex cognitive processes common in daily life, such as narrative comprehension 5,6 and movie watching 7–9. Most experiments using ecologically relevant stimuli measure functional MRI (fMRI) signals using the blood-oxygenation-level dependent (BOLD) contrast. As fMRI signals are the secondary hemodynamic responses to the primary neural responses 10, inferring the neural activity from fMRI signals is complicated by the neurovascular coupling mechanism. Electroencephalography (EEG) 11,12 and magnetoencephalography 13 can be used to obtain non-invasive measurements of neural activity. Concurrent EEG-fMRI recording can thus provide both neural and hemodynamic data when the occurrence of the targeted brain activity cannot be controlled, such as epileptic activity 14–17, or when effects related to learning, adaptation, and memory lead to biases in separate recordings 18,19. In this study, we used temporally sparse concurrent EEG and fast fMRI 20 to study the neurovascular coupling during viewing complex naturalistic stimuli.Methods
Fifteen healthy participants were recruited with written informed consent approved by the Research Ethical Board at Sunnybrook Hospital. All MRI data were measured on a 3T system (Prisma, Siemens, Germany) with a 64-channel head coil array. EEG was measured by an MRI-compatible system (BrainAmp MR Plus, Brain Products, Gilching, Germany) with a 32-channel EEG cap (BrainCap MR, Brain Products, Gilching, Germany). Scalp electrodes were placed following the international 10-20 standard placements. The electrocardiogram (EKG) was also measured by placing an electrode at the back of the participant. The EEG data were sampled at 5 kHz without online filtering and synchronized to the MRI system at the beginning of each radio-frequency excitation 21,22. The cap wire was straightened and fixed along the main magnetic field direction for 50 cm and connected to an EEG amplifier in the MRI bore to reduce the GA induced by the wire 21.Anatomical MRI was collected with MPRAGE imaging. Fast MRI-EEG will be acquired using simultaneous multi-slice inverse imaging (SMS-InI; TR/TE=100/30 ms, FOV=240x240x120 mm, flip angle=25°, resolution=5x5x5 mm3, 24 slices) 23. An interval of 1.4 s without MRI data collection exists between each consecutive SMS-InI acquisition. This interval will give EEG without GA.
EEG was first re-referenced to the average of all channels and then high-pass filtered (0.1 Hz; 3rd-order Butterworth filter). We suppressed the MRI gradient artifact (GA) using the conventional average artifact suppression method 22,24, where an MRI GA template was estimated from 7 consecutive MRI scans. Pulse artifact was reduced by first identifying QRS complexes from the EKG 25 and then using a dynamic modeling method 26. The distribution of instantaneous neuronal currents was estimated by the distributed source modeling with realistic MRI.
Both fMRI and EEG source modeling results were spatially transformed to the MNI305 atlas. Inter-subject correlation (ISC) was calculated between participant pairs at each brain location. EEG ISC was calculated at frequencies between 6 Hz and 150 Hz by the Morlet wavelet transform to extract band-specific oscillation envelopes.
Results
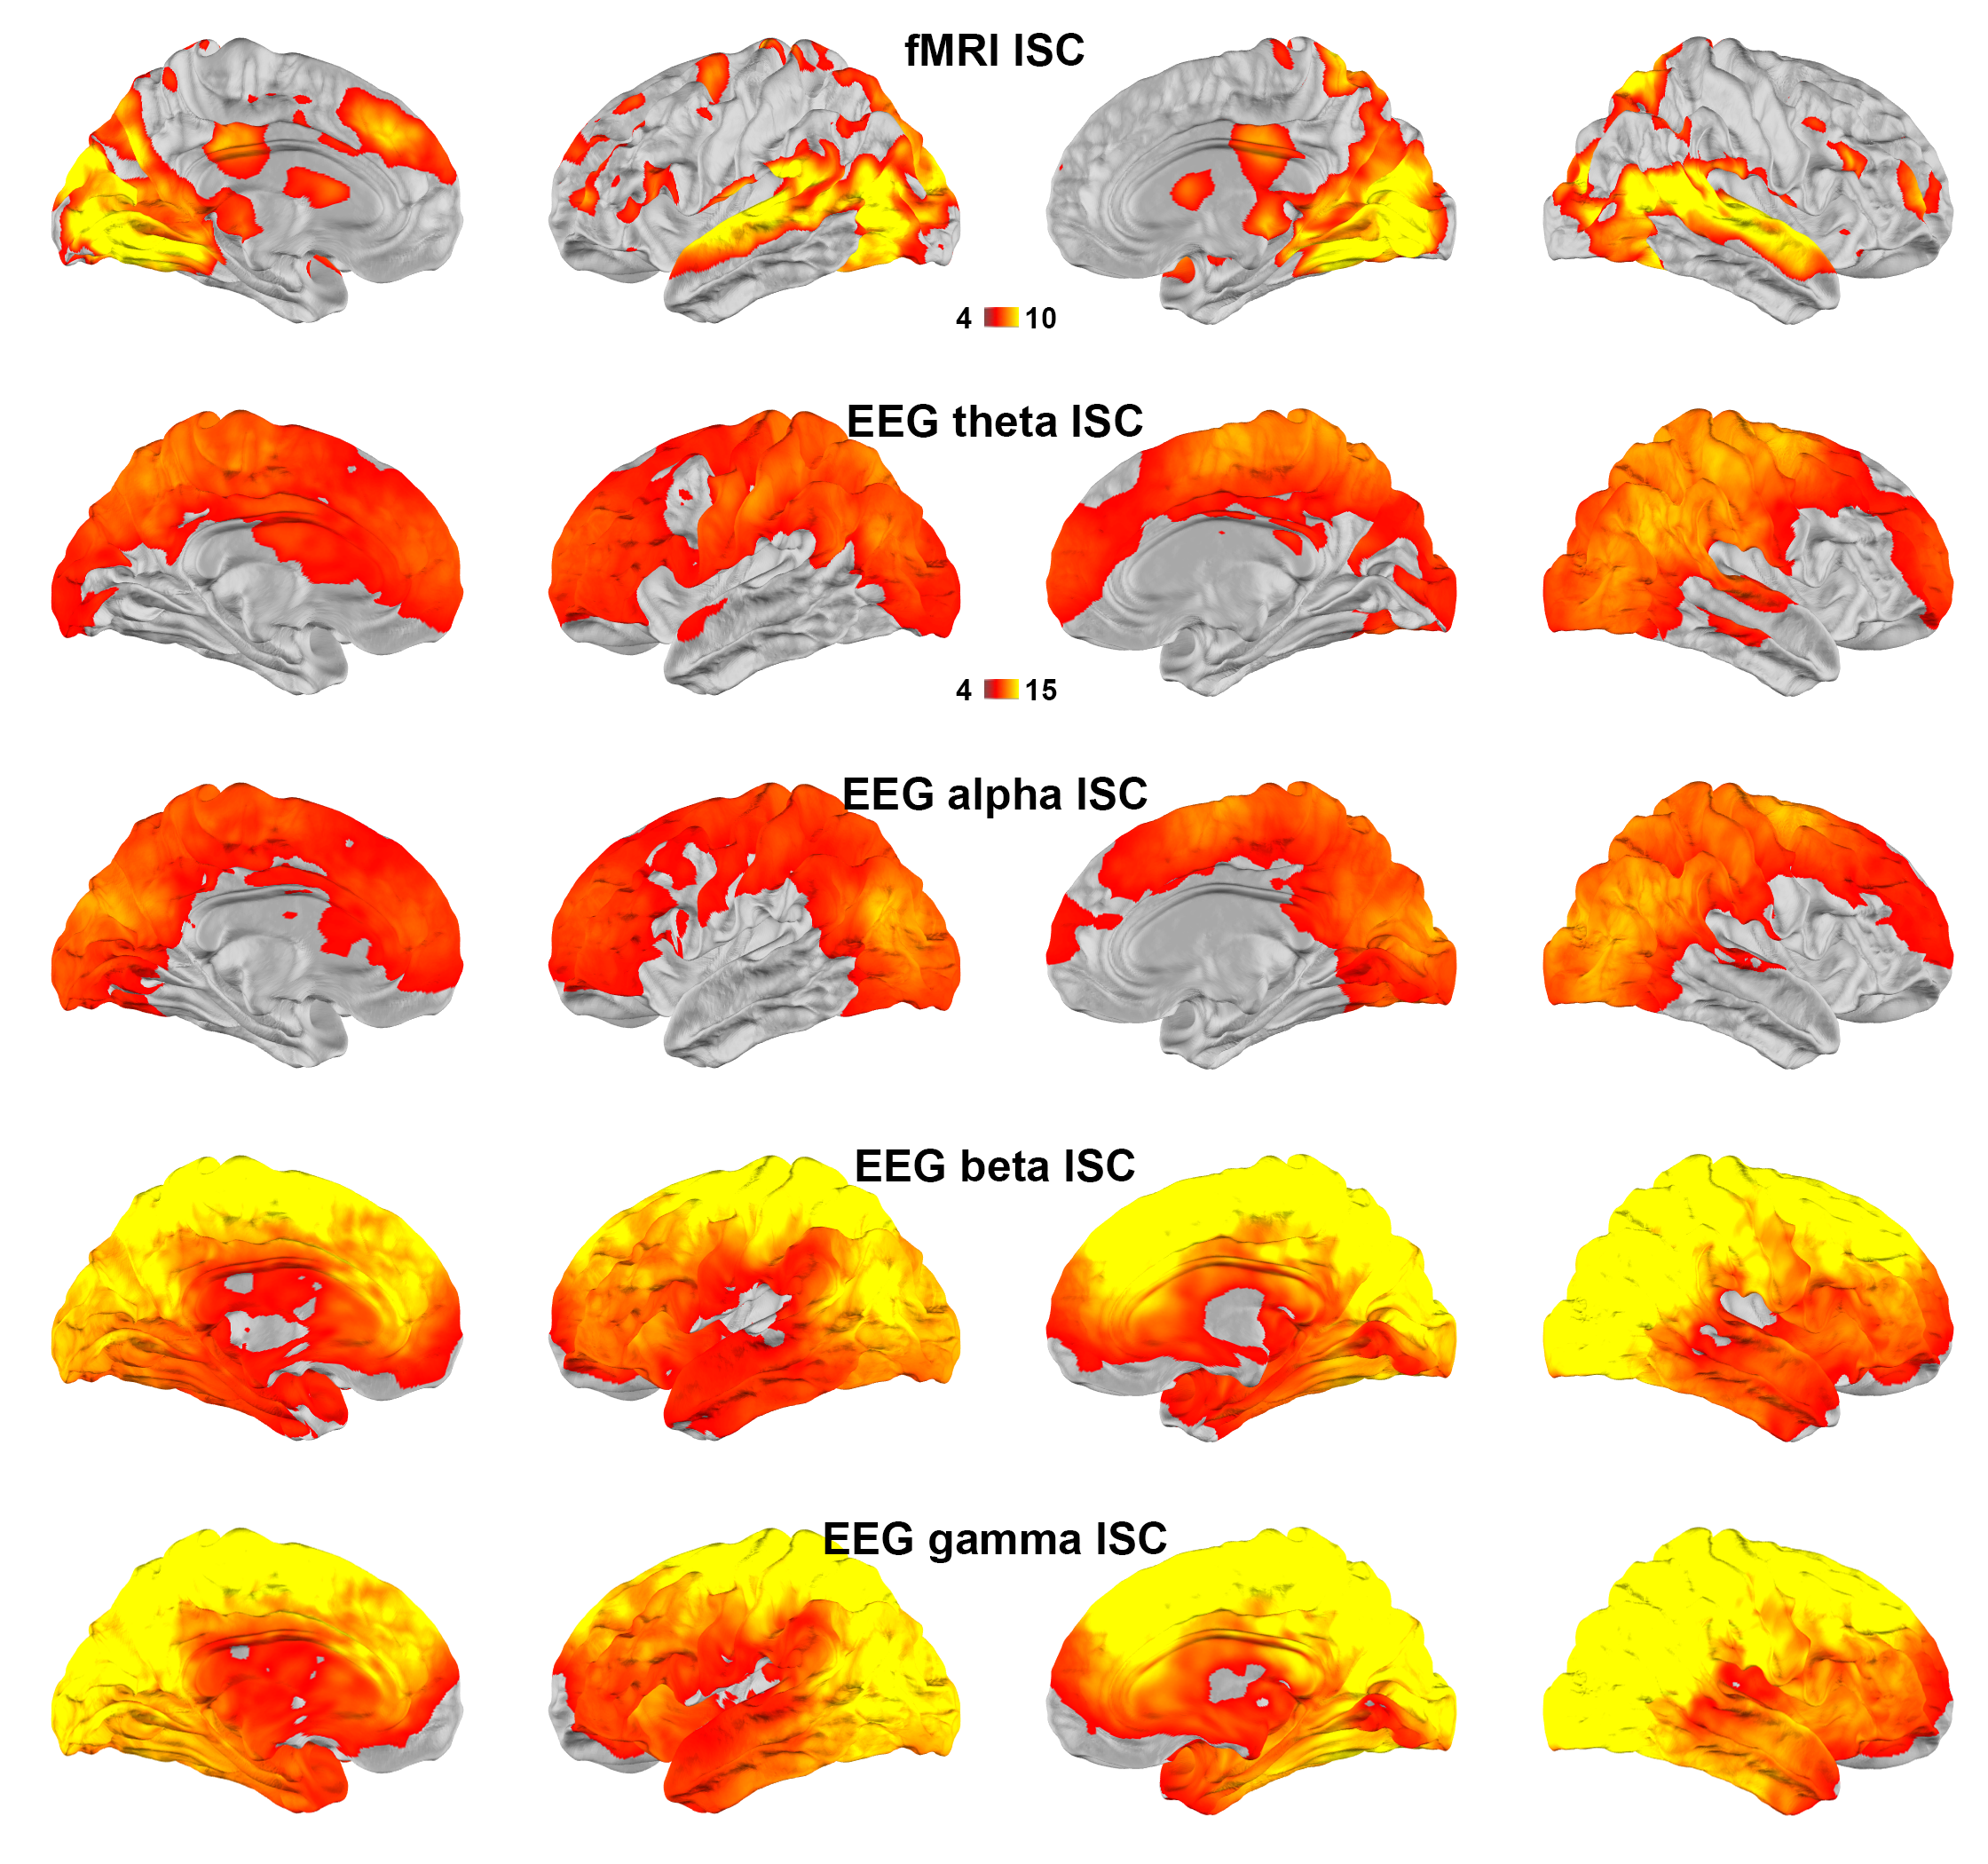
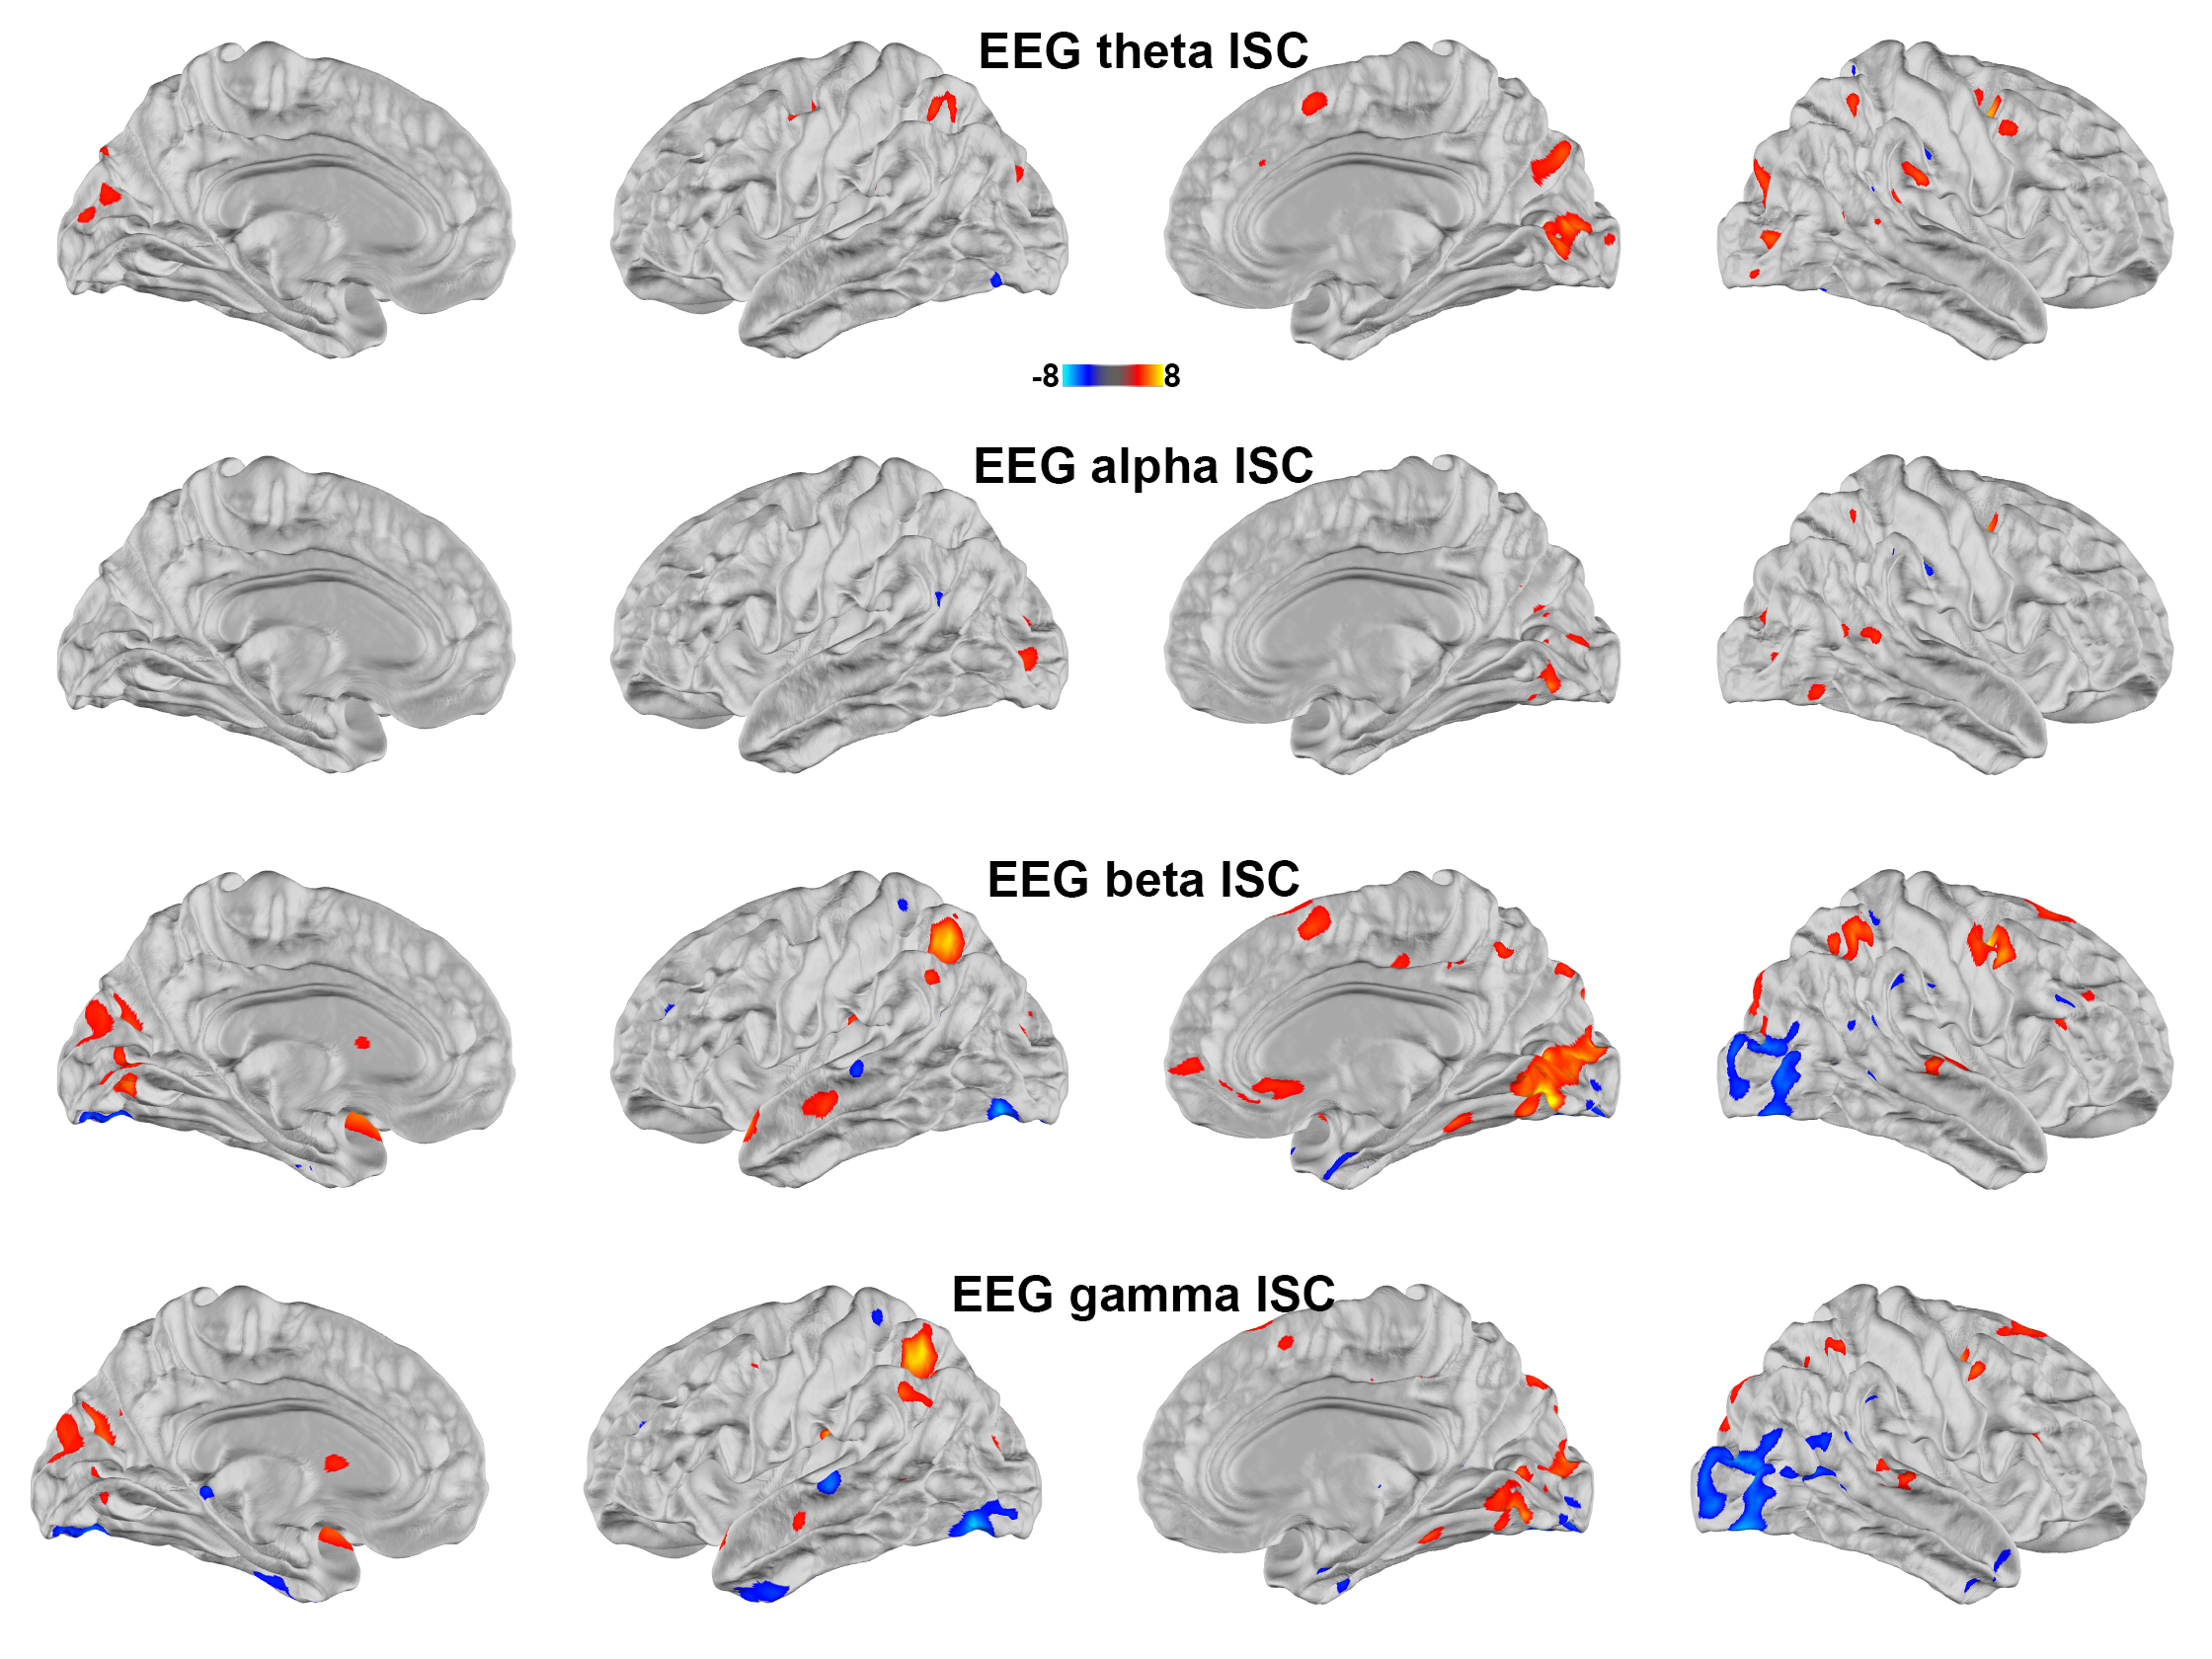
Figure 1 shows maps of significant fMRI ISC and EEG ISC at theta, alpha, beta, and gamma bands. Significant EEG ISC was found at the superficial cortical areas, potentially due to the EEG sensitivity bias. EEG ISCs were progressively stronger at higher frequencies. fMRI ISC were significant in visual and auditory cortices, medial and lateral prefrontal lobes. Visually the distribution was most reminiscent of ISC in theta-band EEG.Representation similarity analysis (Figure 2) revealed that the fMRI ISC and EEG ISC were significantly correlated in the early visual cortices in all frequency ranges. The left parietal lobe and right lateral occipital lobe show significant positive and negative representational similarity at beta and gamma bands, respectively.
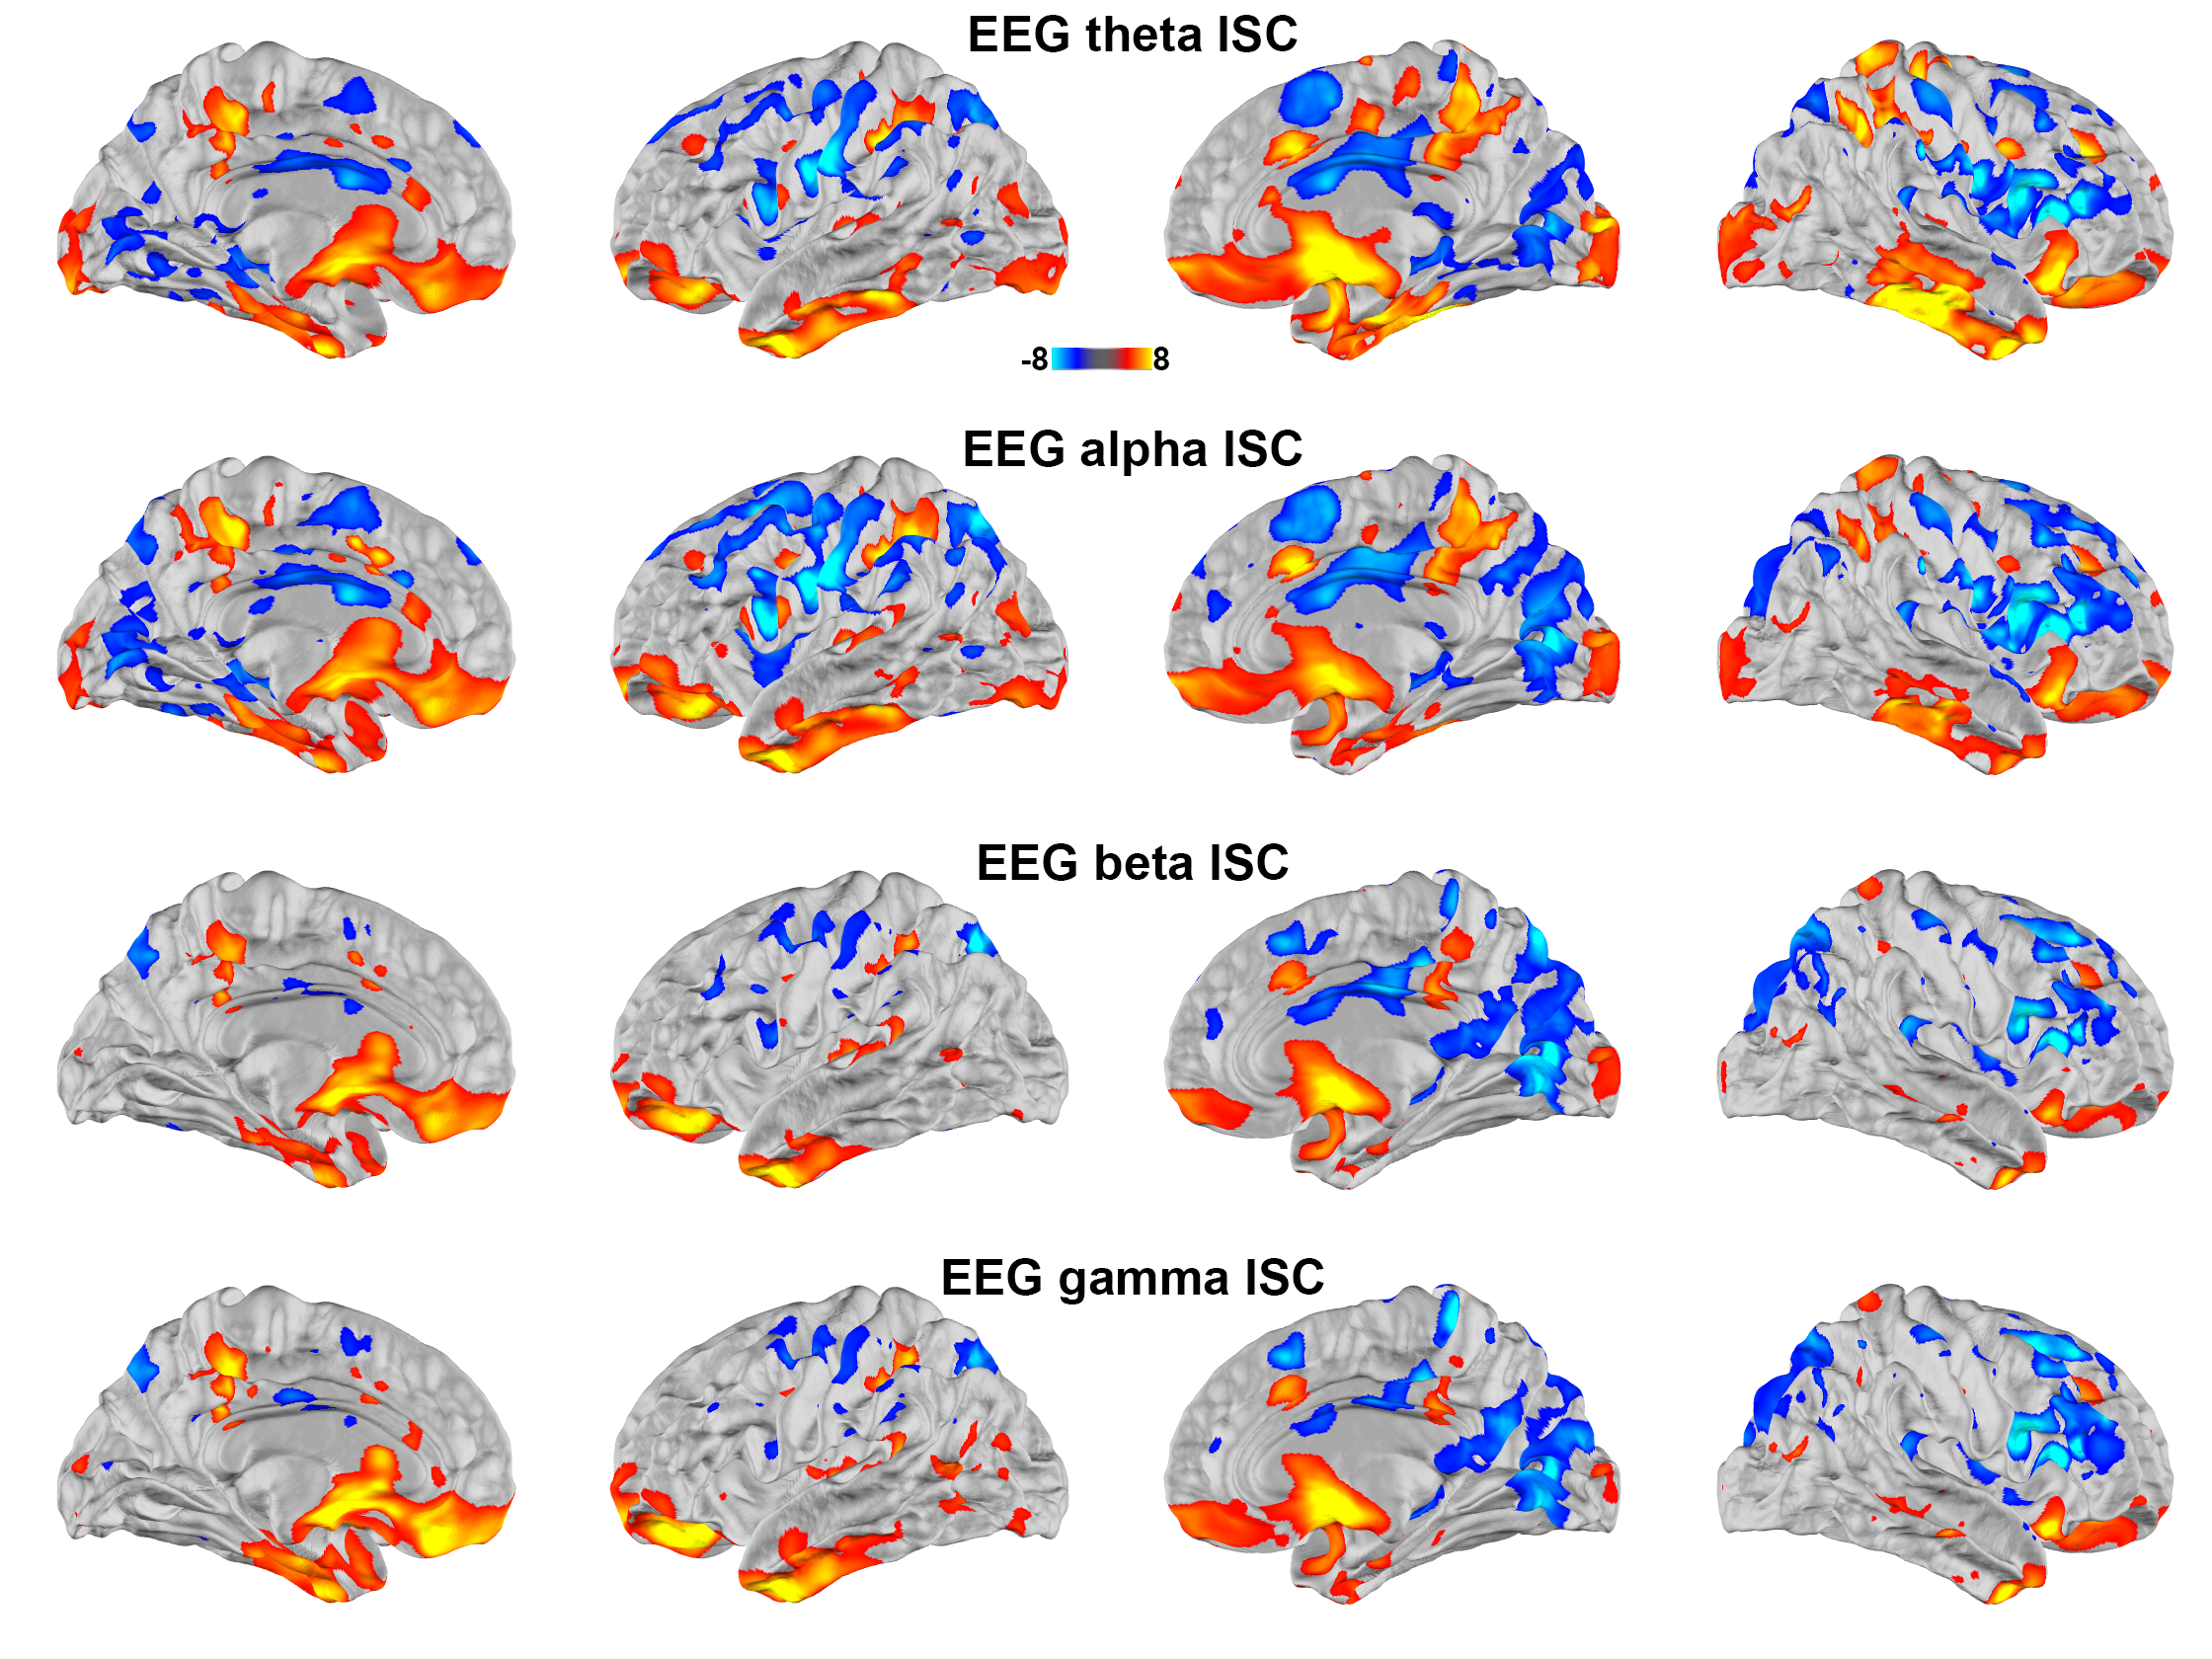
Correlating between the fMRI time series and the time series of oscillatory neuronal current estimates from EEG revealed significant positive correlations at the posterior precuneus, medial frontal lobe, temporal poles, and parietal lobes ranging between theta and gamma bands. Significant negative correlations were found at bilateral lateral prefrontal cortices in theta and alpha bands. These negative correlations extended to beta and gamma bands in the right hemisphere (Figure 3).
Discussion
Using simultaneously acquired EEG-fMRI data with EEG source modeling, we examined the correlations between neuronal and hemodynamic activity during the processing of complex naturalistic stimuli. The discrepancy between fMRI and EEG ISC (Figure 1) is likely attributed to the EEG sensitivity bias toward superficial cortical locations. Previous studies show that neuronal oscillations at alpha-beta and theta-gamma bands are related to feedback and feedforward connections 27,28, respectively. Functional MRI signals were positively and negatively correlated to neuronal oscillations at beta-gamma and alpha bands 29. Combinations of these factors are likely attributed to the ISC (Figure 2) and time series (Figure 3) correlations between EEG and fMRI, respectively. In summary, a method of elucidating neurovascular coupling of the whole cerebral cortex under complex and naturalistic stimuli was proposed for various cognitive neuroimaging studies.Acknowledgements
This work was supported by Natural Sciences and Engineering Research Council of Canada (NSERC; RGPIN-2020-05927), Canada Foundation for Innovation (38913 and 41351), Canadian Institutes of Health Research (PJT 178345), MITACS (IT25405 and Global link fellowship).References
1 Mechler, F. et al. J. Neurosci. 18, 6583–6598 (1998)
2 Yao, H. et al. Nat. Neurosci. 10, 772–778 (2007)
3 Belitski, A. et al. J. Neurosci. 28, 5696–5709 (2008)
4 Hasson, U. et al. Trends Cogn. Sci. 14, 40–48 (2010)
5 Regev, M. et al. J. Neurosci. 33, 15978–15988 (2013)
6 Wilson, S. M. et al. Cereb. Cortex 18, 230–242 (2008)
7 Jaaskelainen, I. P. et al. Open Neuroimag. J. 2, 14–19 (2008)
8 Hasson, U. et al. J. Neurosci. 28, 2539–2550 (2008)
9 Hasson, U. et al. Science 303, 1634–1640 (2004)
10 Logothetis, N. K. et al. Nature 412, 150–157 (2001)
11 Obeid, I. et al. Front. Neurosci. 10, 196 (2016)
12 Van Essen, D. C. et al. Neuroimage 80, 62–79 (2013)
13 Niso, G. et al. Neuroimage 124, 1182–1187 (2016)
14 Ives, J. R. et al. Electroencephalogr. Clin. Neurophysiol. 87, 417–420 (1993)
15 Krakow, K. et al. Brain 122 ( Pt 9), 1679–1688 (1999)
16 Seeck, M. et al. Electroencephalogr. Clin. Neurophysiol. 106, 508–512 (1998)
17 Gotman, J. et al. J. Clin. Neurophysiol. 21, 229–240 (2004)
18 Ullsperger, M. et al. (Oxford University Press, 2010)
19 Debener, S. et al. Trends Cogn. Sci. 10, 558–563 (2006)
20 Lee, H.-J. et al. Neuroimage 217, 116910 (2020)
21 Mullinger, K. J. et al. J. Vis. Exp. (2013)
22 Niazy, R. K. et al. Neuroimage 28, 720–737 (2005)
23 Hsu, Y.-C. et al. Sci. Rep. 7, 17019 (2017)
24 Allen, P. J. et al. Neuroimage 12, 230–239 (2000)
25 Pan, J. et al. IEEE Trans. Biomed. Eng. 32, 230–236 (1985)
26 Lee, H.-J. et al. Hum. Brain Mapp. (2022)
27 Bastos, A. M. et al. Neuron 85, 390–401 (2015)
28 van Kerkoerle, T. et al. Proc. Natl. Acad. Sci. U. S. A. 111, 14332–14341 (2014)
29 Scheeringa, R. et al. Proc. Natl. Acad. Sci. U. S. A. 113, 6761–6766 (2016)
Figures