3842
Whole-brain, gray and white matter time-locked functional signal changes with simple tasks and model-free analysis1Vanderbilt University Medical Center, Nashville, TN, United States, 2Sherbrooke University, Sherbrooke, QC, Canada, 3Vanderbilt University, Nashville, TN, United States
Synopsis
Keywords: fMRI, White Matter
Recent studies have revealed that blood oxygenation-level dependent (BOLD) signal changes correlate with task timings throughout a majority of the cortex, challenging the idea of sparse and localized brain functions, and highlighting the pervasiveness of potential false negative fMRI findings. However, these studies have focused on gray matter only. We extend the analysis to white matter and find widespread BOLD signal changes in both white and gray matter, challenging the idea of sparse functional localization, but also the prevailing wisdom of treating white matter BOLD signals as artefacts to be removed.Introduction
Recent studies have shown strong evidence for “whole-brain, time-locked activation” of the blood oxygenation-level dependent (BOLD) signal that can be revealed through signal averaging and model-free analysis [1]. These studies demonstrate that sparse activations observed in traditional fMRI maps may result from elevated noise or overly strict assumptions of BOLD response function [1-3]. However, “whole-brain” in this context refers to only the gray matter of the brain, whereas white matter BOLD signals are rarely reported despite a growing body of evidence that demonstrate successful detection of white matter BOLD signal [4, 5]. By analogy to the gray matter, it is unknown whether a time-locked variation of BOLD signals exists in white matter pathways, and whether such changes in BOLD signals vary based on stimuli. We hypothesize the production of widespread white matter BOLD signal changes, even in pathways that are not typically associated with a given task. To evaluate this, we averaged multiple trials of sustained stimuli to generate data with high signal-to-noise ratio, and use model-free analysis to assess signal changes in both gray matter regions and white matter pathways.Methods
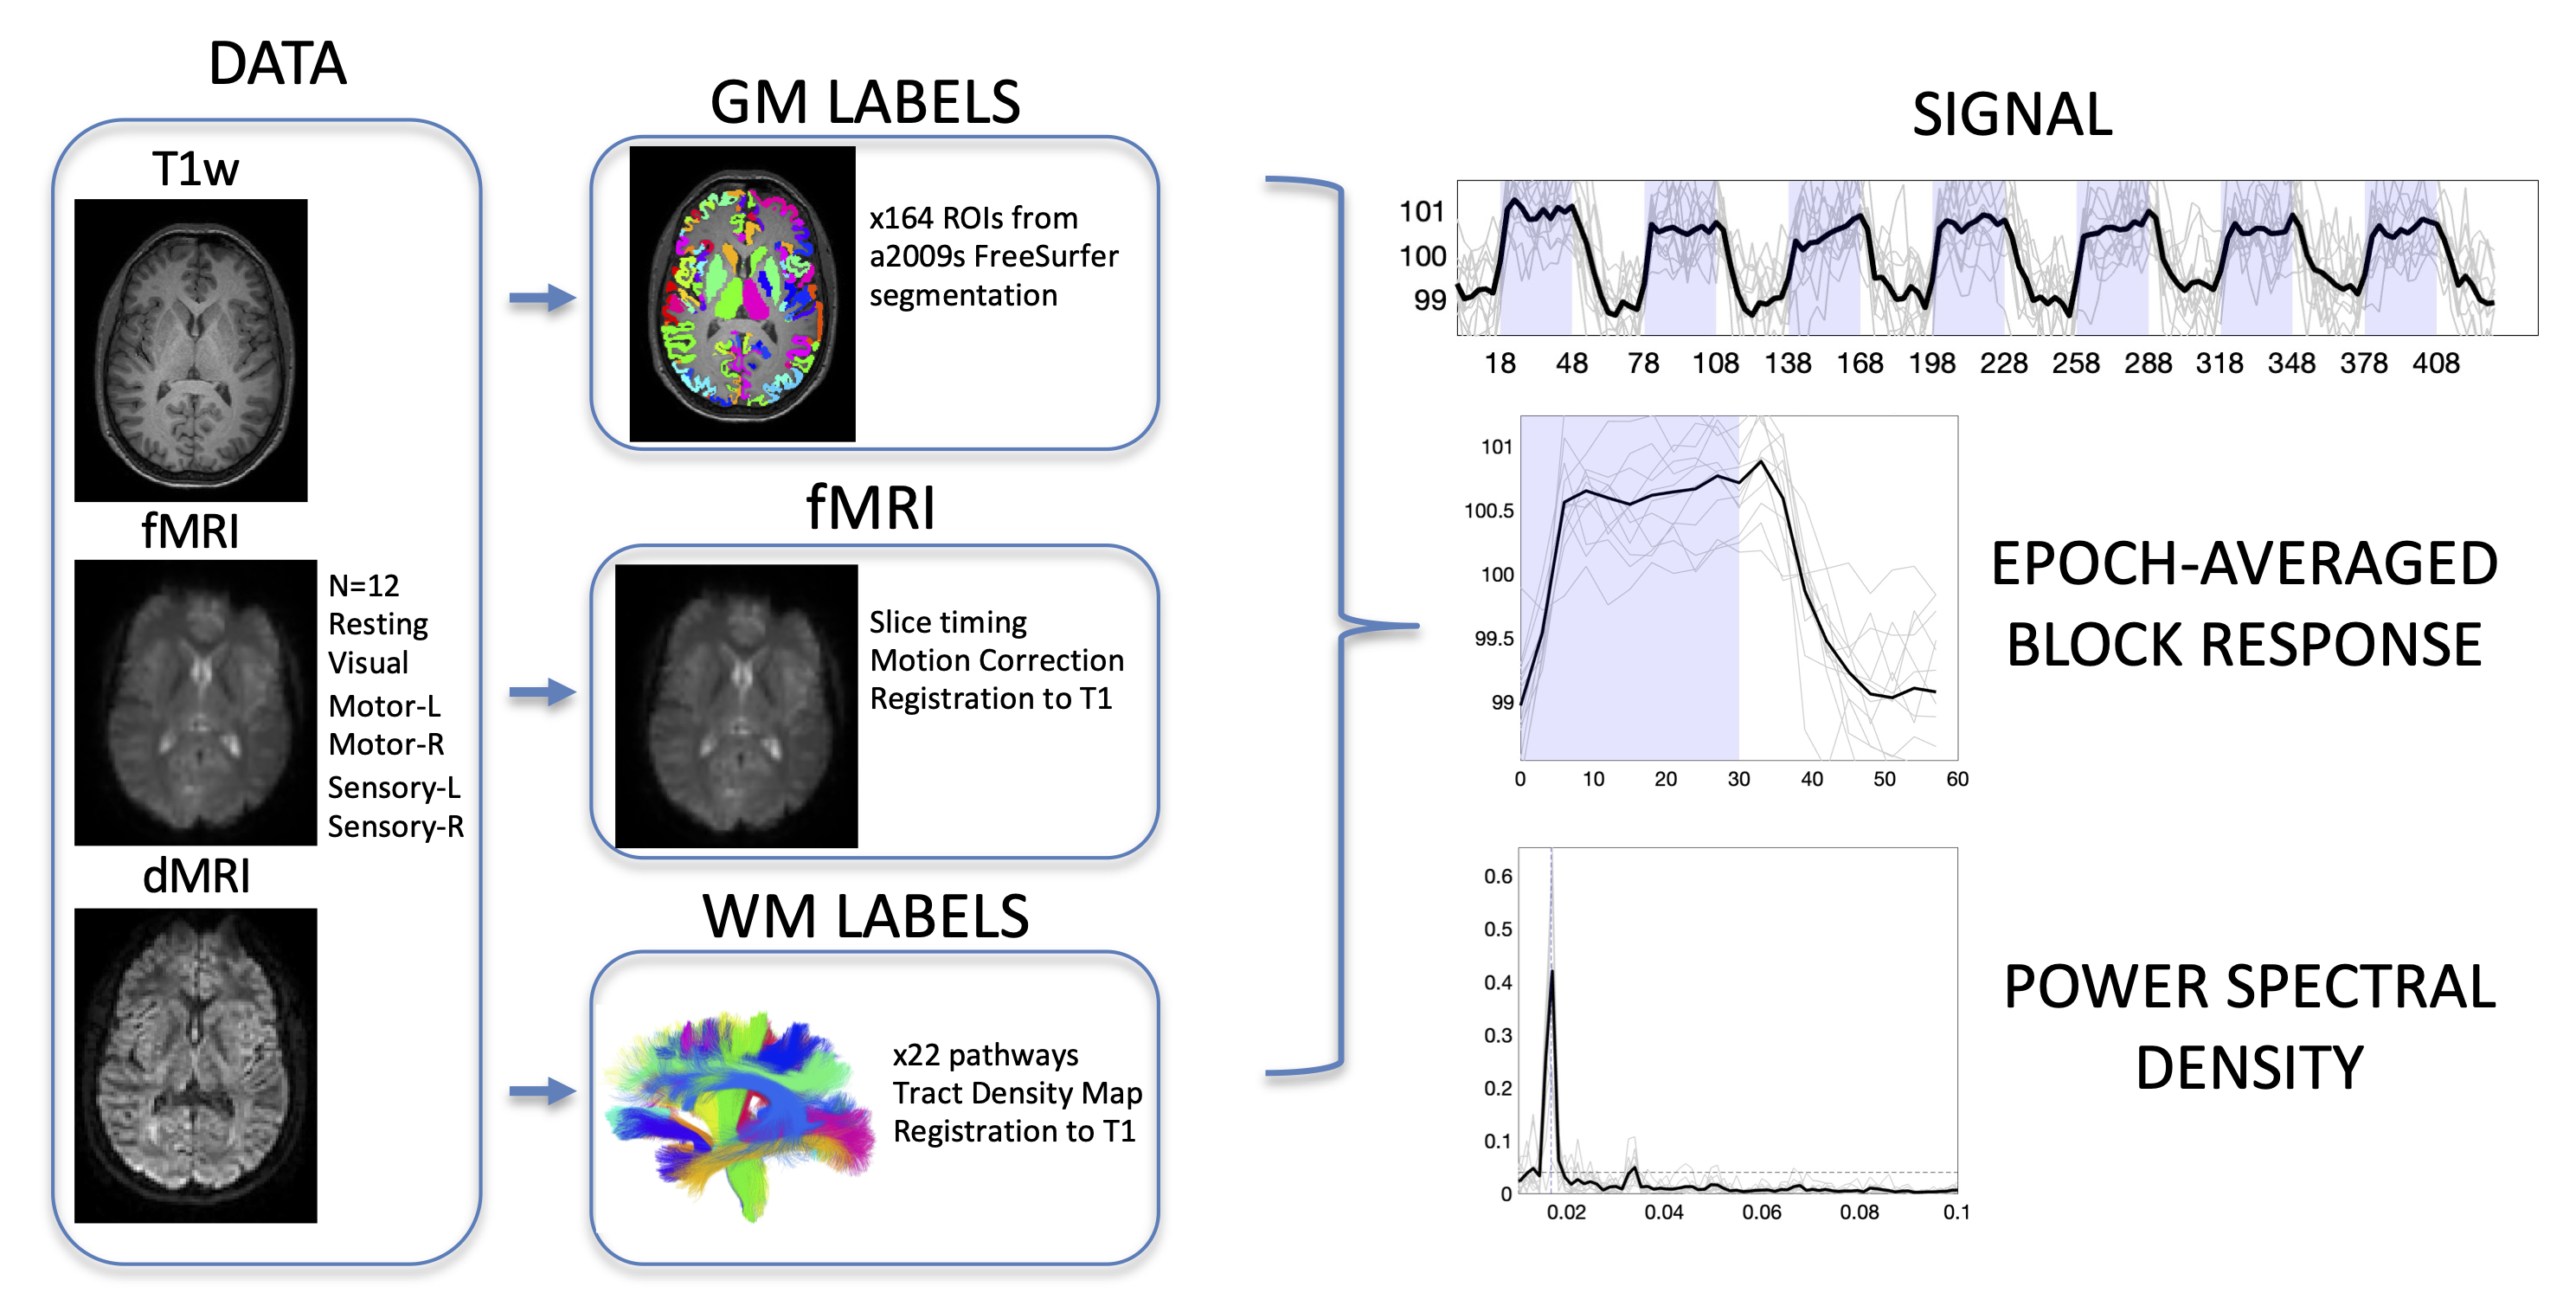
Image acquisitionImaging (Figure 1, DATA) was performed on a 3-T Philips Achieva CRX scanner at Vanderbilt University and included a T1-weighted image, and diffusion MRI sequence. Six sets of BOLD contrast were acquired (TR= 3s, TE=45ms, SENSE=2, 80×80, 240×240 mm2, 43 slices, 3 mm, 145 volumes) including a resting state acquisition (Resting), sensory stimulations to the right/left hand (Sensory-R/Sensory-L), motor tasks by the right/left hand (Motor-R/Motor-L), and visual stimulations (Visual). All six runs had the same time duration of 435 s. All stimulations and tasks were prescribed in a block design format, 30s ON and 30s OFF, with blocks repeated seven times for each functional acquisition. Each BOLD contrast was acquired on N=12 volunteers.
Image preprocessing
The preprocessing (Figure 1, fMRI) performed corrections only for slice timing and head motions (SPM12), with no subjects indicating large head motion. Importantly, no spatial smoothing was applied to any fMRI data so as to minimize partial volume effects.
Region of Interest delineation
Labels (Figure 1, LABELS) for gray matter were extracted from the T1-weighted image using Freesurfer [6]. Labels for twenty-two white matter pathways were extracted from diffusion images using TractSeg [7]. All labels, and all BOLD data, were transformed to the structural image space. At this point, white and gray matter labels, and fMRI signal are all aligned within the same space.
Time-locked activation
Our aim was to determine which regions indicated time-locked activation with the stimulus/task across a population. We extracted the averaged fMRI signal within each white and gray matter region (Figure 1, SIGNAL). The power spectral density was estimated via the periodogram method which represented the distribution of power per unit frequency (Figure 1, POWER SPECTRAL DENSITY), with frequency of interest at 0.0167Hz (1/60s). Significant time locked activation (i.e., statistically significant power at this frequency), was determined via bootstrap analysis of resting state data to generate our null distribution of power. Given the real data (i.e., the subject averaged power spectral density in a region of interest), we generated a p-value for statistically significant time-locked activation. Regions with p<0.01 after false discovery rate correction are considered time-locked by our tasks, and the epoch-averaged response function (Figure 1, EPOCH-AVERAGED BLOCK RESPONSE) can be visualized.
Results
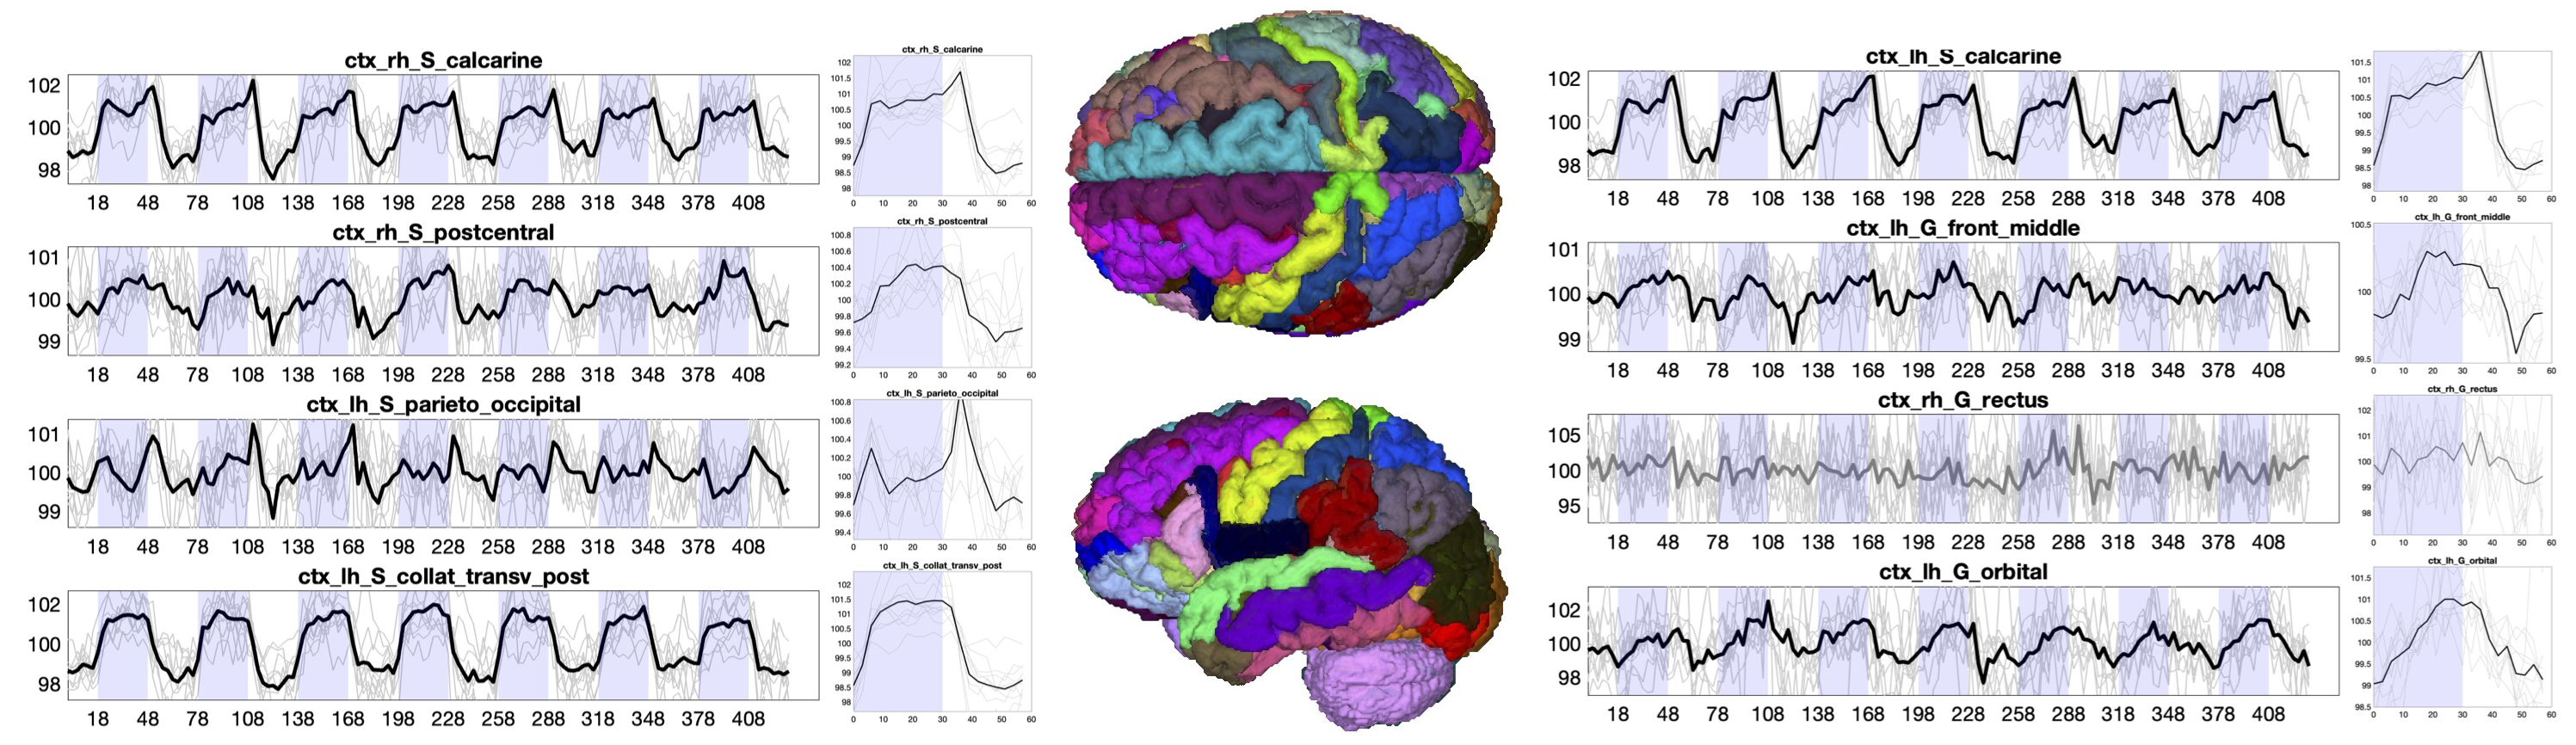
Widespread Gray Matter Time-locked ActivationFigure 2 shows the subject-averaged signal and epoch-averaged responses for several selected gray matter regions for the visual task. As in [1], many regions show significant, time-locked activation with the task.
Widespread White Matter Time-locked Signal Changes
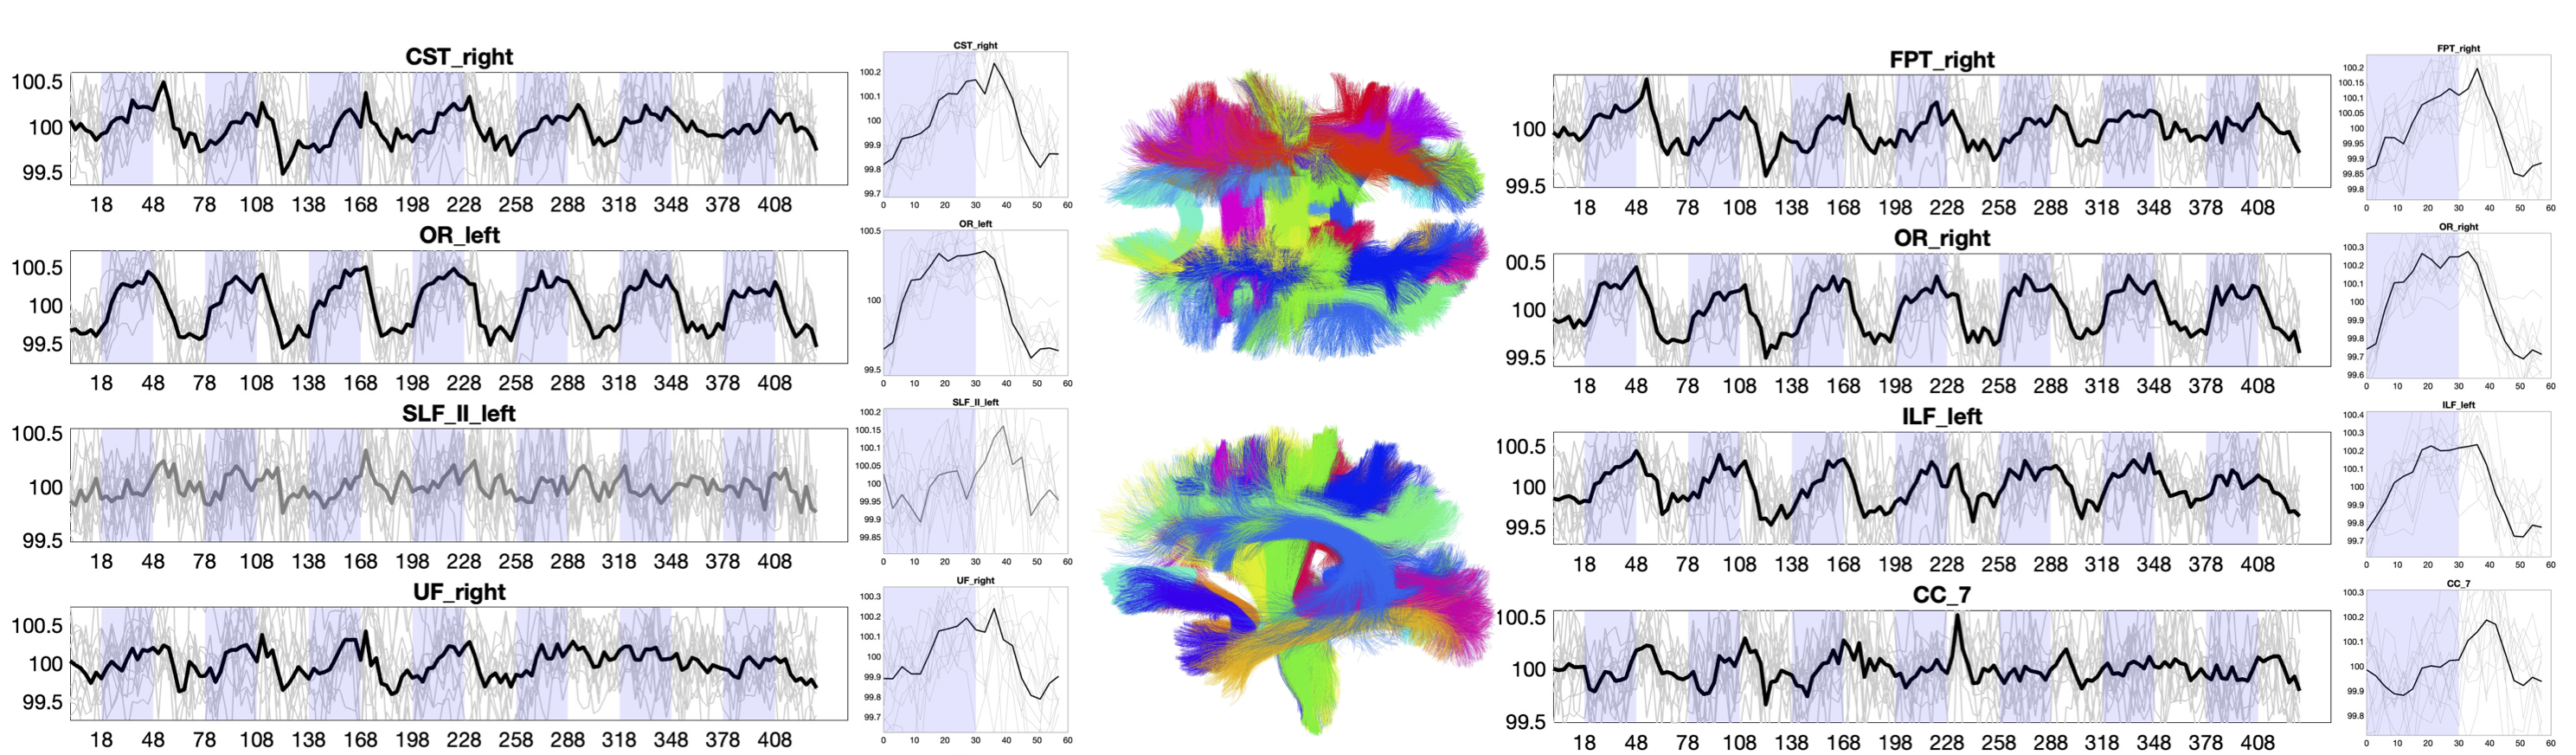
Figure 3 shows white matter signals for several pathways. White matter also shows widespread time-locked signal changes, with variation in response shape and timings.
Variation in tasks
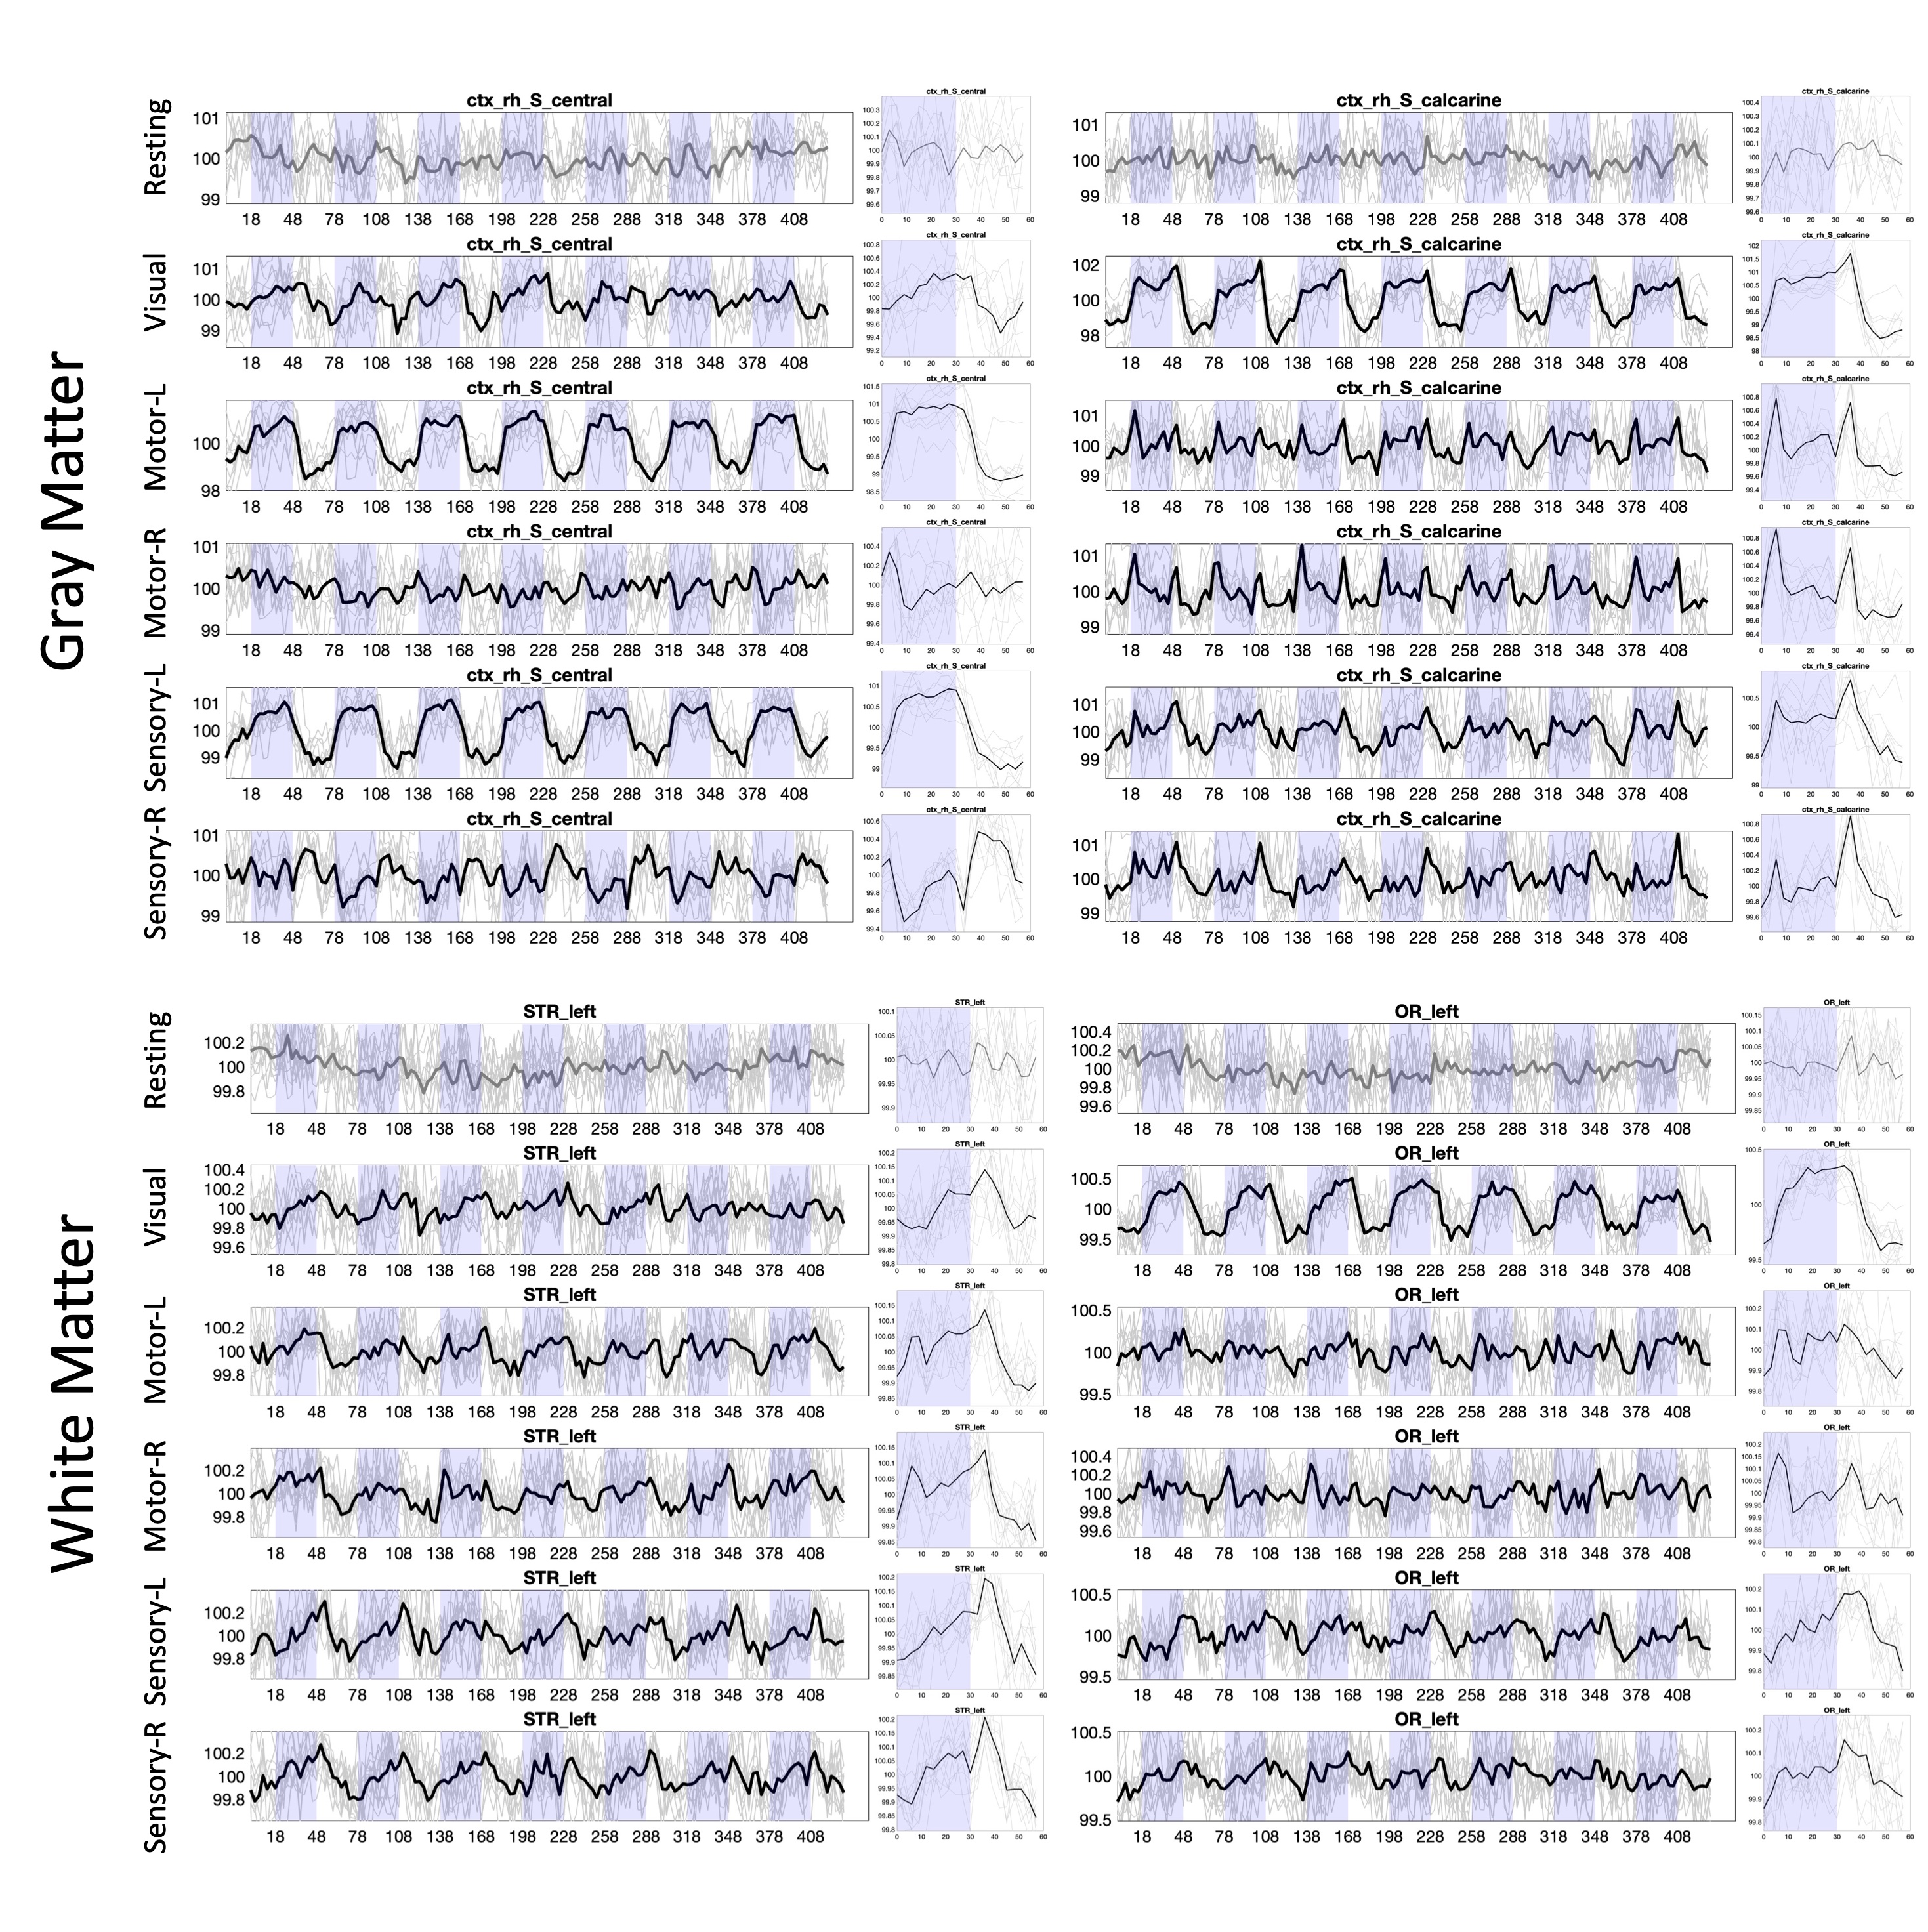
Figure 4 shows the signal for two selected gray matter and two selected white matter regions across all BOLD contrasts/tasks, including resting state. All tasks show significant activation, with varied signal responses based on task.
Discussion
Using simple tasks and model-free analysis, we show here that task-locked BOLD signal changes may be evoked across the whole brain, in both white and gray matter. While BOLD signal in white matter remains controversial, we find detectable signal fluctuations in a large number of projection, commissural, and association pathways. White matter activation of a pathway is not specific to a single task, shows variation in shape and timing of response functions, and occurs concurrently with widespread activity in the gray matter as has been previously reported [1, 8].Acknowledgements
This work was supported by the National Science Foundation Career Award #1452485, the National Institutes of Health under award numbers R01EB017230, K01EB032898, and in part by ViSE/VICTR VR3029 and the National Center for Research Resources, Grant UL1 RR024975–01.References
1. Gonzalez-Castillo, J., et al., Whole-brain, time-locked activation with simple tasks revealed using massive averaging and model-free analysis. Proc Natl Acad Sci U S A, 2012. 109(14): p. 5487-92.
2. Calhoun, V.D., et al., fMRI analysis with the general linear model: removal of latency-induced amplitude bias by incorporation of hemodynamic derivative terms. Neuroimage, 2004. 22(1): p. 252-7.
3. Taylor, A.J., J.H. Kim, and D. Ress, Characterization of the hemodynamic response function across the majority of human cerebral cortex. Neuroimage, 2018. 173: p. 322-331.
4. Gawryluk, J.R., E.L. Mazerolle, and R.C. D'Arcy, Does functional MRI detect activation in white matter? A review of emerging evidence, issues, and future directions. Front Neurosci, 2014. 8: p. 239.
5. Gore, J.C., et al., Functional MRI and resting state connectivity in white matter - a mini-review. Magn Reson Imaging, 2019. 63: p. 1-11.
6. Fischl, B., FreeSurfer. Neuroimage, 2012. 62(2): p. 774-81.
7. Wasserthal, J., P. Neher, and K.H. Maier-Hein, TractSeg - Fast and accurate white matter tract segmentation. Neuroimage, 2018. 183: p. 239-253.
8. Handwerker, D.A., et al., The continuing challenge of understanding and modeling hemodynamic variation in fMRI. Neuroimage, 2012. 62(2): p. 1017-23.
Figures