3841
Evaluation of neuronal feed-forward control of cerebral blood flow in negative BOLD response1Max Planck Institute for Human Cognitive and Brain Sciences, Leipzig, Germany
Synopsis
Keywords: fMRI (task based), Arterial spin labelling
The application of a simplistic model of neuronal control of changes in cerebral blood flow and oxygen metabolism to experimental data in regions of the positive and negative BOLD response, suggested differences in neuronal contributions and inhibitory control of changes in cerebral blood flow between the two regions.Introduction
With a growing consensus on the neuronal basis1–3 of the negative BOLD response (NBR) , there has been an interest in understanding the differences in its neuronal contributions and neurovascular coupling3,4 in relation to the positive BOLD response (PBR). At the macroscopic level of fMRI, such investigations are rather limited and we have to rely on biophysical models5,6 to gain insights into underlying physiology. The recently proposed7 neuronal population dynamics-based Wilson Cowan model8 for feed-forward control of cerebral blood flow (CBF) and cerebral metabolic rate of oxygen consumption (CMRO2) changes is one such tool. It relates excitatory and inhibitory activities to their control of ΔCBF and ΔCMRO2 during functional activation. The model was adapted here to accommodate functional deactivation. To allow for comparisons with PBR, the original model was replicated as well for our multi-subject normocapnic study.Methods
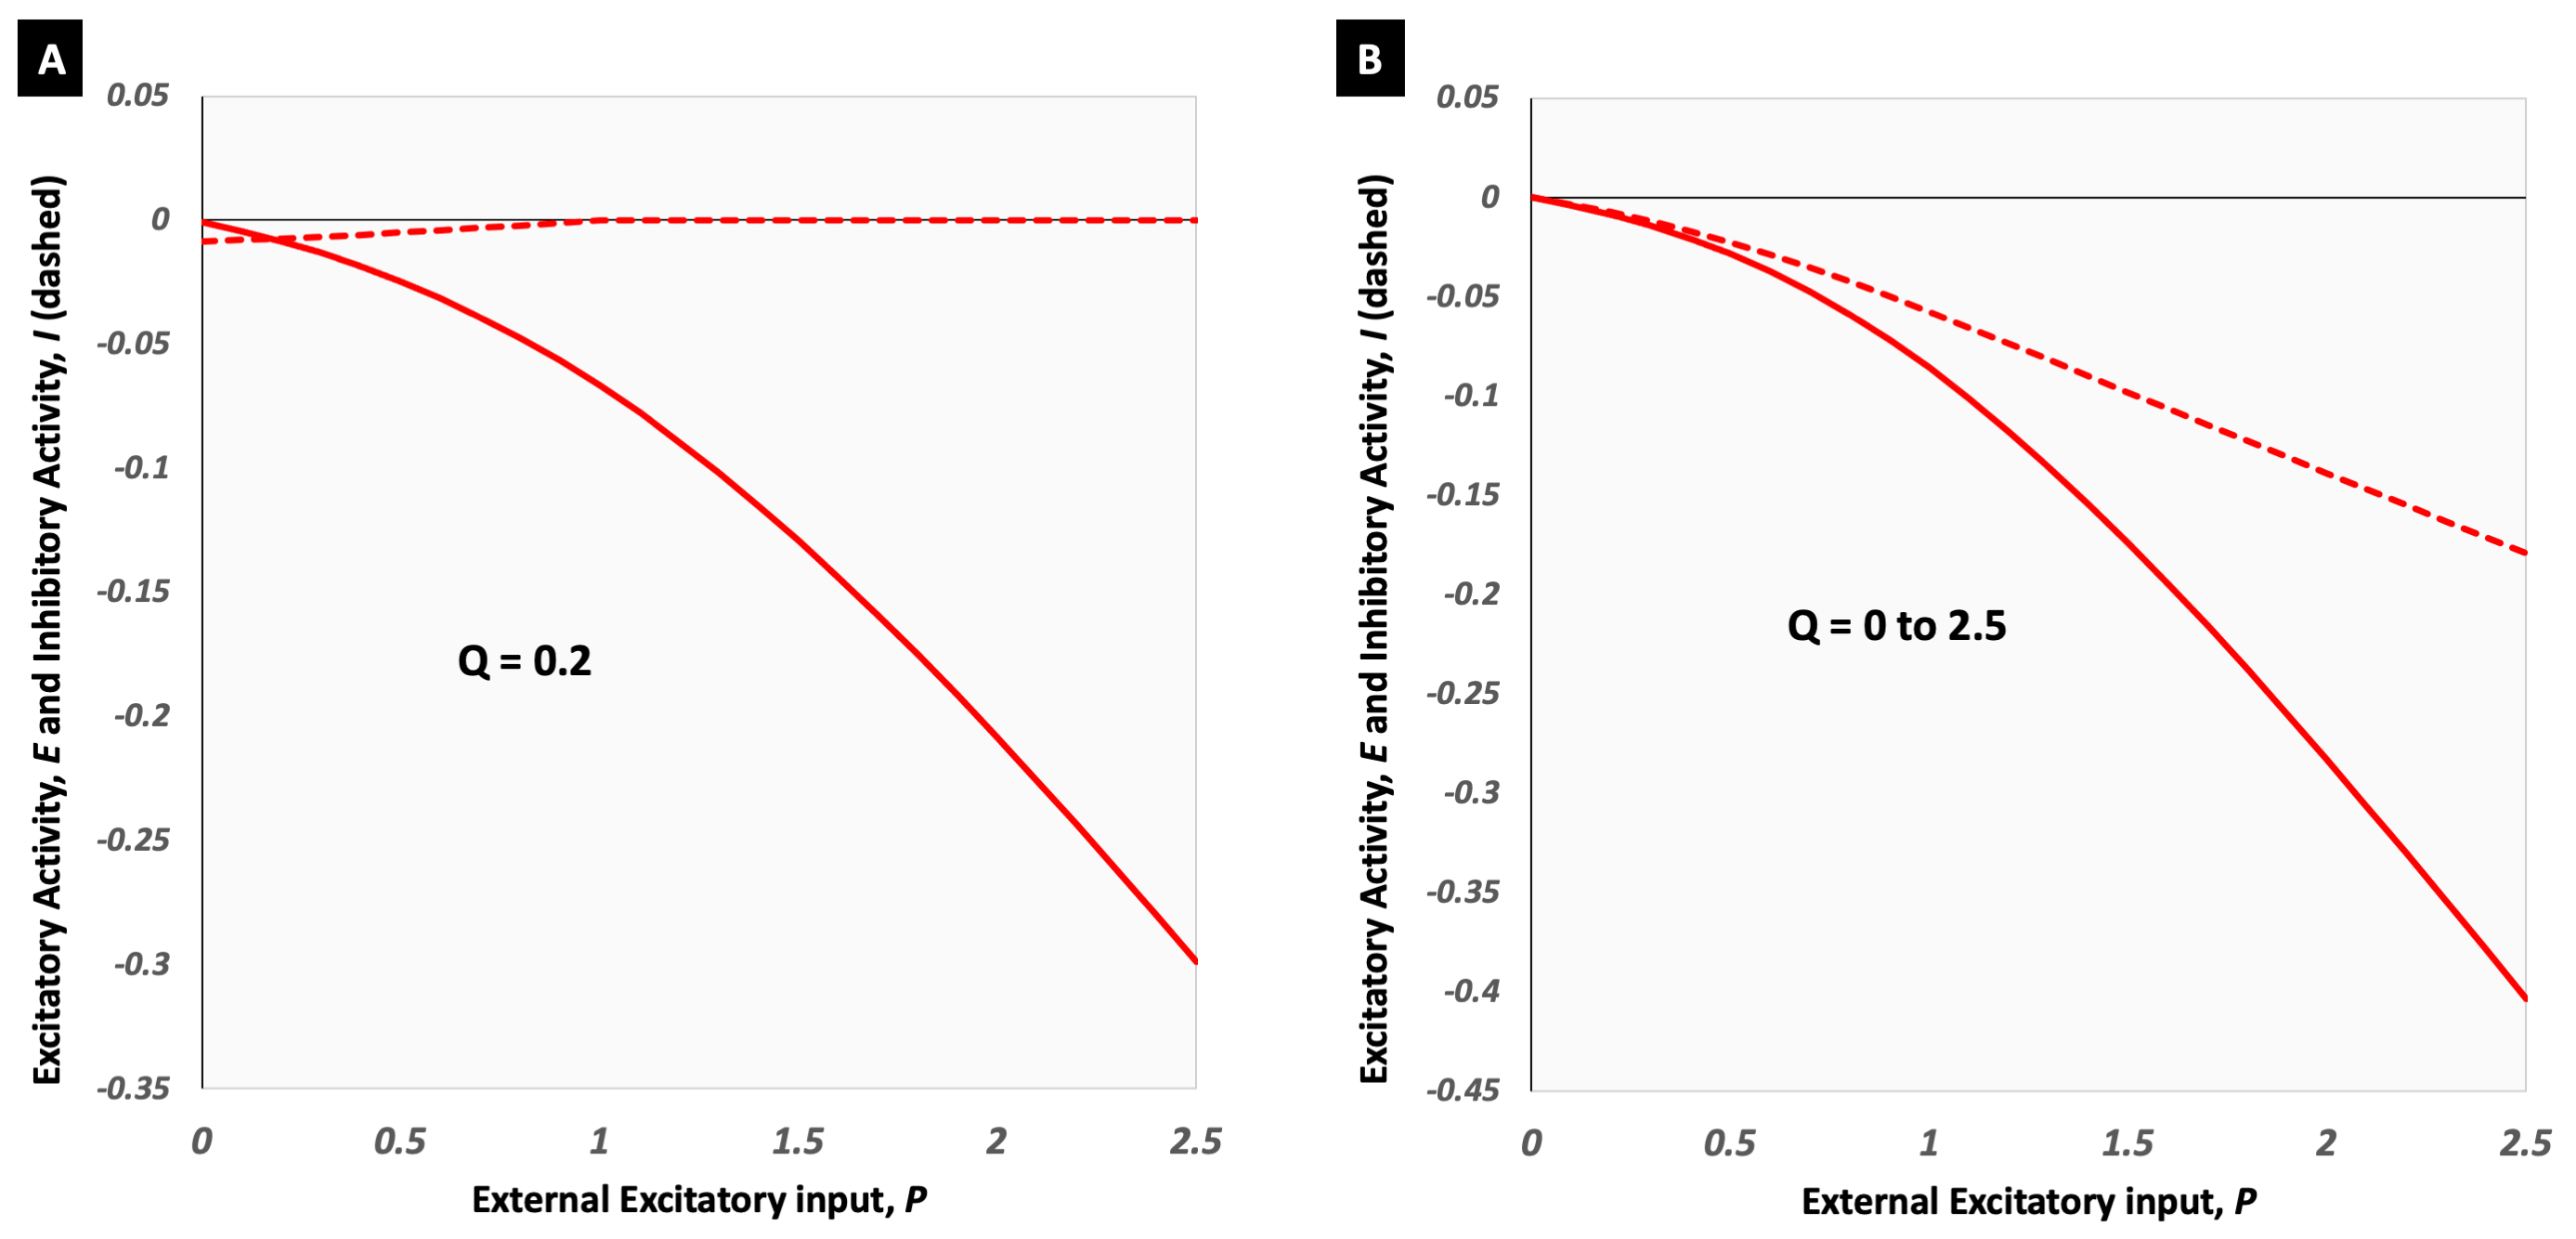
Positive and negative BOLD and corresponding changes in CBF, in response to visual stimulation4, were simultaneously acquired in 18 subjects at 3T using an optimized9 pCASL10-prepared Multi-Echo DEPICTING11 with TE1/TE2/TE3=1.7ms/10.7ms/19.7ms, TR=3500-3552 ms and GRAPPA factor 2. The responses were recorded in 10-12 slices (nominal resolution 3 × 3 × 4 mm3, 0-0.8mm slice gap, FOV=192 mm, matrix 64 × 64, bandwidth 2230 Hz/Px) acquired along the calcarine sulcus with a labelling plane at the base of the cerebellum or 65mm caudal to the nasal root (τ=1500ms, PLD=1200ms). Relative BOLD and CBF changes (%) were extracted from regions of concomitant PBR and increase in CBF, and concomitant NBR and CBF decrease. Assuming an M value of 4%12 , α=0.313 and β=1.556, or β=1.314, relative ΔCMRO2 values in both ROIs were estimated based on the Davis model5,6. The potential feed-forward control of CBF and CMRO2 was then investigated using the recently proposed7 application of the Wilson Cowan model8. The model was replicated as described in the original paper7 to investigate neuronal control of flow and metabolism in the positive ROI. A similar assumption was made for the positive ROI, that of ΔCMRO2 driven primarily by excitatory activity, ΔCMRO2~E and ΔCBF driven by a combination of excitatory and inhibitory activity, ΔCBF ~ E + xNBRI, xNBR = 1.5. The Wilson Cowan equations were, however, modified to accommodate a negative current based on a zero-baseline condition:τ0dE/dt = -E - S(wE - wI + P),
τ0dI/dt = -I - S(wE + P),
where t is time, τ0=10ms and S(x)=[1+e-a(x-θ)]-1 - (1+eaθ)-1 is a sigmoidal transfer function of gain a and threshold θ, w the strength of the synaptic connections. P and Q the external excitatory and inhibitory inputs, respectively. The model was tested for a constant Q (similar to for positive ROI) as well as P=Q linearly increasing from 0 to 2.5. The resulting E(P=2.5) was then equated to a ΔCMRO2 of –30% and the proportionality constant applied to obtain ΔCBF|WC~E + xNBRI; xNBR=1.5.
Results
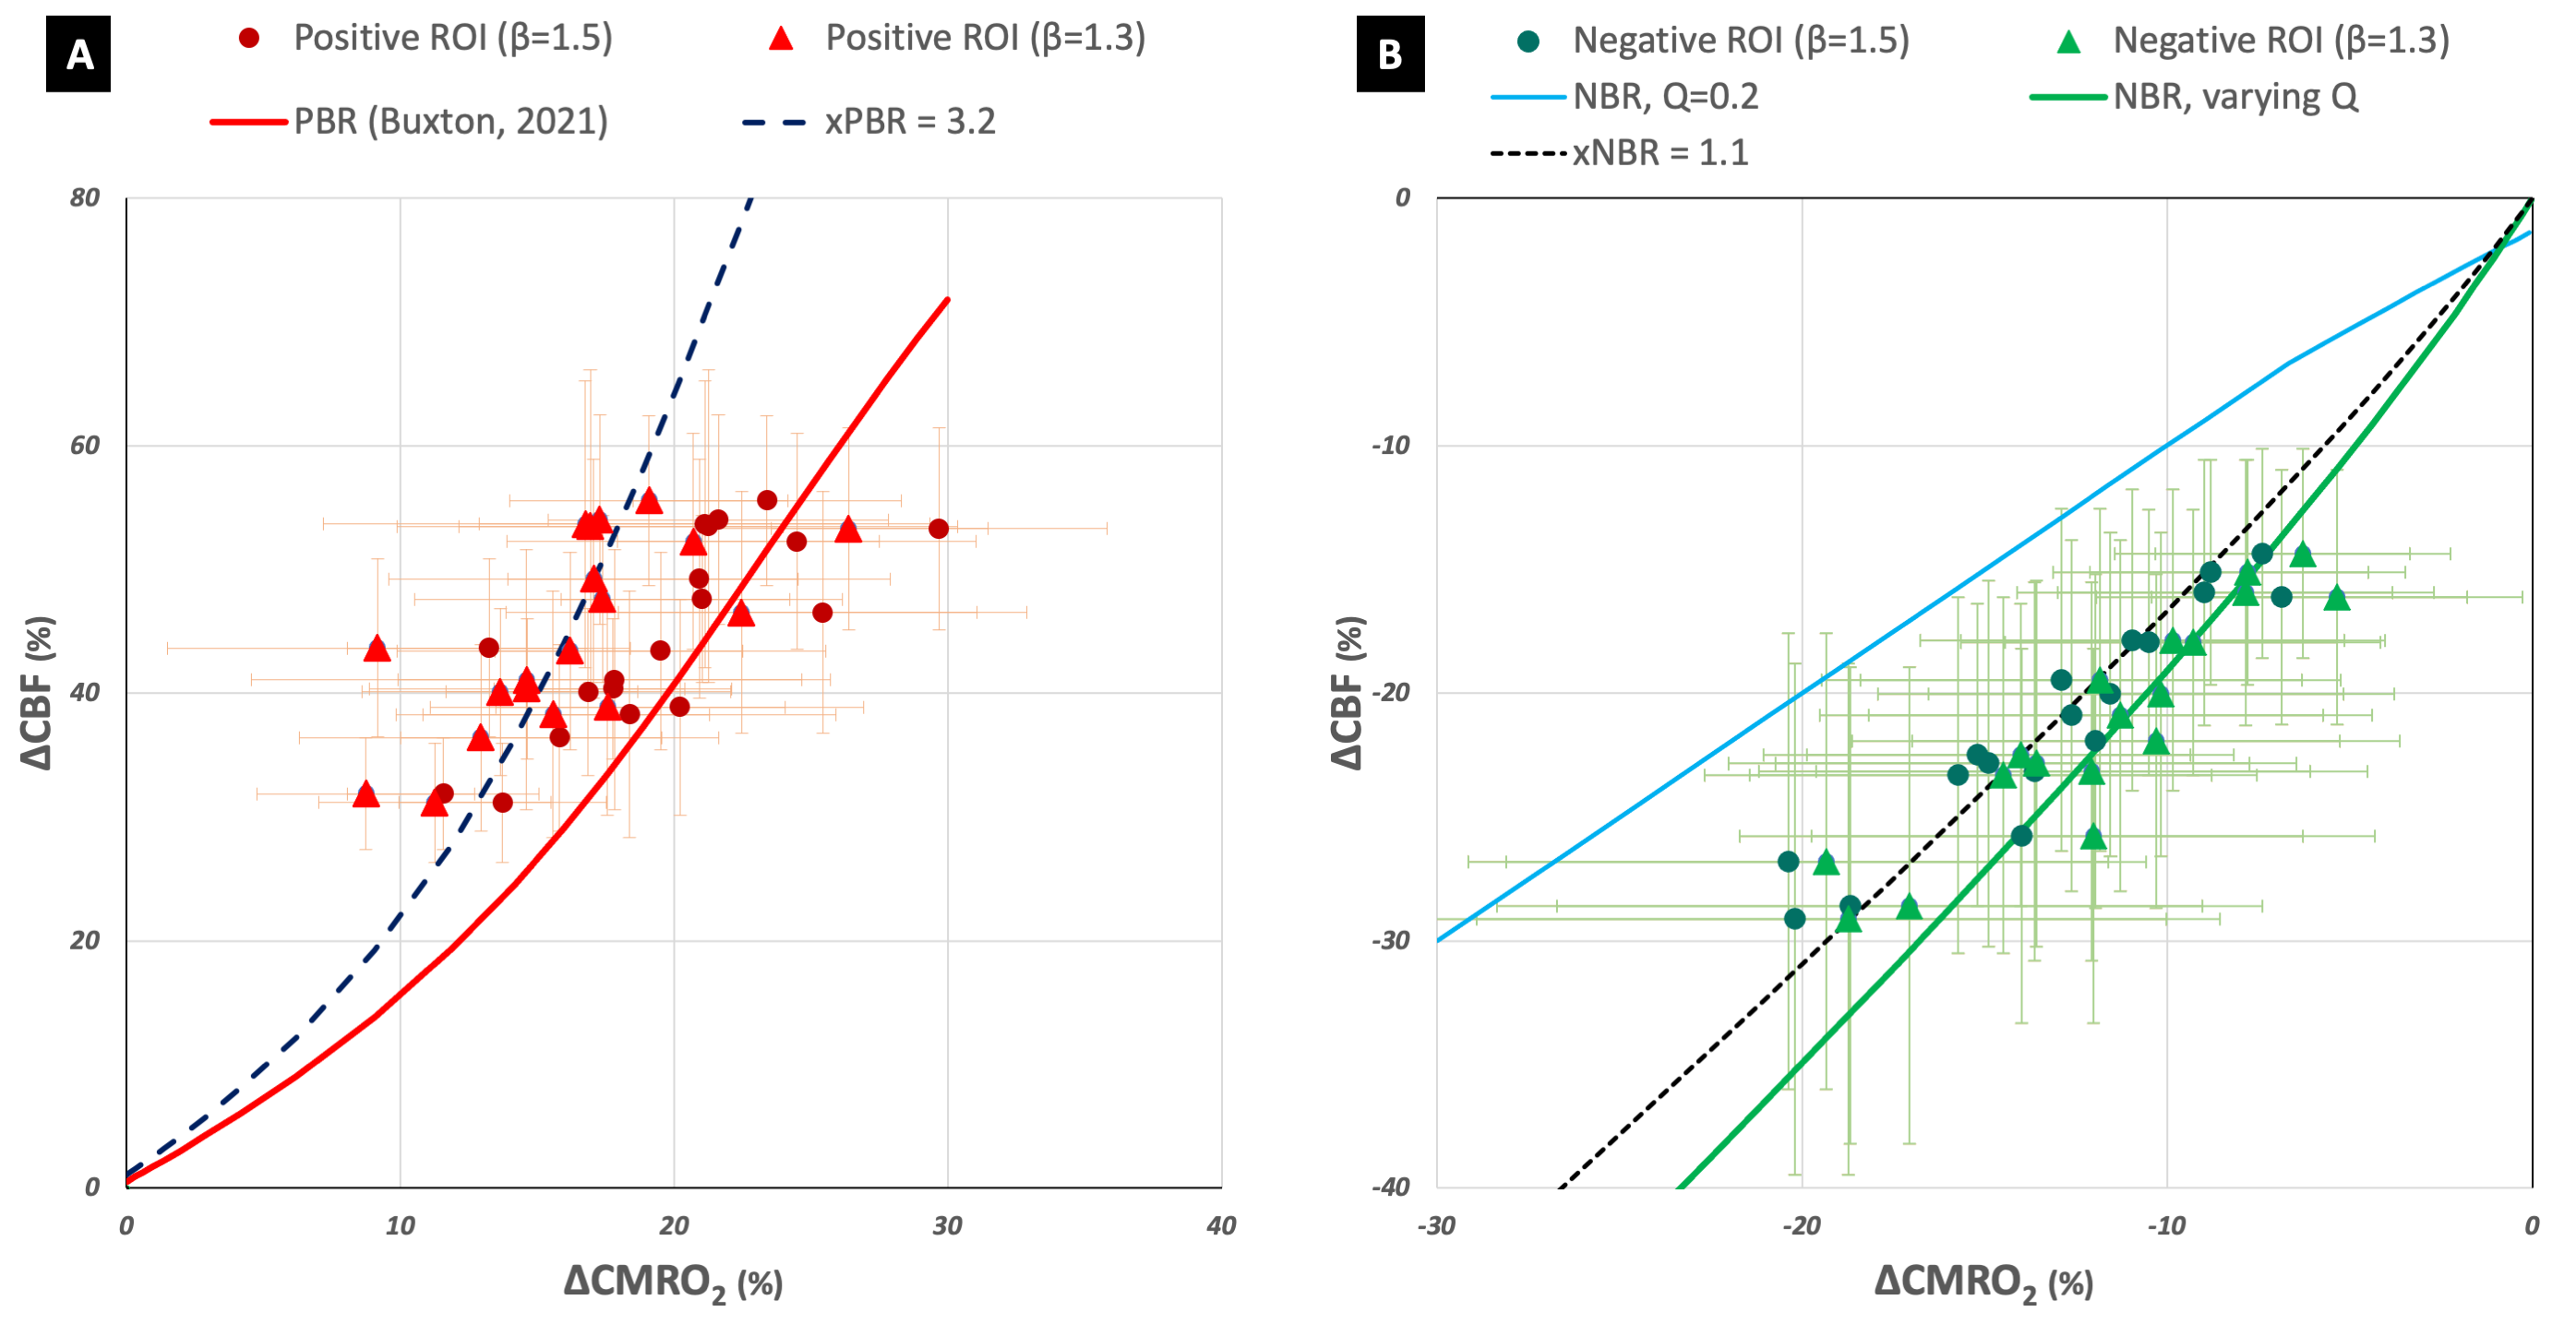
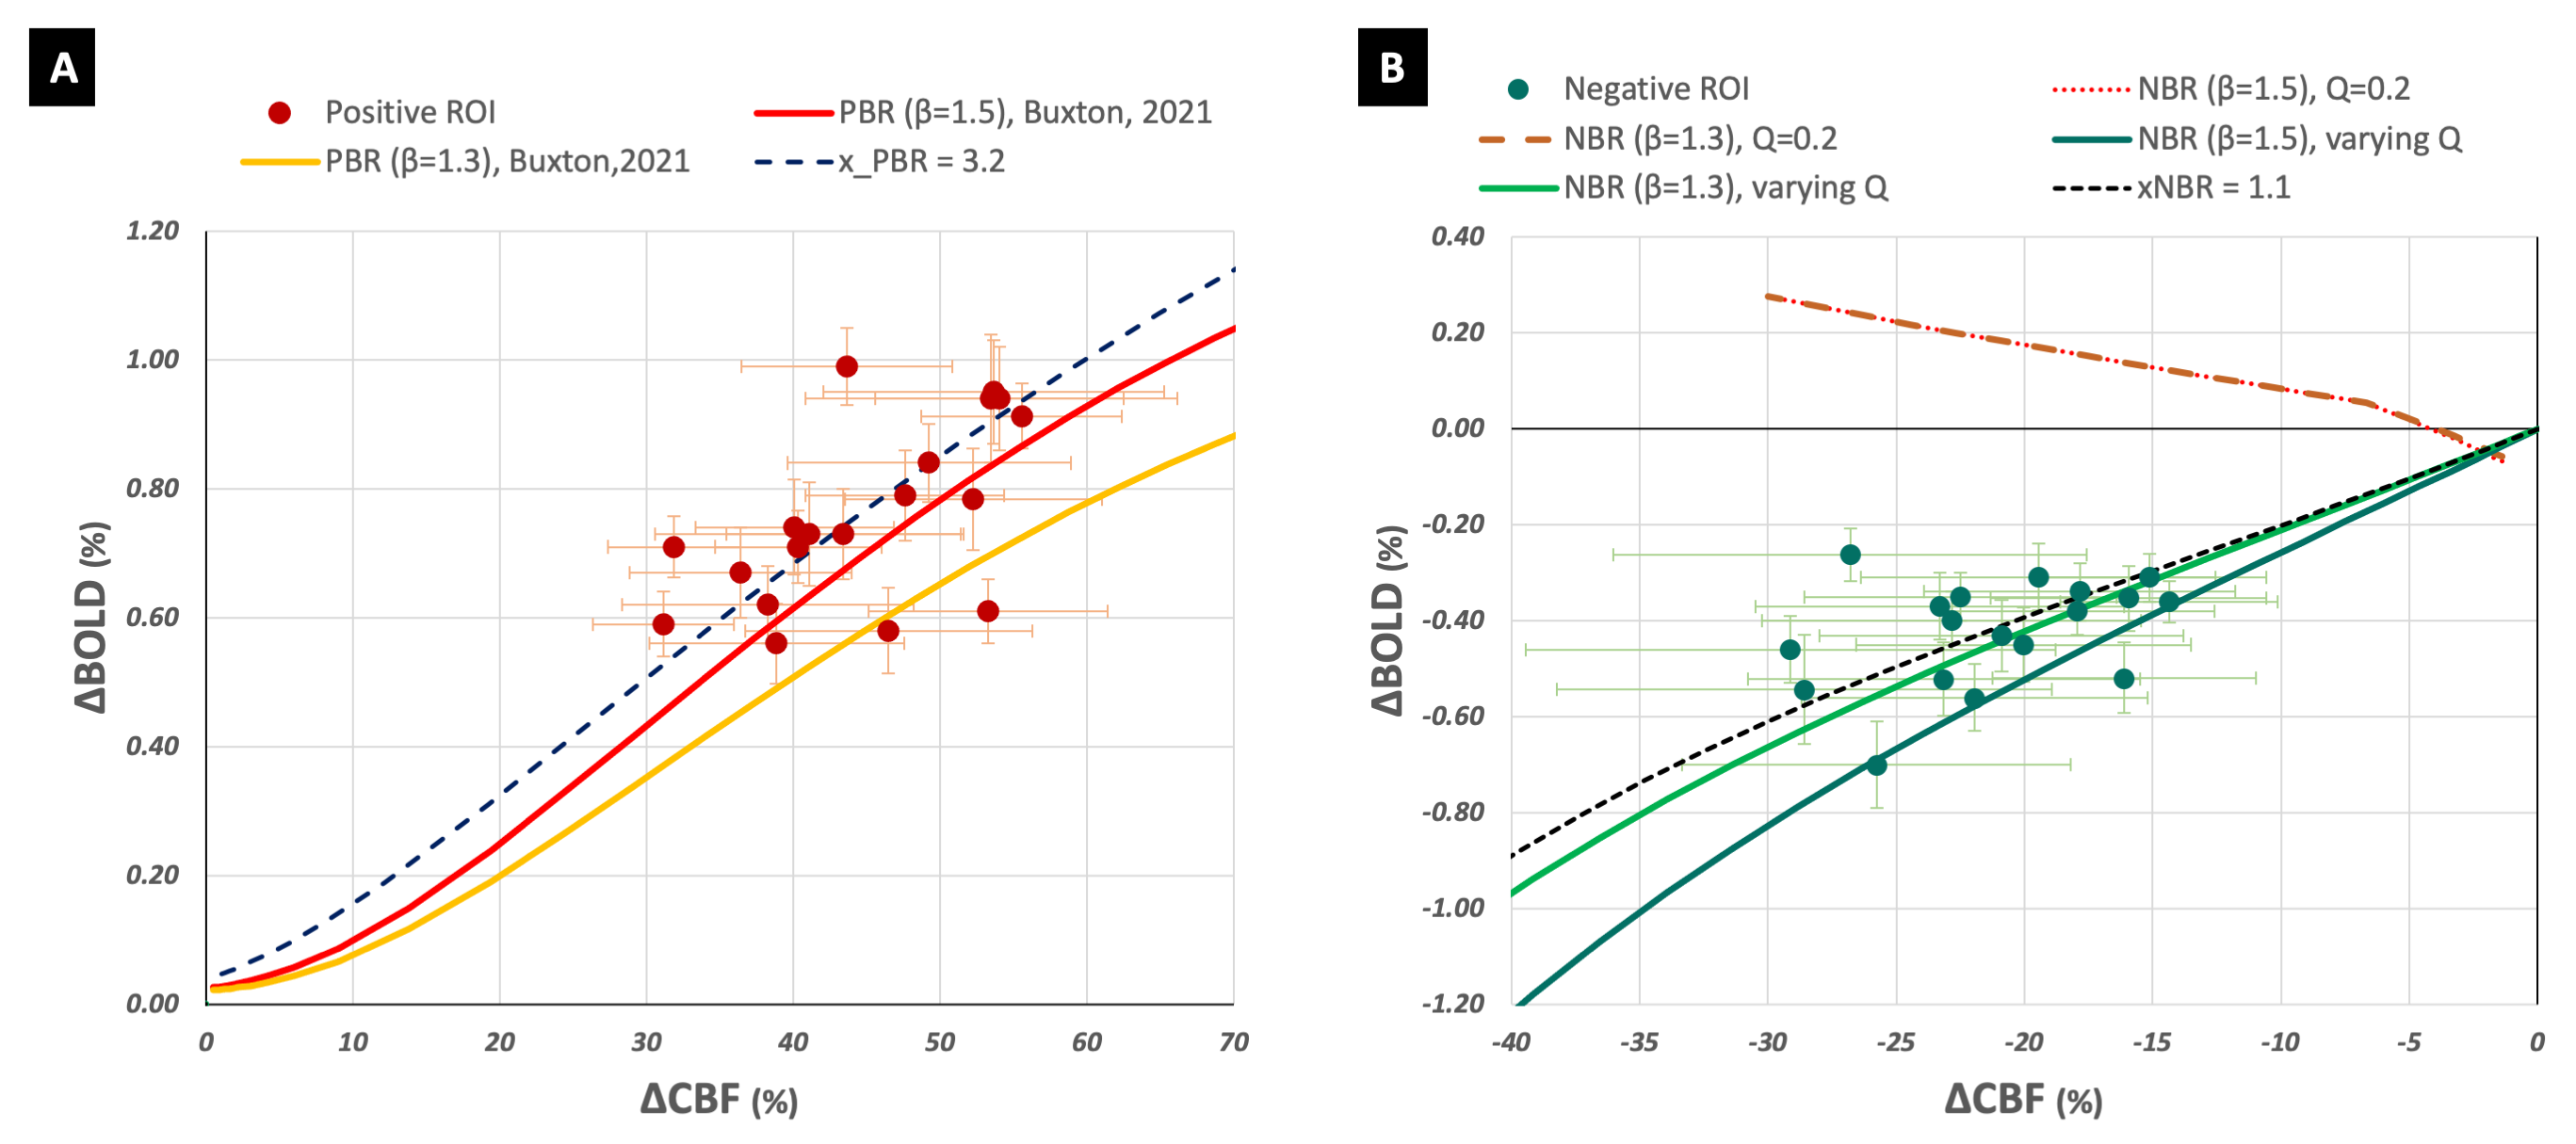
The implementation of the modified Wilson Cowan equations for deactivation is shown in Figure 1 and the corresponding derived models in Figures 2B and 3B. A constant value of Q did not serve well for NBR as it did for PBR (Figures 2A and 3A). The inhibitory activity approaching baseline with increasing external excitatory activity, translated to a model where ΔCMRO2|WC=ΔCBF|WC, which (i) did not fit the data (Fig 2B) and (ii) failed to generate an NBR (Fig 3B). A linearly varying Q, on the other hand, was found to render ΔCBF|WC/ΔCMRO2|WC and ΔBOLD|WC/ΔCBF|WC models that were good fits to experimental as well as estimated data. Interestingly, the weighting of inhibitory control of CBF decreases, xNBR = 1.5 also appeared to fit better with NBR data with β=1.3 than β=1.5. An xNBR = 1.1 was found to qualitatively fit the latter data better (black dashed line in Figure 2B and 3B). The opposite was found true for PBR wherein, the ΔCBF|WC estimated with xPBR = 1.5 fit positive data better with β=1.5 than β=1.3.Discussion
The evident failure of the modified model with a constant value of Q appears to suggest a difference in the inhibitory neuronal contribution between PBR and NBR. Different sub-populations of interneurons have been found to elicit negative hemodynamic responses in optogenetic studies15. It is, hence, probable for the NBR to be driven by their net inhibitory influence. This would be in line with the hypothesis of the presence of additional inhibitory mechanisms in the NBR that are not present in the PBR3. Different x values also appear to qualitatively fit the experimental data better than a common value for PBR and NBR, hinting at a difference in inhibitory control of CBF changes in the NBR. Additionally, the choice of the vessel-size dependent β value used for ΔCMRO2 estimation was found to have an impact on the value of the inhibitory weighting itself in both PBR and NBR. Ιt is to be noted that these are exploratory findings owing to the unavoidable model assumptions and errors in estimations/measurements. They, nevertheless, help supplement our current understanding of feed-forward neuronal control of ΔCBF and ΔCMRO2.Acknowledgements
No acknowledgement found.References
1. Shmuel, A. et al. Sustained negative BOLD, blood flow and oxygen consumption response and its coupling to the positive response in the human brain. Neuron 36, 1195–1210 (2002).
2. Shmuel, A., Augath, M., Oeltermann, A. & Logothetis, N. K. Negative functional MRI response correlates with decreases in neuronal activity in monkey visual area V1. Nat. Neurosci. 9, 569–577 (2006).
3. Mullinger, K. J., Mayhew, S. D., Bagshaw, A. P., Bowtell, R. & Francis, S. T. Evidence that the negative BOLD response is neuronal in origin: A simultaneous EEG-BOLD-CBF study in humans. Neuroimage 94, 263–274 (2014).
4. Huber, L. et al. Investigation of the neurovascular coupling in positive and negative BOLD responses in human brain at 7T. Neuroimage 97, 349–362 (2014).
5. Davis, T. L., Kwong, K. K., Weisskoff, R. M. & Rosen, B. R. Calibrated functional MRI: mapping the dynamics of oxidative metabolism. Proc. Natl. Acad. Sci. U. S. A. 95, 1834–1839 (1998).
6. Hoge, R. D. . et al. Linear Coupling between cerebral blood flow and oxygen consumption in activated human cortex. Proc. Natl. Acad. Sci. U. S. A. 96, 9403–9408 (1999). 7. Buxton, R. B. The thermodynamics of thinking: connections between neural activity, energy metabolism and blood flow. Philos. Trans. R. Soc. B Biol. Sci. 376, 20190624 (2021).
8. Wilson, H. R. & Cowan, J. D. Excitatory and Inhibitory Interactions in Localized Populations of Model Neurons. Biophys. J. 12, 1–24 (1972).
9. Lorenz, K., Mildner, T., Schlumm, T. & Möller, H. E. Characterization of pseudo-continuous arterial spin labeling: Simulations and experimental validation. Magn. Reson. Med. 79, 1638–1649 (2018).
10. Dai, W., Garcia, D., De Bazelaire, C. & Alsop, D. C. Continuous flow-driven inversion for arterial spin labeling using pulsed radio frequency and gradient fields. Magn. Reson. Med. 60, 1488–1497 (2008).
11. Hetzer, S., Mildner, T. & Möller, H. E. A Modified EPI sequence for high-resolution imaging at ultra-short echo time. Magn. Reson. Med. 65, 165–175 (2011).
12. Whittaker, J. R., Driver, I. D., Bright, M. G. & Murphy, K. The absolute CBF response to activation is preserved during elevated perfusion: Implications for neurovascular coupling measures. Neuroimage 125, 198–207 (2016).
13. Chen, J. J. & Pike, G. B. BOLD-specific cerebral blood volume and blood flow changes during neuronal activation in humans. NMR Biomed. 22, 1054–1062 (2009).
14. Chiarelli, P. A., Bulte, D. P., Piechnik, S. & Jezzard, P. Sources of systematic bias in hypercapnia-calibrated functional MRI estimation of oxygen metabolism. Neuroimage 34, 35–43 (2007).
15. Howarth, C., Mishra, A. & Hall, C. N. More than just summed neuronal activity: how multiple cell types shape the BOLD response. Philos. Trans. R. Soc. B Biol. Sci. 376, 20190630 (2021).
Figures