3840
Investigation of cerebral blood flow and volume changes during positive and negative BOLD responses at 3T1Max Planck Institute for Human Cognitive and Brain Sciences, Leipzig, Germany
Synopsis
Keywords: fMRI (task based), Arterial spin labelling, Vascular Space Occupancy
CBF and CBV changes were measured sequentially, in regions of positive and negative BOLD responses, using a multi-echo center-out readout, known to reduce BOLD contaminations in pCASL and VASO measurements due to its short echo times. The CBV-CBF coupling was found to differ between positive and negative BOLD regions. The temporal relation of the CBF and VASO timecourses to their corresponding T2* timecourses, on the other hand, was found to be almost identical in the two ROIs.Introduction
An investigation into the vascular basis of the blood oxygenation level-dependent (BOLD) response involves the measurement of corresponding changes in cerebral blood flow (CBF) and volume (CBV). A simultaneous measurement of all three quantities is, hence, recommended. Such a measurement, however, poses a number of technical and estimation issues, especially if quantifiable measures are of interest rather than just an indication of a direction of change. This is only compounded further in measurements involving negative BOLD changes due to a weaker response and higher regional variation. In the current work, we acquired the two vascular quantities simultaneously with positive (PBR) and negative BOLD responses (NBR) through sequential acquisitions of previously optimized pCASL and VASO sequences. These preparations were combined with a multi-echo readout capable of short minimum echo and inter-echo times, which has been proven to substantially improve the sensitivity of CBF1 and CBV2 measurements.Methods
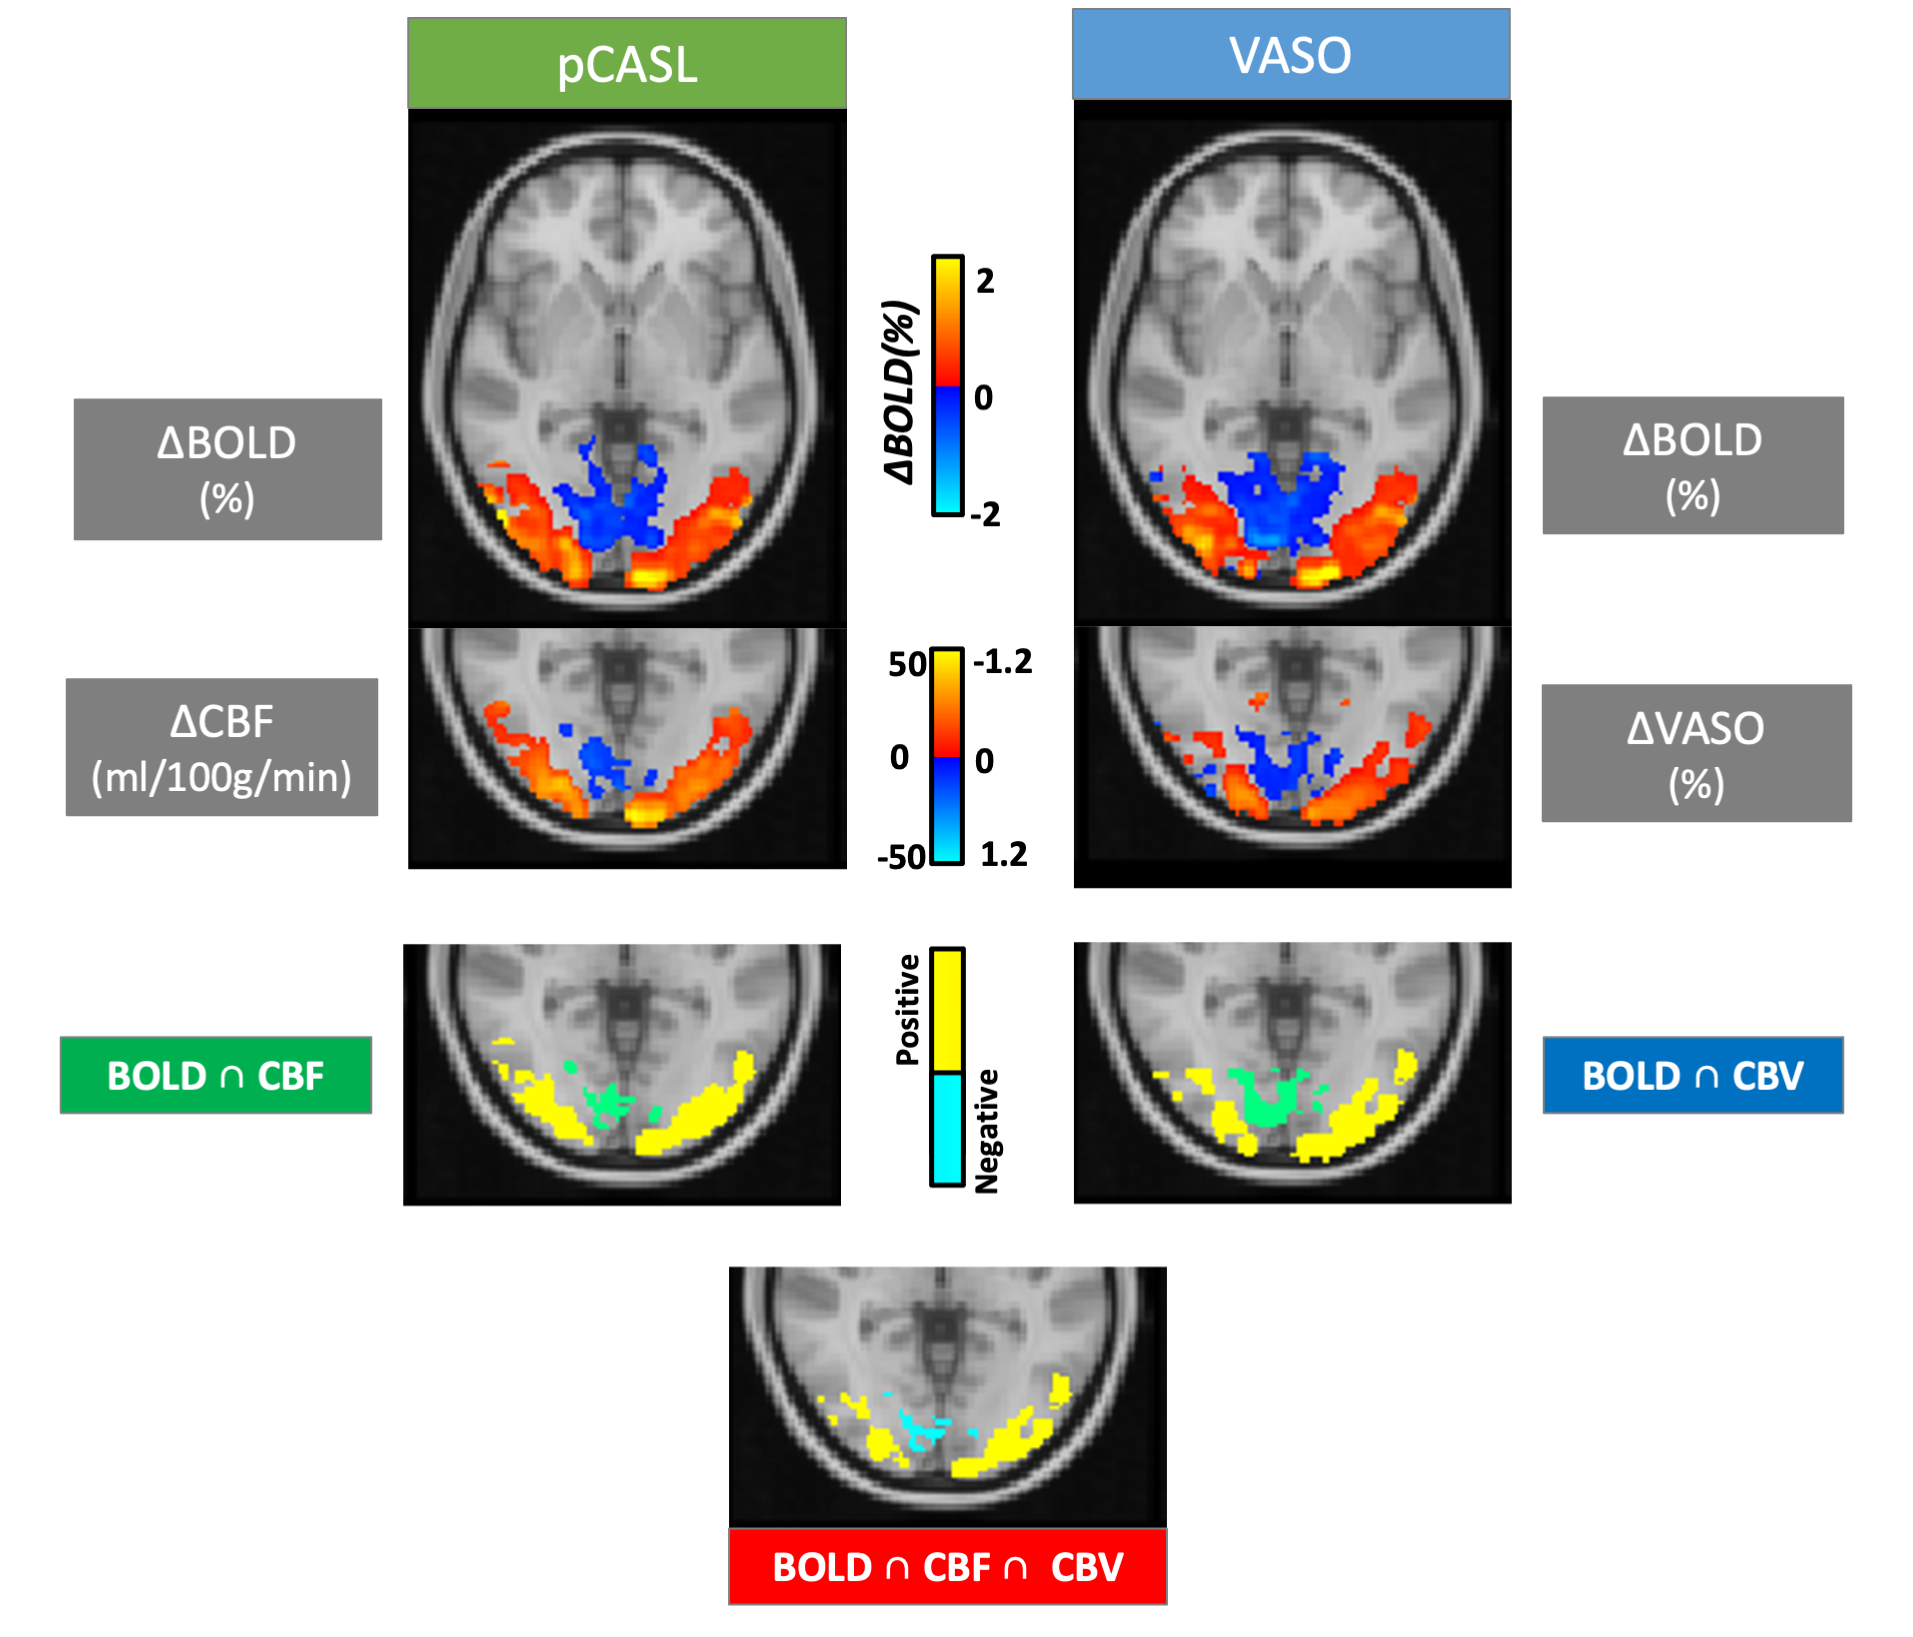
CBF and CBV changes occurring concurrently with PBR and NBR were measured using pCASL3,4 and SS-SI-VASO5 prepared ME-DEPICTING1,6 (TE1/TE2/TE3 = 1.7/10.7/19.7ms, GRAPPA factor 2), respectively, at 3T on Siemens MAGNETOM Prismafit and Skyrafit scanners. 18 healthy volunteers participated in the visual task experiment (small 8Hz flickering radial checkerboard7, 8TR task/12TR gray screen). pCASL and VASO data were acquired sequentially within the same session from 10 slices (thickness 4mm, matrix 64×64, FOV 192mm, no gap, bandwidth 2kHz/Px) located along the calcarine sulcus. The preceding pCASL acquisition parameters were: 200 repetitions; TR=3.5s; labeling duration, τ=1500ms; post-labeling delay, PLD=1200ms; while the SS-SI-VASO (400 repetitions, TR=2s) was implemented using a slab-selective inversion (34cm inversion width, centered in the middle of the slice package) in a descending order (nulling condition, TI=1153ms, fulfilled for the 6th slice). The scan durations of the two functional runs were kept equivalent at ~12mins.All multi-echo (ME) data were pre-processed in a similar manner: realignment, normalization, temporal (1/2 cycle duration) and spatial filtering (FWHM=2mm), following which the S0 and effective transverse relaxation rate (R2*) time series were obtained by linear regression and combined multi-echo (CME) data computed. VASO control and label data were pre-processed separately. ME extrapolation of the label data to TE=0 was preferred over the dynamic division approach5 for BOLD correction and ΔVASO determined from the S0 of the label data2. ΔBOLD was then taken from the R2* and CME of the control data. A GLM with the canonical HRF was used for the statistical analyses. ΔVASO% were converted to relative ΔCBV with CBV0=5% and compensated for the imperfect nulling condition of the remaining slices8. ΔCBF, on the other hand, was obtained via an ASL-specific GLM9 applied to TE1 data followed by quantification based on a two-compartment model10,11. Resulting CBF and CBV maps were thresholded at p<0.01 while BOLD maps were thresholded at p<0.0001 to extract positive and negative ROIs (Figure 1).
Results
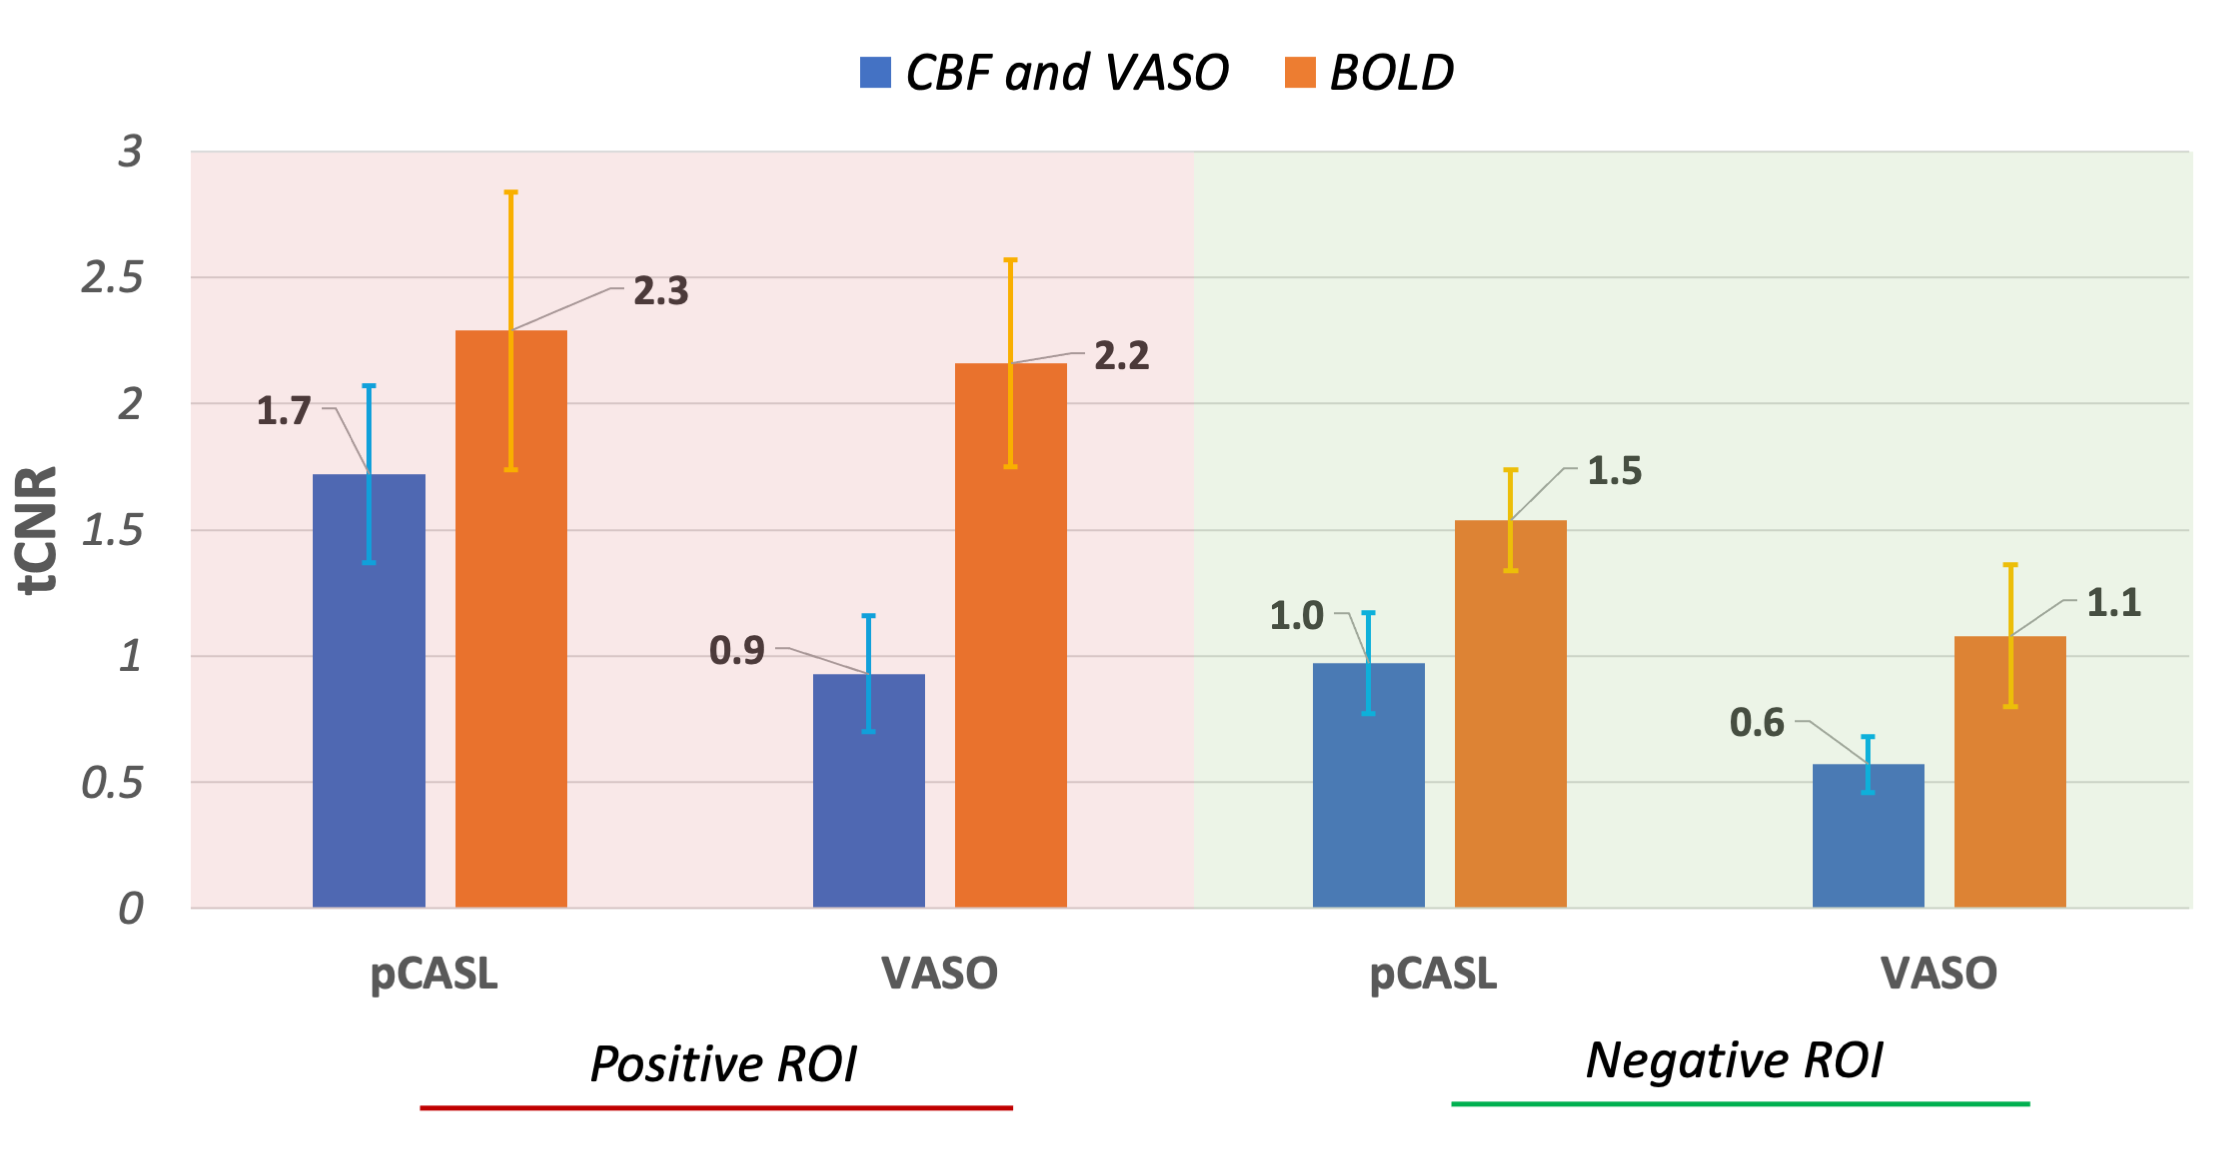
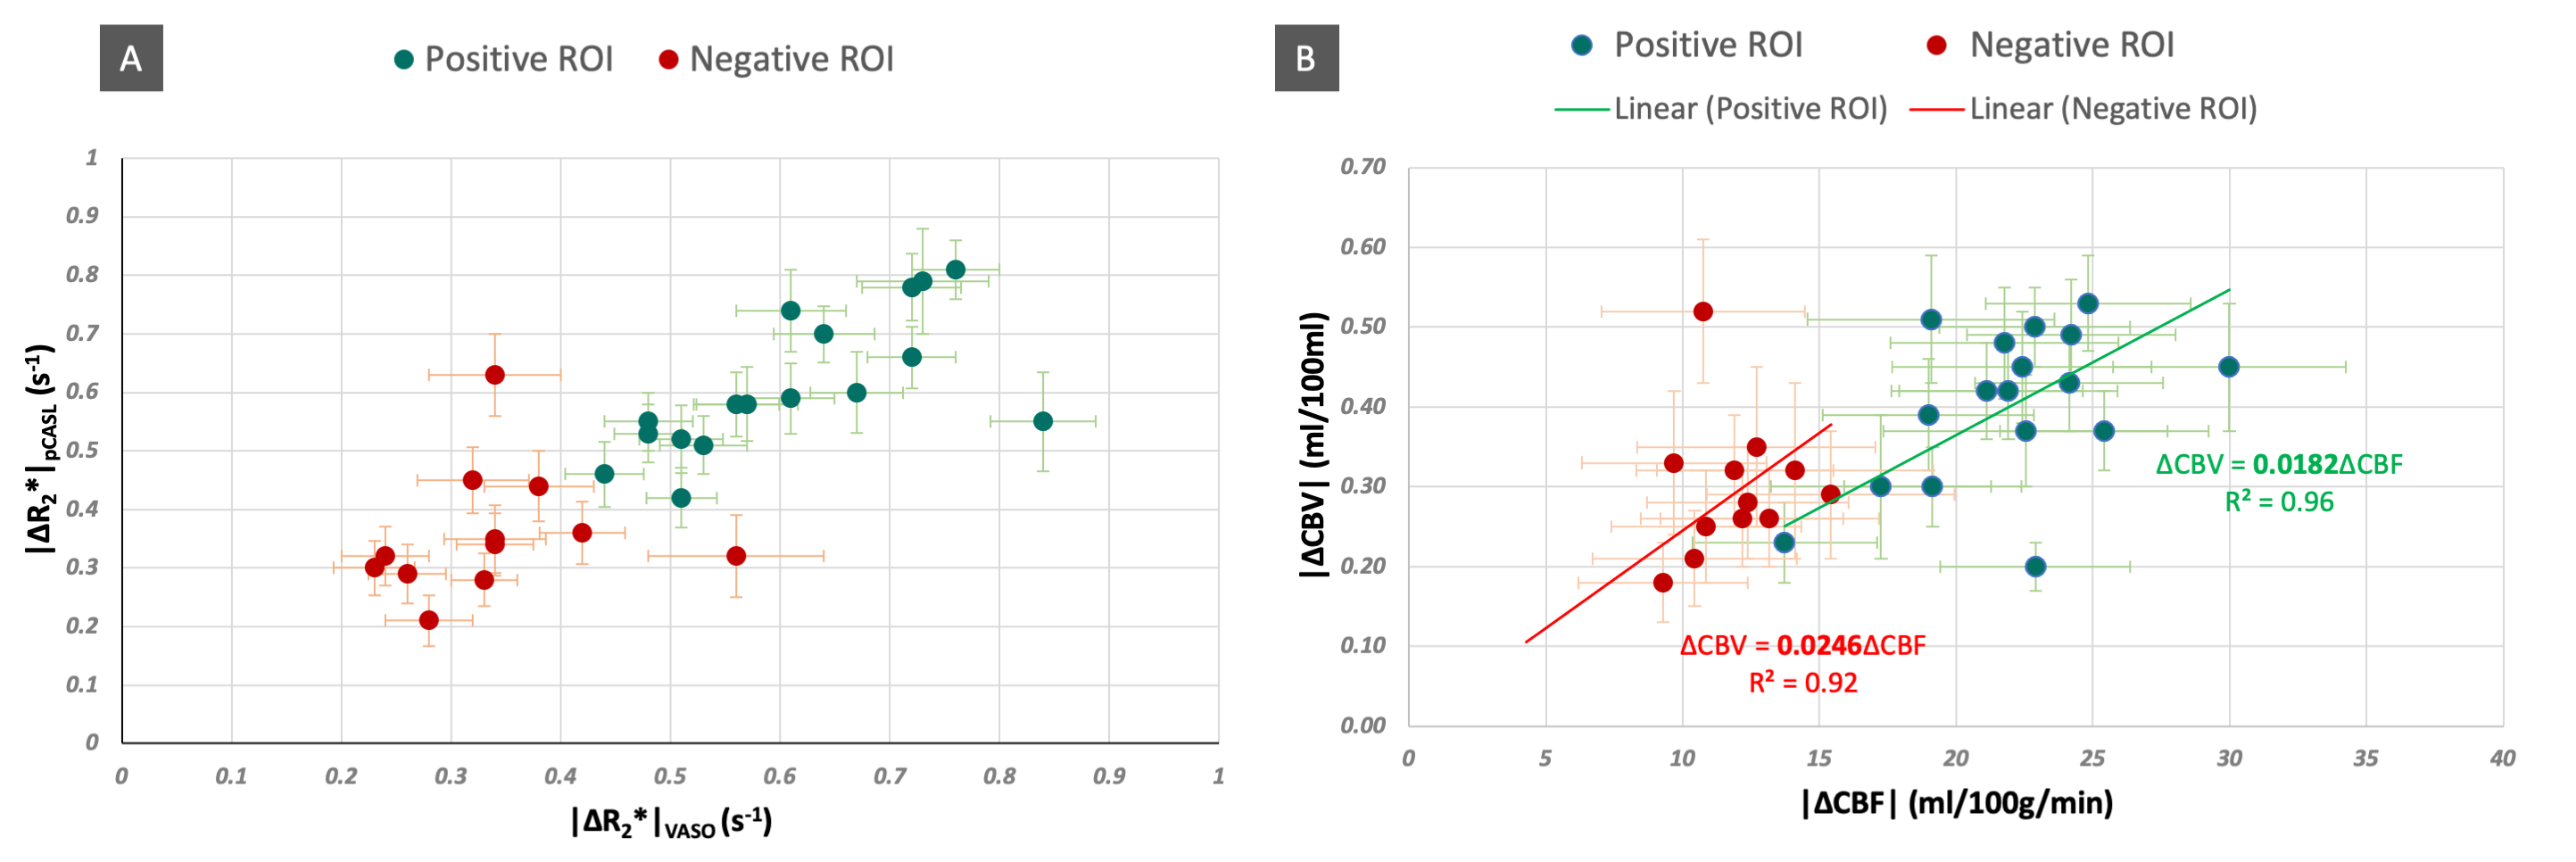
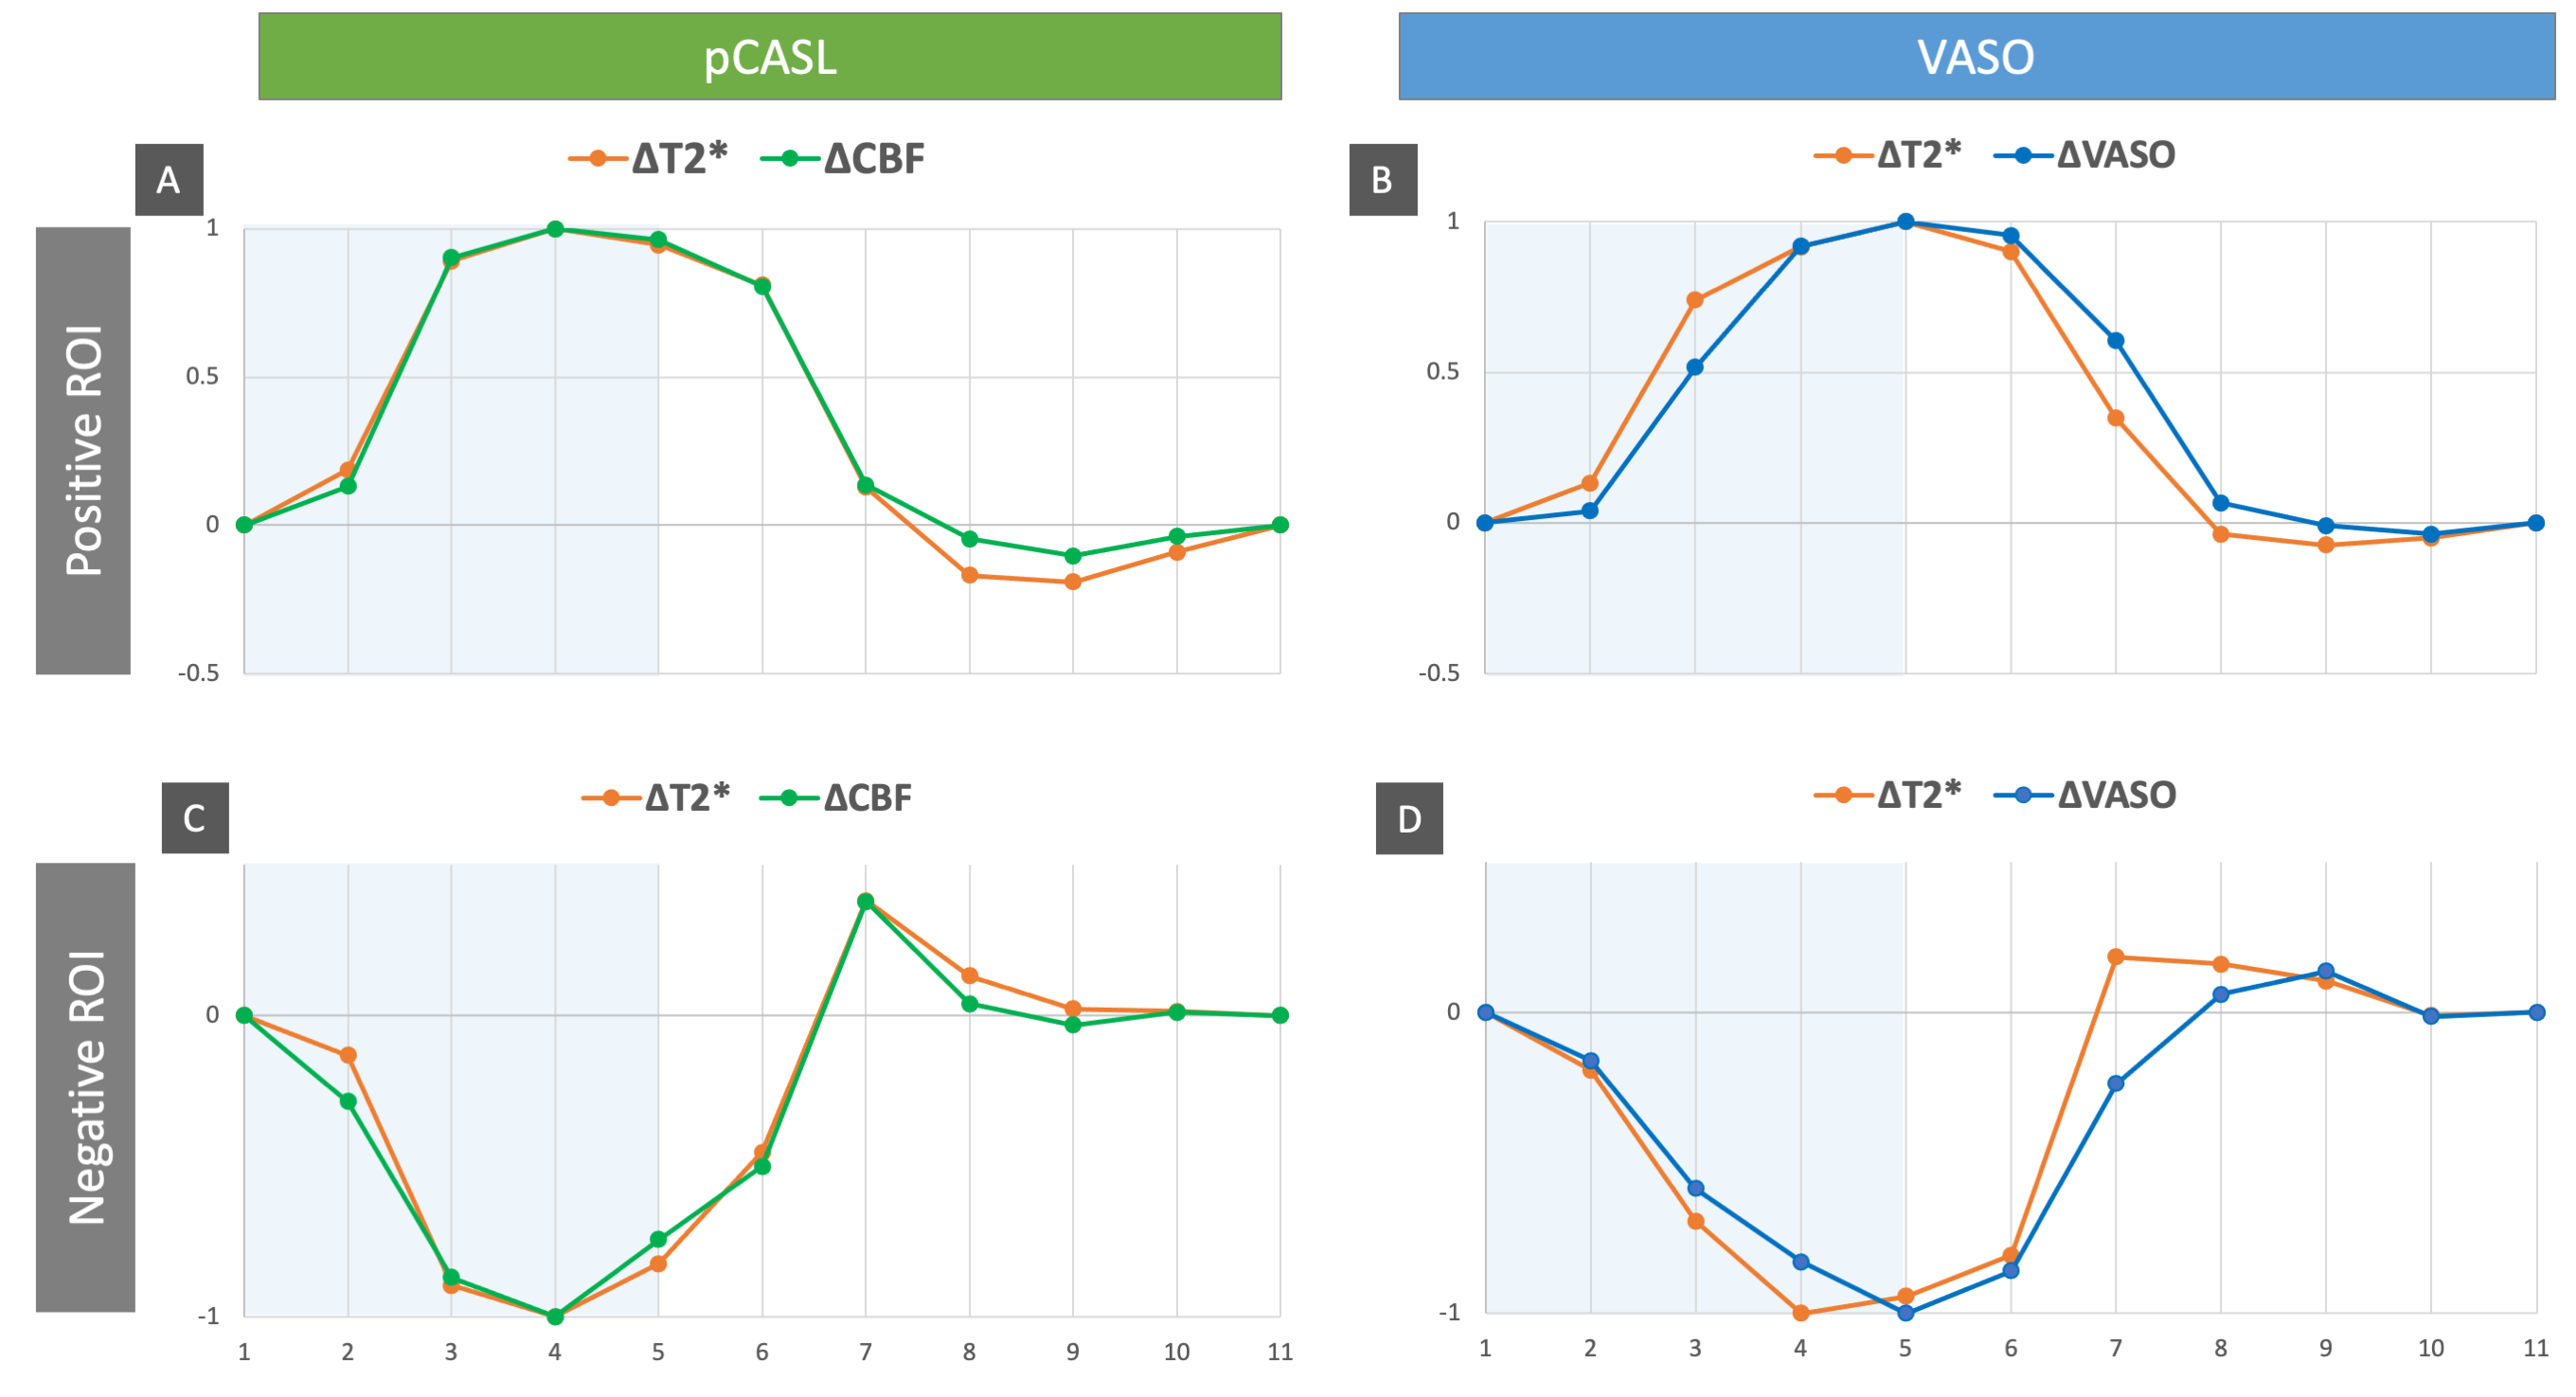
Positive ROIs were identified in 17 subjects (1593±824 voxels) and negative ROIs in 12 subjects (138±151voxels) at the aforementioned thresholds. Figure 2 gives a comparison of the averaged tCNR2 of pCASL, VASO and simultaneously acquired BOLD measurements within these ROIs. With an almost equivalent BOLD tCNR between VASO and pCASL in the positive ROI, the BOLD: CBF: CBV tCNR reduces to 1:0.8:0.4. Despite the sequential acquisition and differing TRs, ΔR2* values obtained from both pCASL and VASO were found to be equivalent in both positive and negative ROIs (Figure 3A). This allowed an investigation into the CBV-CBF relationship. Interestingly, the ΔCBV/ΔCBF ratio was found to be higher in the negative ROI, averaging at 0.0254±0.0084 vs 0.0185±0.0040 in the positive ROI. This difference is also shown in Figure 3B. Furthermore, a time lag was identified in the positive and negative VASO timecourses with regards to the corresponding BOLD responses used as a reference (Figure 4).Discussion & Conclusion
CBV decreases in regions of NBR were ascertained for the first time using VASO fMRI at 3T. The corresponding CBF decrease unequivocally associates the role of vasoconstriction with NBR1,7. As expected, the functional detection capability for these decreases was lower than the corresponding CBF and CBV increases in PBR. The higher tCNR of CBF compared to CBV in both ROIs, however, contradicts reported sensitivities at 7T13. This difference could be attributed to the different ASL techniques being preferred at the two field strengths: FAIR vs pCASL, of which the latter is known to have the better SNR14. Our optimized pCASL also benefits from TE1<2ms of the readout. The somewhat lower tCNR of VASO (40-50% of BOLD) at 3T is, hence, surprising. Lower effect sizes owing to our large voxels could be a contributing factor.The temporal dynamics of our ΔVASO timecourses bear a good resemblance to that of total ΔCBV from previous high-resolution study at 7T7. The slower VASO response, and hence, slower return to baseline in both ROIs compared to BOLD or CBF agrees with previous observations7,15,16 and the vascular compliance model17.
The differing ΔCBV/ΔCBF ratios between the two ROIs poses a question regarding the use of the same Grubbs coefficient ‘α’ for CMRO2 estimations within the Davis18 model for both PBR and NBR. The disparate vascular anatomy of the two ROIs and lack of experimental CBV0 will, however, need to be considered.
Acknowledgements
No acknowledgement found.References
1. Devi, R. et al. Multi-echo investigations of positive and negative CBF and concomitant BOLD changes. Neuroimage 263, 119661 (2022).
2. Devi, R., Mildner, T., Schlumm, T. & Möller, H. E. CBV-Based fMRI at 3T with SS-SI VASO: Multi-Echo DEPICTING vs Multi-Echo EPI. Proc. Intl. Soc. Mag. Reson. Med. 30, (2022).
3. Dai, W., Garcia, D., De Bazelaire, C. & Alsop, D. C. Continuous flow-driven inversion for arterial spin labeling using pulsed radio frequency and gradient fields. Magn. Reson. Med. 60, 1488–1497 (2008).
4. Lorenz, K., Mildner, T., Schlumm, T. & Möller, H. E. Characterization of pseudo-continuous arterial spin labeling: Simulations and experimental validation. Magn. Reson. Med. 79, 1638–1649 (2018).
5. Huber, L. et al. Slab-selective, BOLD-corrected VASO at 7 tesla provides measures of cerebral blood volume reactivity with high signal-to-noise ratio. Magn. Reson. Med. 72, 137–148 (2014).
6. Hetzer, S., Mildner, T. & Möller, H. E. A Modified EPI sequence for high-resolution imaging at ultra-short echo time. Magn. Reson. Med. 65, 165–175 (2011).
7. Huber, L. et al. Investigation of the neurovascular coupling in positive and negative BOLD responses in human brain at 7T. Neuroimage 97, 349–362 (2014).
8. Scouten, A. & Constable, R. T. Applications and limitations of whole-brain MAGIC VASO functional imaging. Magn. Reson. Med. 58, 306–315 (2007).
9. Hernandez-Garcia, L., Jahanian, H. & Rowe, D. B. Quantitative analysis of arterial spin labeling FMRI data using a general linear model. Magn. Reson. Imaging 28, 919–927 (2010).
10. Wang, J. et al. Comparison of quantitative perfusion imaging using arterial spin labeling at 1.5 and 4.0 Tesla. Magn. Reson. Med. 48, 242–254 (2002).
11. Mildner, T. et al. Mapping of arterial transit time by intravascular signal selection. NMR Biomed. 27, 594–609 (2014).
12. Geissler, A. et al. Contrast-to-noise ratio (CNR) as a quality parameter in fMRI. J. Magn. Reson. Imaging 25, 1263–1270 (2007).
13. Huber, L., Uludağ, K. & Möller, H. E. Non-BOLD contrast for laminar fMRI in humans: CBF, CBV, and CMRO2. NeuroImage 197, 742–760 (2019).
14. Alsop, D. C. et al. Recommended implementation of arterial spin-labeled Perfusion mri for clinical applications: A consensus of the ISMRM Perfusion Study group and the European consortium for ASL in dementia. Magn. Reson. Med. 73, 102–116 (2015).
15. Goense, J., Merkle, H. & Logothetis, N. K. High-Resolution fMRI Reveals Laminar Differences in Neurovascular Coupling between Positive and Negative BOLD Responses. Neuron 76, 629–639 (2012).
16. Uludağ, K. & Blinder, P. Linking brain vascular physiology to hemodynamic response in ultra-high field MRI. Neuroimage 168, 279–295 (2018).
17. Buxton, R. B., Wong, E. C. & Frank, L. R. Dynamics of blood flow and oxygenation changes during brain activation: the balloon model. Magn Reson Med 39, 855–864 (1998).
18. Davis, T. L., Kwong, K. K., Weisskoff, R. M. & Rosen, B. R. Calibrated functional MRI: mapping the dynamics of oxidative metabolism. Proc. Natl. Acad. Sci. U. S. A. 95, 1834–1839 (1998).
Figures