3839
Dynamic analysis of resting-state brain fMRI signal from a novel perspective: Avalanche1Electrical and Computer Engineering, Vanderbilt University, Nashville, TN, United States, 2Vanderbilt University Institute of Imaging Science, Vanderbilt University Medical Center, Nashville, TN, United States
Synopsis
Keywords: fMRI (resting state), Brain, Spatiotemporal
The human brain, at rest, is complex and many functional studies focus on the brain patterns around criticality. This work addresses a novel perspective, the avalanche, in resting-state fMRI. In this work, we design two data-driven signal modeling approaches that dynamically measure and visualize the signal entropy from both spatial and temporal aspects. The first approach applies a clustering-based scheme with the Markov chain. The second method utilizes the autoregressive model with a sliding window. The results show a consistent, less complex pattern at the avalanche state, from which the interpretation of the brain can be clearer than at criticality.Introduction
The human brain is considered a complex system, which intuitively suggests a system undergoing a characteristic order-disorder phase transition around a critical point, "criticality."1 This critical state has raised the interest of researchers in studying the brain. Studies2 show that the brain at criticality presents the highest system complexity, and the connections between brain regions reach a maximal capacity.However, this work addresses a novel perspective from studying the more simple and highly organized brain state, denoted as "avalanche." Tagliazucchi, 2012 proposed a point process approach to avalanche detection using the fMRI modality for the first time1. In his work, the avalanche, a tiny portion of the fMRI signal (about 6%), was shown to preserve correlational information for encoding resting-state networks using the entire fMRI signal. Recently, some works also involve a similar concept of studying the functional connectivity (FC) from only the cascades of peaks of the seed region's fMRI signal3-5.
In this work, we perform dynamic analysis around the large-scale avalanche. Firstly, we perform a clustering-based brain state decomposition and correlate the brain state transition with the avalanche using the Markov model. Secondly, we propose a new method of dynamically measuring temporal signal entropy utilizing the autoregressive model and sliding window. Both show that the avalanche represents a brain state of lower entropy, which should inspire more attention in the research field.
Methods
HCP dataset.54 young adult subjects were randomly drawn from the 3T minimum preprocessed resting-state fMRI scans in the HCP S1200 release. A gradient-echo EPI sequence uses the parameters: repetition time (TR) = 720 ms, echo time (TE) = 33 ms, image matrix = 109 × 91 × 91 voxels, 72 slices, 1200 volumes. Reference6 provides a detailed description.
Large-scale fMRI avalanche.
In Fig. 1A, the number of clusters (group of active voxels) and their variability reach the maximum at criticality (Red square and Dash line). Above the criticality (right side), the reversed correlation presents a pattern of coupling small clusters into fewer larger ones. Thus, the avalanche is represented as the right tail of Fig. 1A and the few gigantic peaks in Fig. 1B.
Spatiotemporal pattern decomposition
We performed a clustering-based signal decomposition approach to measure the fMRI signal's co-activation patterns (CAPs). The procedure is shown in Fig. 2. This approach correlates the global signal to the spatial patterns.
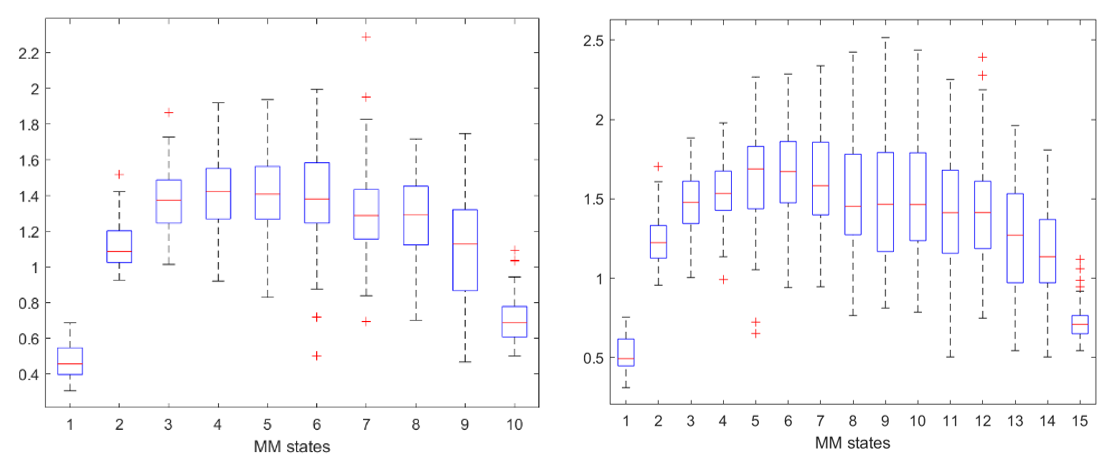
Markov chain and entropy. The state sequence is then input into a Markov chain model7 that formulates the probabilistic interpretation of the temporal dynamics of the state transition. The information entropy8 is then computed based on the transition matrix to show the complexity of the dynamic change of the states.
$$spatiotemporal\ entropy\ of \ state \ i:\ H_{i} = \sum H_{i, j} = -\sum P(j|i)_{t|t-1} logP(j|i)_{t|t-1}$$
Autoregressive model on temporal predictivity
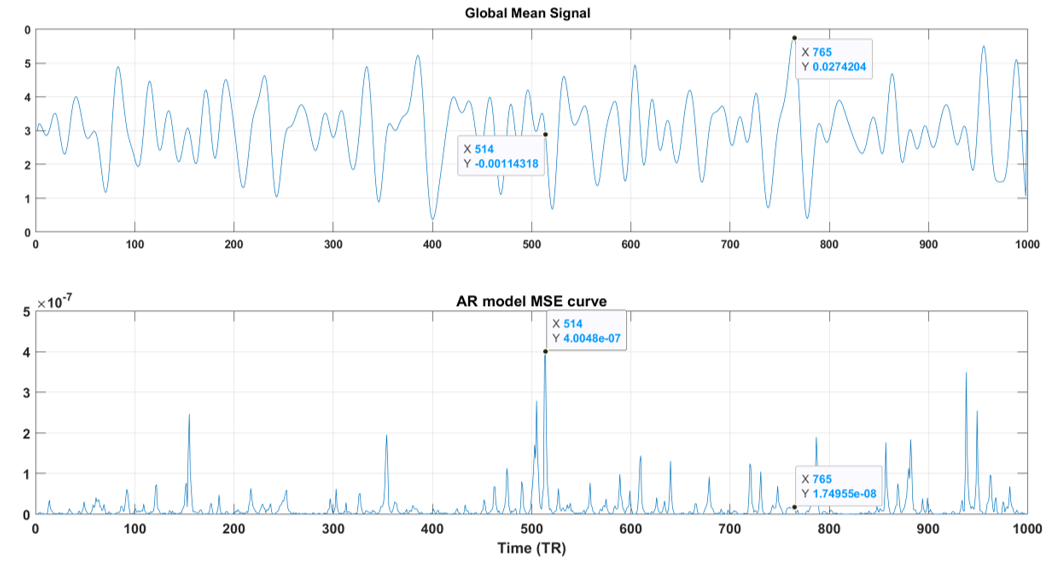
A small order (M) autoregressive (AR) model9 (equation below) is utilized to explore the dynamic change of the signal of interest. A sliding window (of length 2M +1, M=2) scheme then truncates the fMRI signal for the data-driven measure. The Mean Squared Error (MSE) of each window then quantifies the signal predictivity dynamically. Conceptually, the high MSE value corresponds to more complex and erratic dynamic signal predictions (high entropy).
$$X_{t} = c + \sum_{i=1}^{M}\phi_{i}X_{t-i} \ + \varepsilon\ (noise)$$
Results
Spatiotemporal correlationIn the experiment, we applied the clustering scheme with multiple choice of k for robust results. Fig. 3A is a global correlation signal measure (IWBC) from our previous work6, and Fig. 3B displays the corresponding activation patterns. Obviously, the decomposed brain activation shows a synchronization with the global fMRI signal. The large peaks in Fig. 3A (avalanche) present a highly synchronized brain co-activation shown as Fig. 3B state 8.
Spatiotemporal entropy using the Markov model
For the spatiotemporal entropy, we also reproduce the results for 54 subjects and different k. Fig. 4 (k = 10 and 15) illustrates the state transition complexity from the group analysis. As expected, the avalanche states (right tail) present low complexity. Interestingly, the very quiet states also show a less complex pattern.
Temporal entropy using the AR model
We use the global mean as the global fMRI signal. In Fig. 5, two temporal points representing significantly high and low signal magnitudes are annotated. Apparently, the avalanche state (765 TR) is linked to a lower MSE, representing the signal as more predictable. Instead, the temporal signal complexity is much higher at or below criticality (514 TR). This consistent pattern is also found across the subjects.
Discussion
In this work, we found in all methods that the avalanche state presents a low entropy. Compared to the criticality, the avalanche state tends to stay consistent (from spatiotemporal entropy) and simple (from our defined temporal signal entropy). An inspiring direction in practice is that apart from studying the brain functions from an ad-hoc and complex state as criticality, the brain signal interpretation can be clearer from the avalanche.Conclusion
In this work, we design clustering-based and autoregressive models to measure the resting-state fMRI signal entropy dynamically. The signal of interest, the avalanche, shows consistent patterns of low entropy in all methods and thus provides insight into studying brain function through the highly organized state.Acknowledgements
No acknowledgement found.References
1. Tagliazucchi, E., Balenzuela, P., Fraiman, D., and Chialvo, D. R., “Criticality in large-scale brain fmri dynamics unveiled by a novel point process analysis,” Frontiers in physiology 3, 15 (2012).
2. B. Song, N. Ma, G. Liu, H. Zhang, L. Yu, L. Liu and J. Zhang, “Maximal flexibility in dynamic functional connectivity with critical dynamics revealed by fMRI data analysis and brain network modelling,” journal of neural engineering, vol. 16, no. 5, p. 056002, 2019.
3. X. Liu, N. Zhang, C. Chang and J. H. Duyn, “Co-activation patterns in resting-state fMRI signals,” NeuroImage, vol. 180, pp. 485-494, 2018.
4. A. Nalci, B. D. Rao and T. T. Liu, “Global signal regression acts as a temporal downweighting process in resting-state fMRI,” Neuroimage, vol. 152, pp. 602-618., 2017.
5. H. He and T. T. Liu, “A geometric view of global signal confounds in resting-state functional MRI,” Neuroimage, vol. 59, no. 3, pp. 2339-2348., 2012.
6. J. Guo, “Co-activation Pattern Analysis of Brain fMRI Signal at Avalanches (Master thesis).,” Vanderbilt University, Nashville, 2020.
7. H. Maltby, "Brilliant," [Online]. Available: https://brilliant.org/wiki/markov-chains/.
8. R. M. Gray, Entropy and Information theory, Springer Science & Business Media, 2011.
9. H. Akaike, “Autoregressive Model Fitting for Control,” in: Parzen E., Tanabe K., Kitagawa G. (eds) Selected Papers of Hirotugu Akaike, New York, Springer, 1998.
Figures
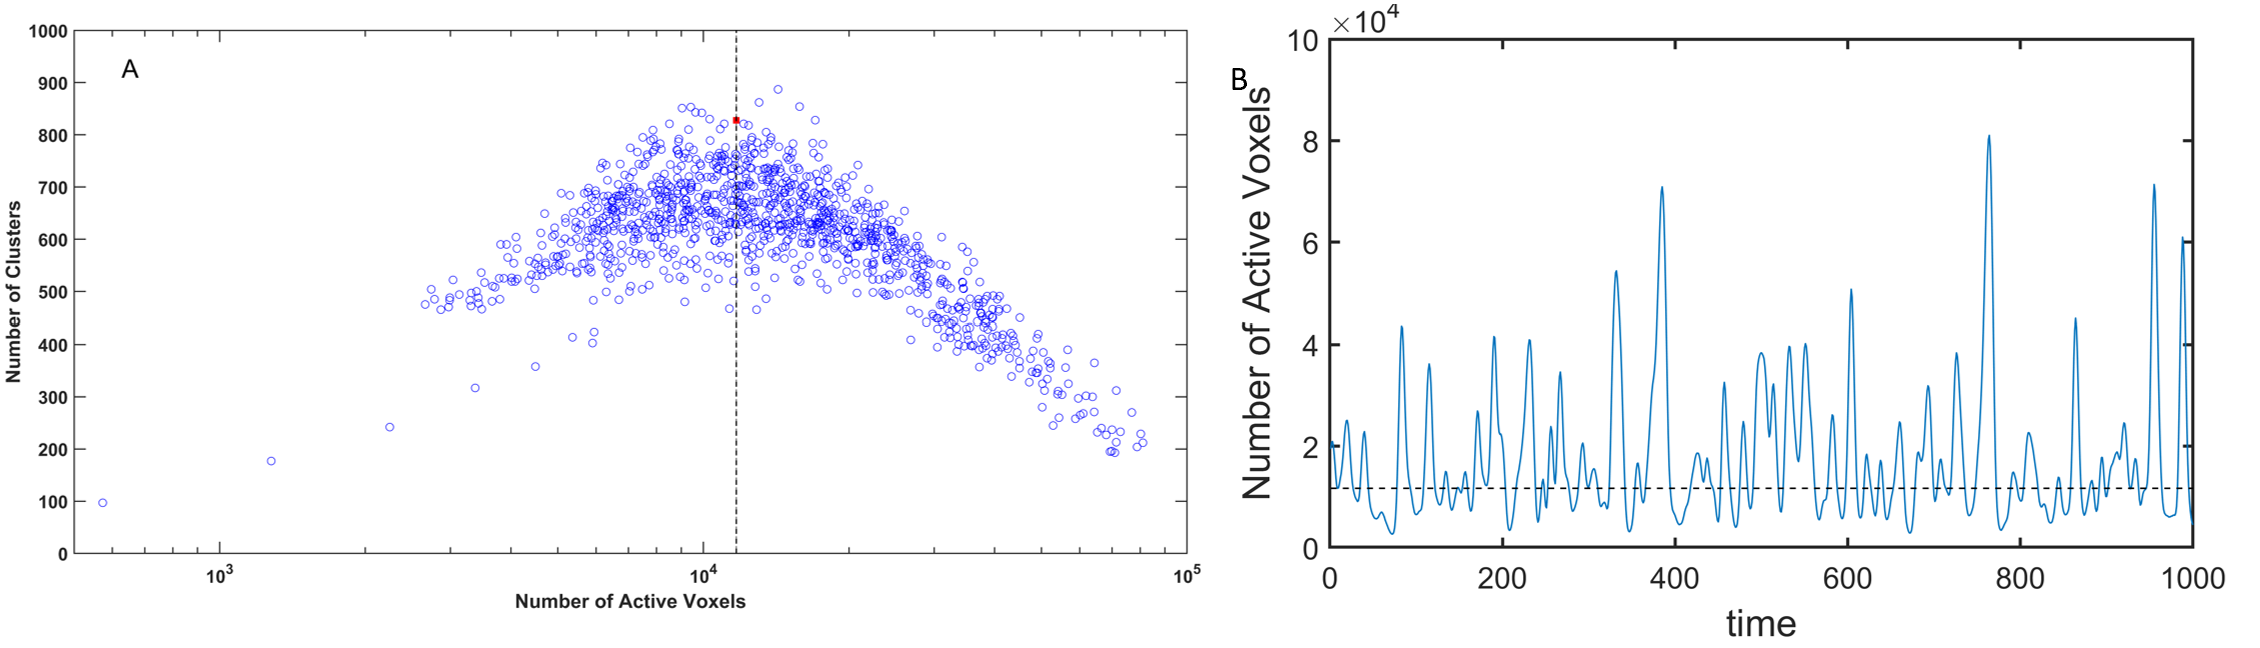
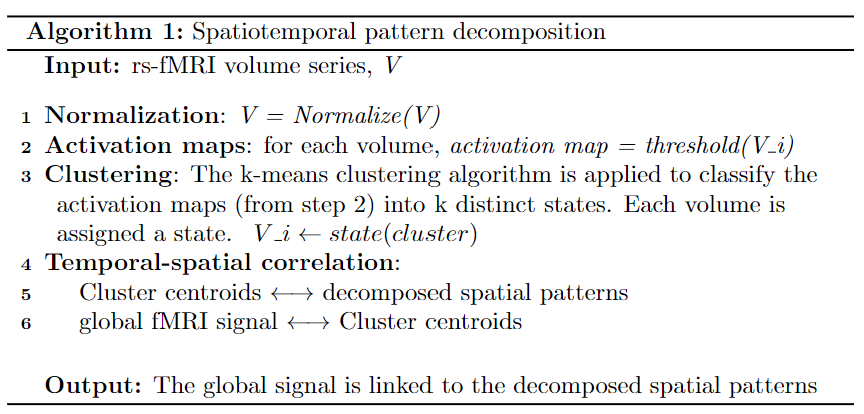
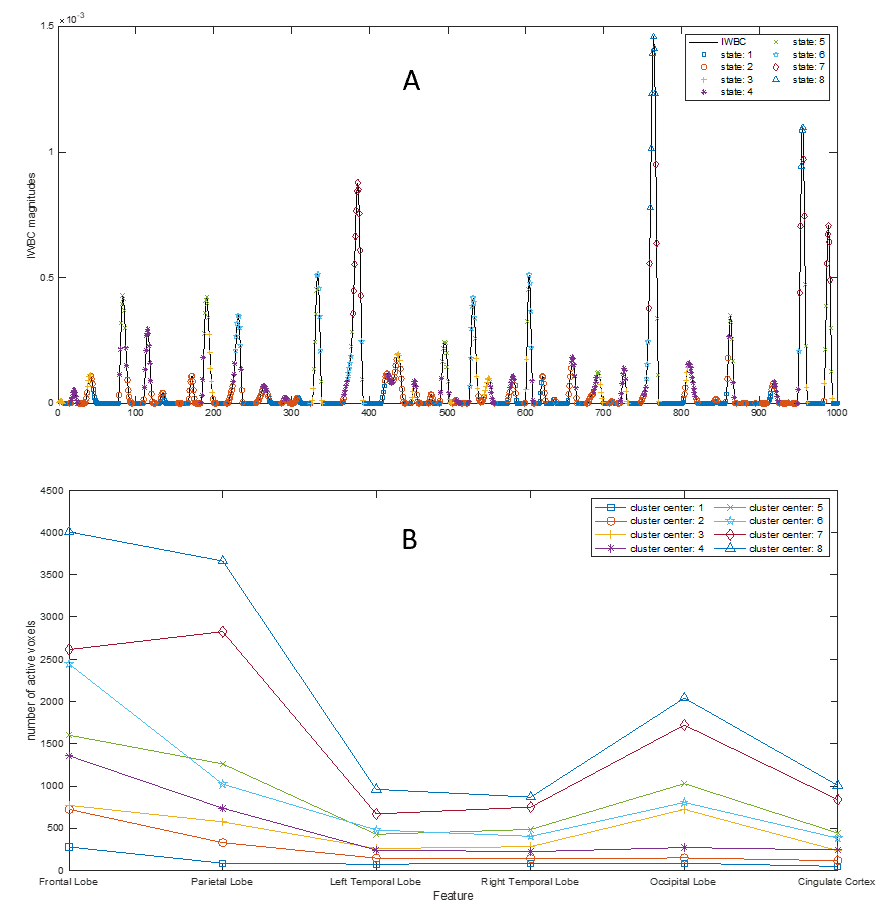
Figure 3. Clustering-based spatiotemporal correlation. States are assigned positive integers (1 to k), with state k quantifying the most active and state 1 representing the lowest activation. This approach allows the global signal (in A) to be linked to the decomposed spatial patterns and provides a dynamic approach to observe the brain's spatial activation through the centroids (in B). For example, the avalanche corresponnds to the gigantic peak in (A) and is assigned with most active state 8.