3838
FMRI-based language mapping at 1.5 and 3T: the influence of methodological choices.1School of Biomedical Engineering & Imaging Sciences, King's College London, London, United Kingdom, 2Neuroradiology, King's College Hospital, London, United Kingdom, 3MRI Physics, Guy’s and St Thomas NHS Foundation Trust, London, United Kingdom, 4Radiology Department, Great Ormond Street Hospital for Children, London, United Kingdom
Synopsis
Keywords: fMRI (task based), Data Analysis
This work aims to assess the influence of methodological aspects in fMRI language mapping at 1.5T and 3T. Probability maps from healthy volunteer cohorts were compared to a published reference using a Dice Index vs probability threshold plot. T-value normalisation to the peak within the classic Broca/Wernicke’s language area as well as the inclusion of additional language tasks increased overlap to the reference. The extent of reproducible activation was larger at 3T.
Introduction
Pre-surgical information on brain language function can optimise the neurosurgical planning process and minimise post-surgery functional deficit1. BOLD fMRI provides non-invasive language mapping, but results are influenced by methodological aspects including field strength, language paradigms used, and post-processing techniques implemented by different centres2. This study compares task-based language fMRI at 1.5 and 3T and evaluates the influence of different t-value normalisation approaches and number of language tasks used. Pre-surgical information on brain language function can optimise neurosurgical planning and minimise post-surgery functional deficit1. BOLD fMRI provides non-invasive language mapping, but results are influenced by methodological aspects including field strength, language paradigms, and post-processing techniques implemented by different centres2. This study compares task-based language fMRI at 1.5 and 3T and evaluates the influence of t-value normalisation approaches and number of language tasks used.Methods
This study considers right-handed healthy volunteer groups. Fifteen language fMRI datasets from a prior study at 1.5T3 were included and fifteen further datasets were acquired at 3T. The MRI protocol included a three-dimensional T1-weighted MPRAGE anatomical sequence (TE/TR=2.90/2200ms, voxel size=1x1x1mm3, flip angle of 8°, parallel imaging acceleration of 2) and BOLD-contrast fMRI gradient-echo EPI sequences (TE=40ms, TR=2000ms, voxel size=2.5x2.5x2.5mm3, acceleration factors: parallel imaging = 2, simultaneous multi-slice acceleration = 2). Three language tasks were adopted at both field strengths: Verb Generation (VG), Word Fluency (WF), and Picture Naming (PN), and two further tasks were added at 3T: Passive Story Listening (PSL) and Sentence Completion (SC).For each task, per-subject t-maps were produced using SPM124, normalized both spatially and according to t-value, and then thresholded to 60% of the normalization value before being combined into probability maps. Two normalization t-values were considered: the peak within 1) the left (dominant side) classic language area (LA) including Broca’s and Wernicke’s or 2) the LA plus supplementary motor area (SMA), as defined by published brain atlases5,6. At 3T, probability maps were produced including the original three tasks (VG, WF, PN) and all five tasks (the previous plus PSL and SC). A published language activation probability map was adopted as a reference7. The task-based probability maps were compared to the reference using the Dice Index8,9,10 (DI) to quantify overlap. As overlap varies with threshold, the DI vs threshold plot was used as a metric for comparison.
The following groups were assessed: LA vs LA+SMA peak normalization at 1.5T (three tasks); three vs five tasks at 3T; and 1.5 vs 3T (three tasks).
Results
The plots in Figure 1 shows the influence of t-value normalisation at 1.5T. LA normalisation shows higher DI values compared to LA+SMA across the entire probability threshold range and for all three tasks, indicating greater overlap with the reference activation.The cohort probability maps in Figure 2 show that VG at 3T (red) consistently activates larger areas across subjects. The increase in overlap with the reference is quantified in Figure 3, where higher DIs are found at 3T compared to 1.5T for all three tasks.
Figure 4 shows the increased extent of activated language area at 3T when all five tasks are included (red/blue). This is further illustrated by the associated DI plots in Figure 5.
Discussion
The choice of activation threshold is a longstanding issue in language fMRI11. When t-map scaling approaches are used12, the normalised t-maps are influenced by the location and scale of the normalization value. This work found that t-values in the SMA are often higher than in the dominant LA. Restricting the location of the peak t-value to the LA maximised overlap with the reference (Figure 1) while removing noise and preserving relevant language activation.At 3T, the extent of activated areas increased (Figure 2 and 3), particularly for VG and PN. This aspect produced a greater effect on Dis from each task compared to normalisation, suggesting that a higher field strength should be preferred for a more sensitive and robust localization of language activation.
The coverage of language areas also increased with the addition of PSL and SC (Figure 4). These tasks are expected to stimulate Wernicke’s area2, due to more emphasis on language reception rather than language production. The additional activation in Wernicke’s increased the overlap with reference by an amount quantified in Figure 5.
Single tasks have limited overlap with the full language activation included in the reference map7 (DIs < 0.4 at peak, Figure 1). While the overlap increases with the combination of multiple tasks (Figure 4), the type of tasks included, rather than simply the number, appears to have a greater influence (DIs > 0.7 at peak for all five tasks, Figure 5). This highlights that a comprehensive language mapping requires the combination and inclusion of multiple tasks exploring different language aspects.
Conclusions
This work uses a DI-based metric to quantify the effect of methodological choices on fMRI language mapping, and found that higher field, t-value normalisation to the classic LA, and the inclusion of appropriate language tasks maximised overlap to the reference and optimised the mapping.Acknowledgements
This work was carried out at, and supported by, the Department of Neuroradiology at King’s College Hospital NHS Foundation Trust. The views expressed are those of the authors and not necessarily those of the NHS, the NIHR or the Department of Health.
References
1. Barras CD, Asadi H, Baldeweg T, Mancini L, Yousry TA, Bisdas S. Functional magnetic resonance imaging in clinical practice: state of the art and science, Australian Family Physician 2016; 45(11): 798-803.
2. Black DF, Vachha B, Mian A, Faro SH, Maheshwari M, Sair HI, Petrella JR, Pillai JJ, Welker K. American Society of Functional Neuroradiology-Recommended fMRI Paradigm Algorithms for Presurgical Language Assessment. AJNR. American Journal of Neuroradiology, 2017; 38(10): E65-E73.
3. Rachael Franklin, Enrico de Vita, Irène Brumer, Jozef Jarosz, and Marco Borri How does language fMRI activation in tumour patients compare to healthy volunteers? Proc. Int. Soc. Magn. Reson. Med. 2022;30:1731
4. Flandin G, Novak MJ. fMRI Data Analysis Using SPM. Springer, fMRI 2013; 51– 76.
5. Labache L, Joliot M, Saracco J et al. A SENtence Supramodal Areas AtlaS (SENSAAS) based on multiple task-induced activation mapping and graph analysis of intrinsic connectivity in 144 healthy right-handers. Brain Struct Funct 2019; 224:859–882
6. Jenkinson M, Beckmann CF, Behrens TE, Woolrich MW, Smith SM. FSL. NeuroImage 2012; 62(2): 782–790.
7. Lipkin B, Tuckute G, Affourtit J, Small H, Mineroff, Z, Kean H, Jouravlev O, Rakocevik L, Pritchett B, Siegelman M, Hoeflin C, Pongos A, Blank IA, Struhl MK, Ivanova A, Shannon S, Sathe A, Hoffmann M, Nieto-Castañon A, Fedorenko A. LanA (Language Atlas): A probabilistic atlas for the language network based on fMRI data from >800 individuals. bioRxiv 2022; 2022.03.06.483177
8. Dice LR. Measures of the amount of ecologic association between species. Ecology 1945; 26(3): 297–302
10. Crum WR, Camara O, Hill DLG. Generalized Overlap Measures for Evaluation and Validation in Medical Image Analysis. IEEE Transactions on Medical Imaging 2006; 25(11): 1451-1461
11. Brumer I, De Vita E, Ashmore J, Jarosz J, Borri M. Implementation of clinically relevant and robust fMRI-based language lateralization: Choosing the laterality index calculation method. PLoS ONE 2019; 15(3): e0230129
12. Voyvodic, J. T. (2012) Reproducibility of single-subject fMRI language mapping with AMPLE normalization. Journal of Magnetic Resonance Imaging. [Online] 36 (3), 569– 580.
Figures
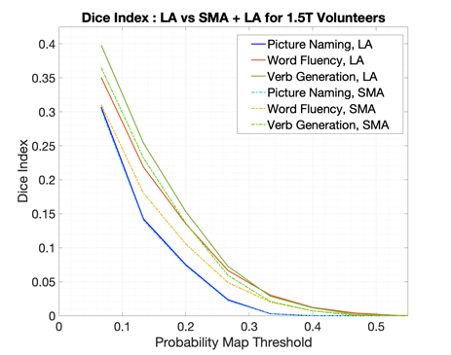
Fig. 1. Dice Index calculations for left language area (LA)-normalised and LA plus supplementary motor area (LA+SMA)-normalised datasets, over a range of thresholds. DIs were calculated within the left LA mask.
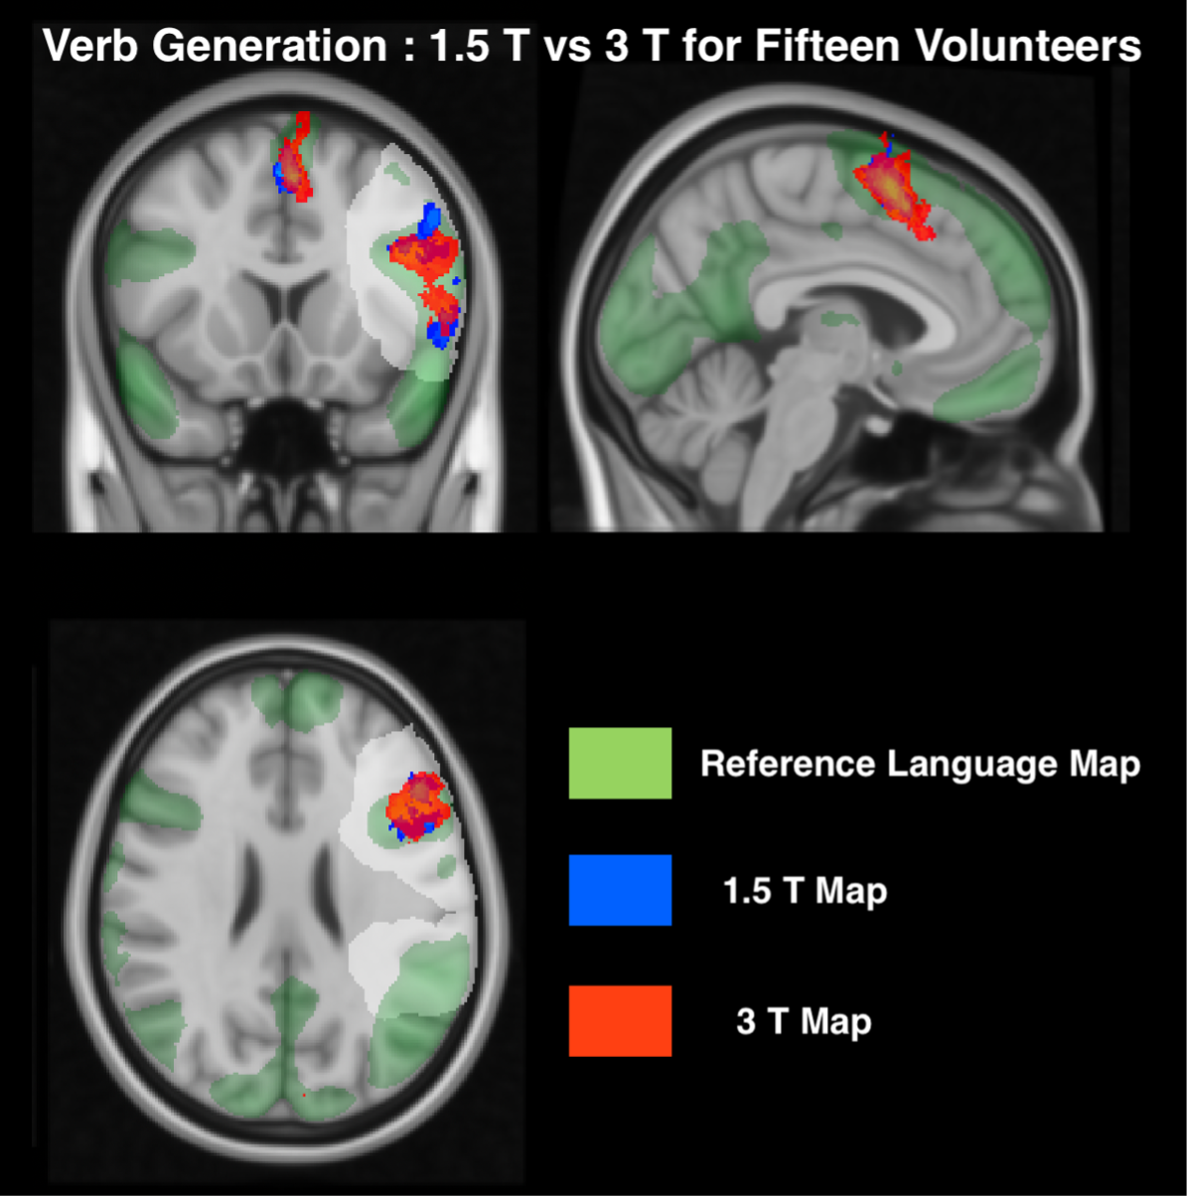
Fig 2. Spatially normalised and thresholded probability maps of the Verb Generation language task for 3T volunteers and 1.5T volunteers overlaid with the reference map onto a standard MNI152 brain. The maps are thresholded at 15% probability.
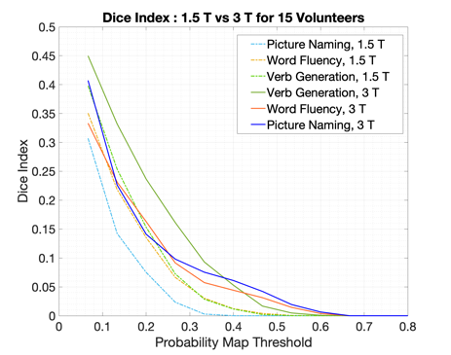
Fig. 3. Dice Index calculated for tasks from the 1.5T volunteers and 3T volunteers, over a range of thresholds. The per-subject t-maps were normalised to the peak t-value in left LA area and DIs were calculated within the left LA mask.
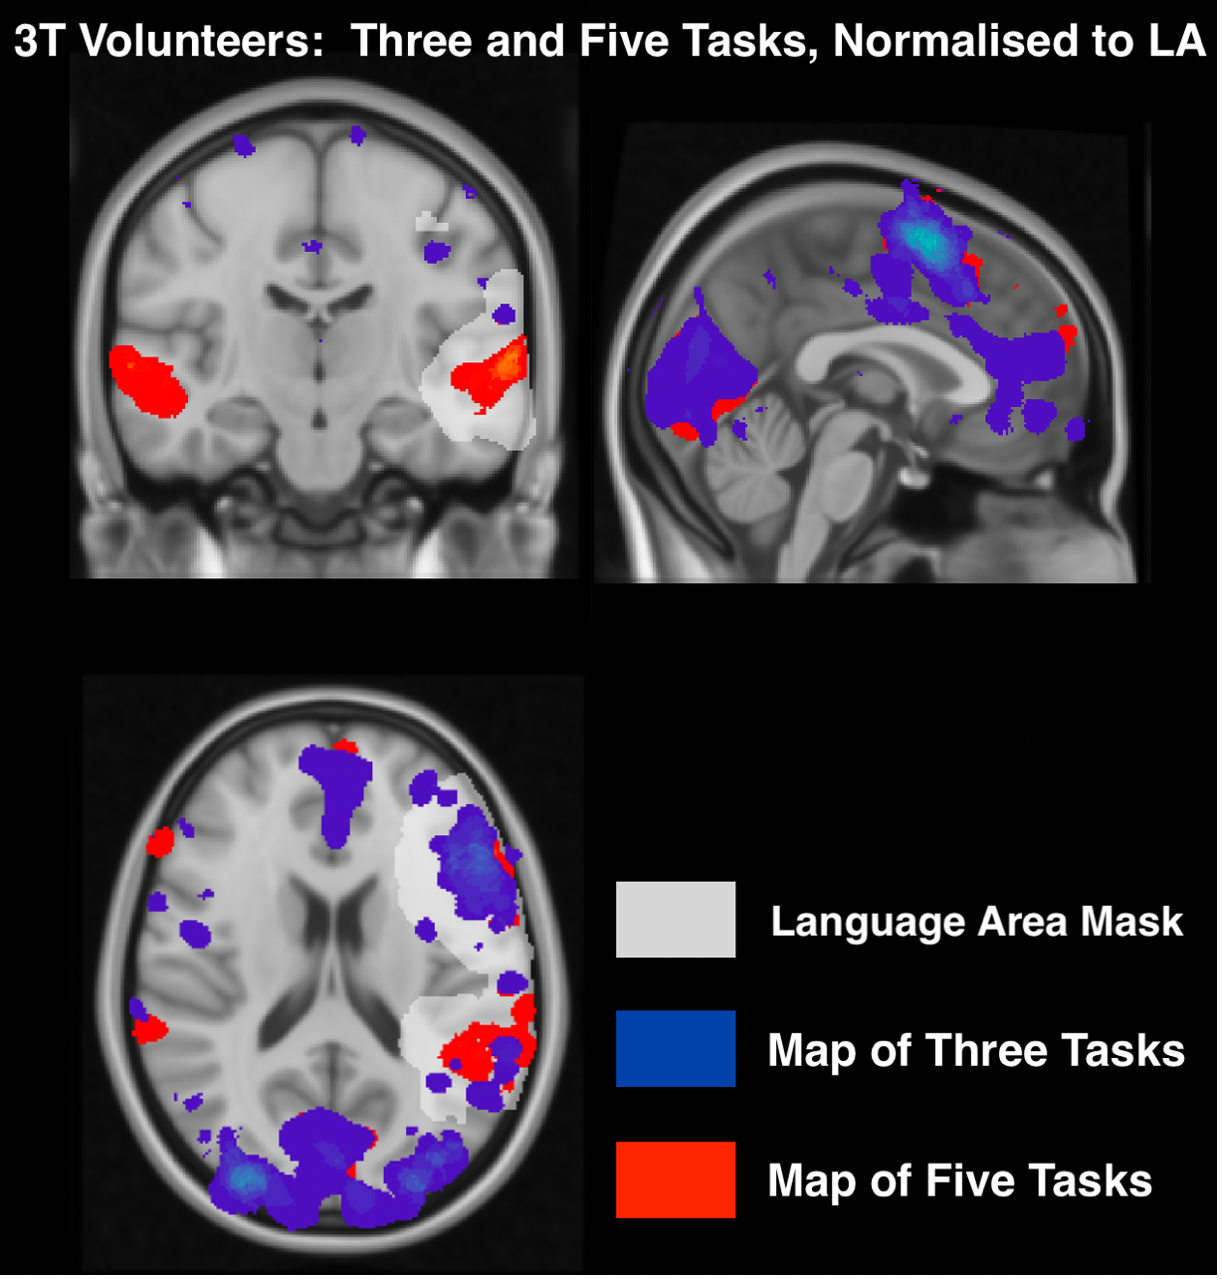
Fig. 4. Spatially normalised and thresholded probability maps of fifteen 3T volunteers including three and five language tasks, overlaid onto a standard MNI152 brain including the classical left hemisphere LA mask.
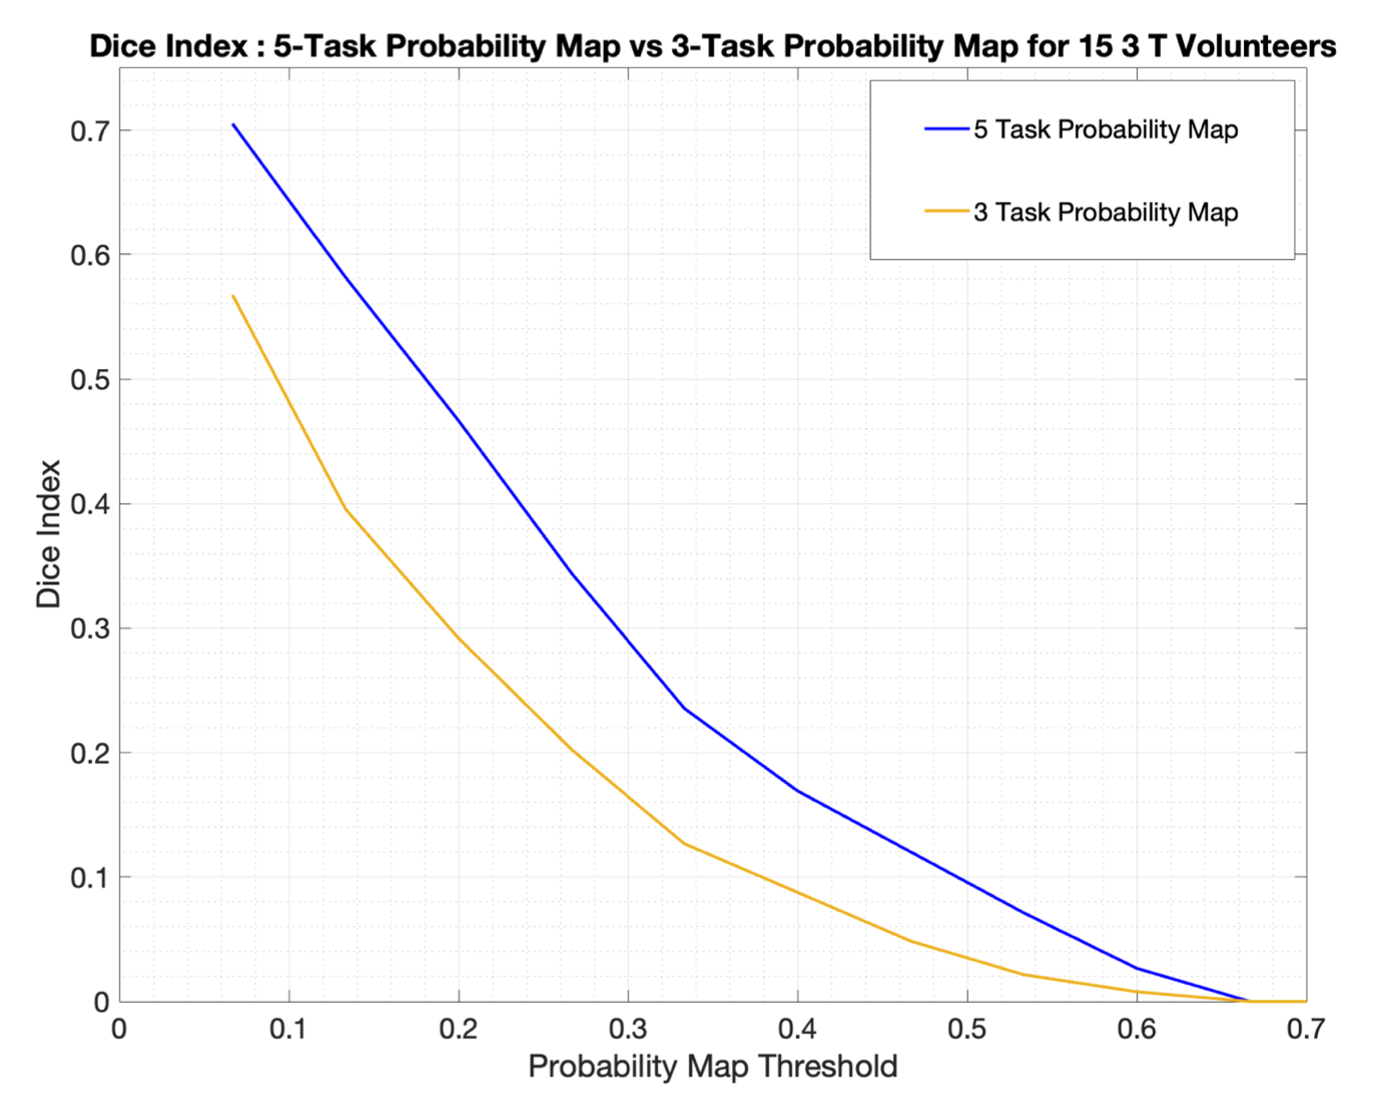
Fig. 5. Dice Index calculated for activation maps produced with three tasks vs a map containing five tasks. The per-subject t-maps were normalised to the peak t-value in left LA area for both registrations, and DIs were calculated within the left LA mask.