3833
Interval Changes in 4D Flow-Derived Hemodynamic Parameters Stratify Type B Aortic Dissection Patients and Correlate with 2D Through-Plane Flow1Radiology, Northwestern University, Chicago, IL, United States, 2Biomedical Engineering, Northwestern University, Chicago, IL, United States, 3Cardiac Surgery, Northwestern Medicine, Chicago, IL, United States, 4Vascular Surgery, Northwestern Medicine, Chicago, IL, United States
Synopsis
Keywords: Vessels, Velocity & Flow, Aortic Dissection, 4D Flow
We investigated whether changes in 4D flow-derived hemodynamic parameters stratified type B aortic dissection patients and sought to validate a 4D flow-derived 2D planar false lumen flow method. Patient scans with baseline and follow-up 4D flow at least 120 days apart were manually segmented into true and false lumens. Voxel-wise parametric maps and 2D forward and reverse flow in the descending aorta were calculated. Changes in voxel-wise hemodynamic parameters significantly correlated with aortic growth rate, with changes in false lumen reverse flow as the most robust parameter. 2D planar flow correlated with voxel-wise flow, but not aortic growth.Introduction
Aortic diameter growth is associated with increased morbidity and mortality in patients with both de novo type B aortic dissection (dnTBAD) and residual type B dissection after type A dissection repair (rTBAD)1. Preemptive surgical intervention in chronic TBAD has shown improvements in outcomes, however, it remains unclear which subgroups of patients benefit most from early intervention2. Current imaging-based risk stratification is limited to evaluation of baseline aortic diameter on conventional images and growth in orthogonal aortic diameter over time. Assessment of true and false lumen (TL, FL) hemodynamics using 4D flow MRI (4DF) may better capture the drivers of adverse outcomes in TBAD3. 2D planar analysis of flow in the FL using 2D phase contrast through-plane images has also provided prognostic value in chronic TBAD4. In this study, we hypothesize that changes in 4DF quantified TL and FL kinetic energy (KE), maximum velocity (MV), forward and reverse flow (FF, RF) over serial imaging correlate with aortic growth. We also sought to validate a 4DF derived 2D planar method for FF and RF in the FL against 4DF volumetric flow parameters in the FL.Methods
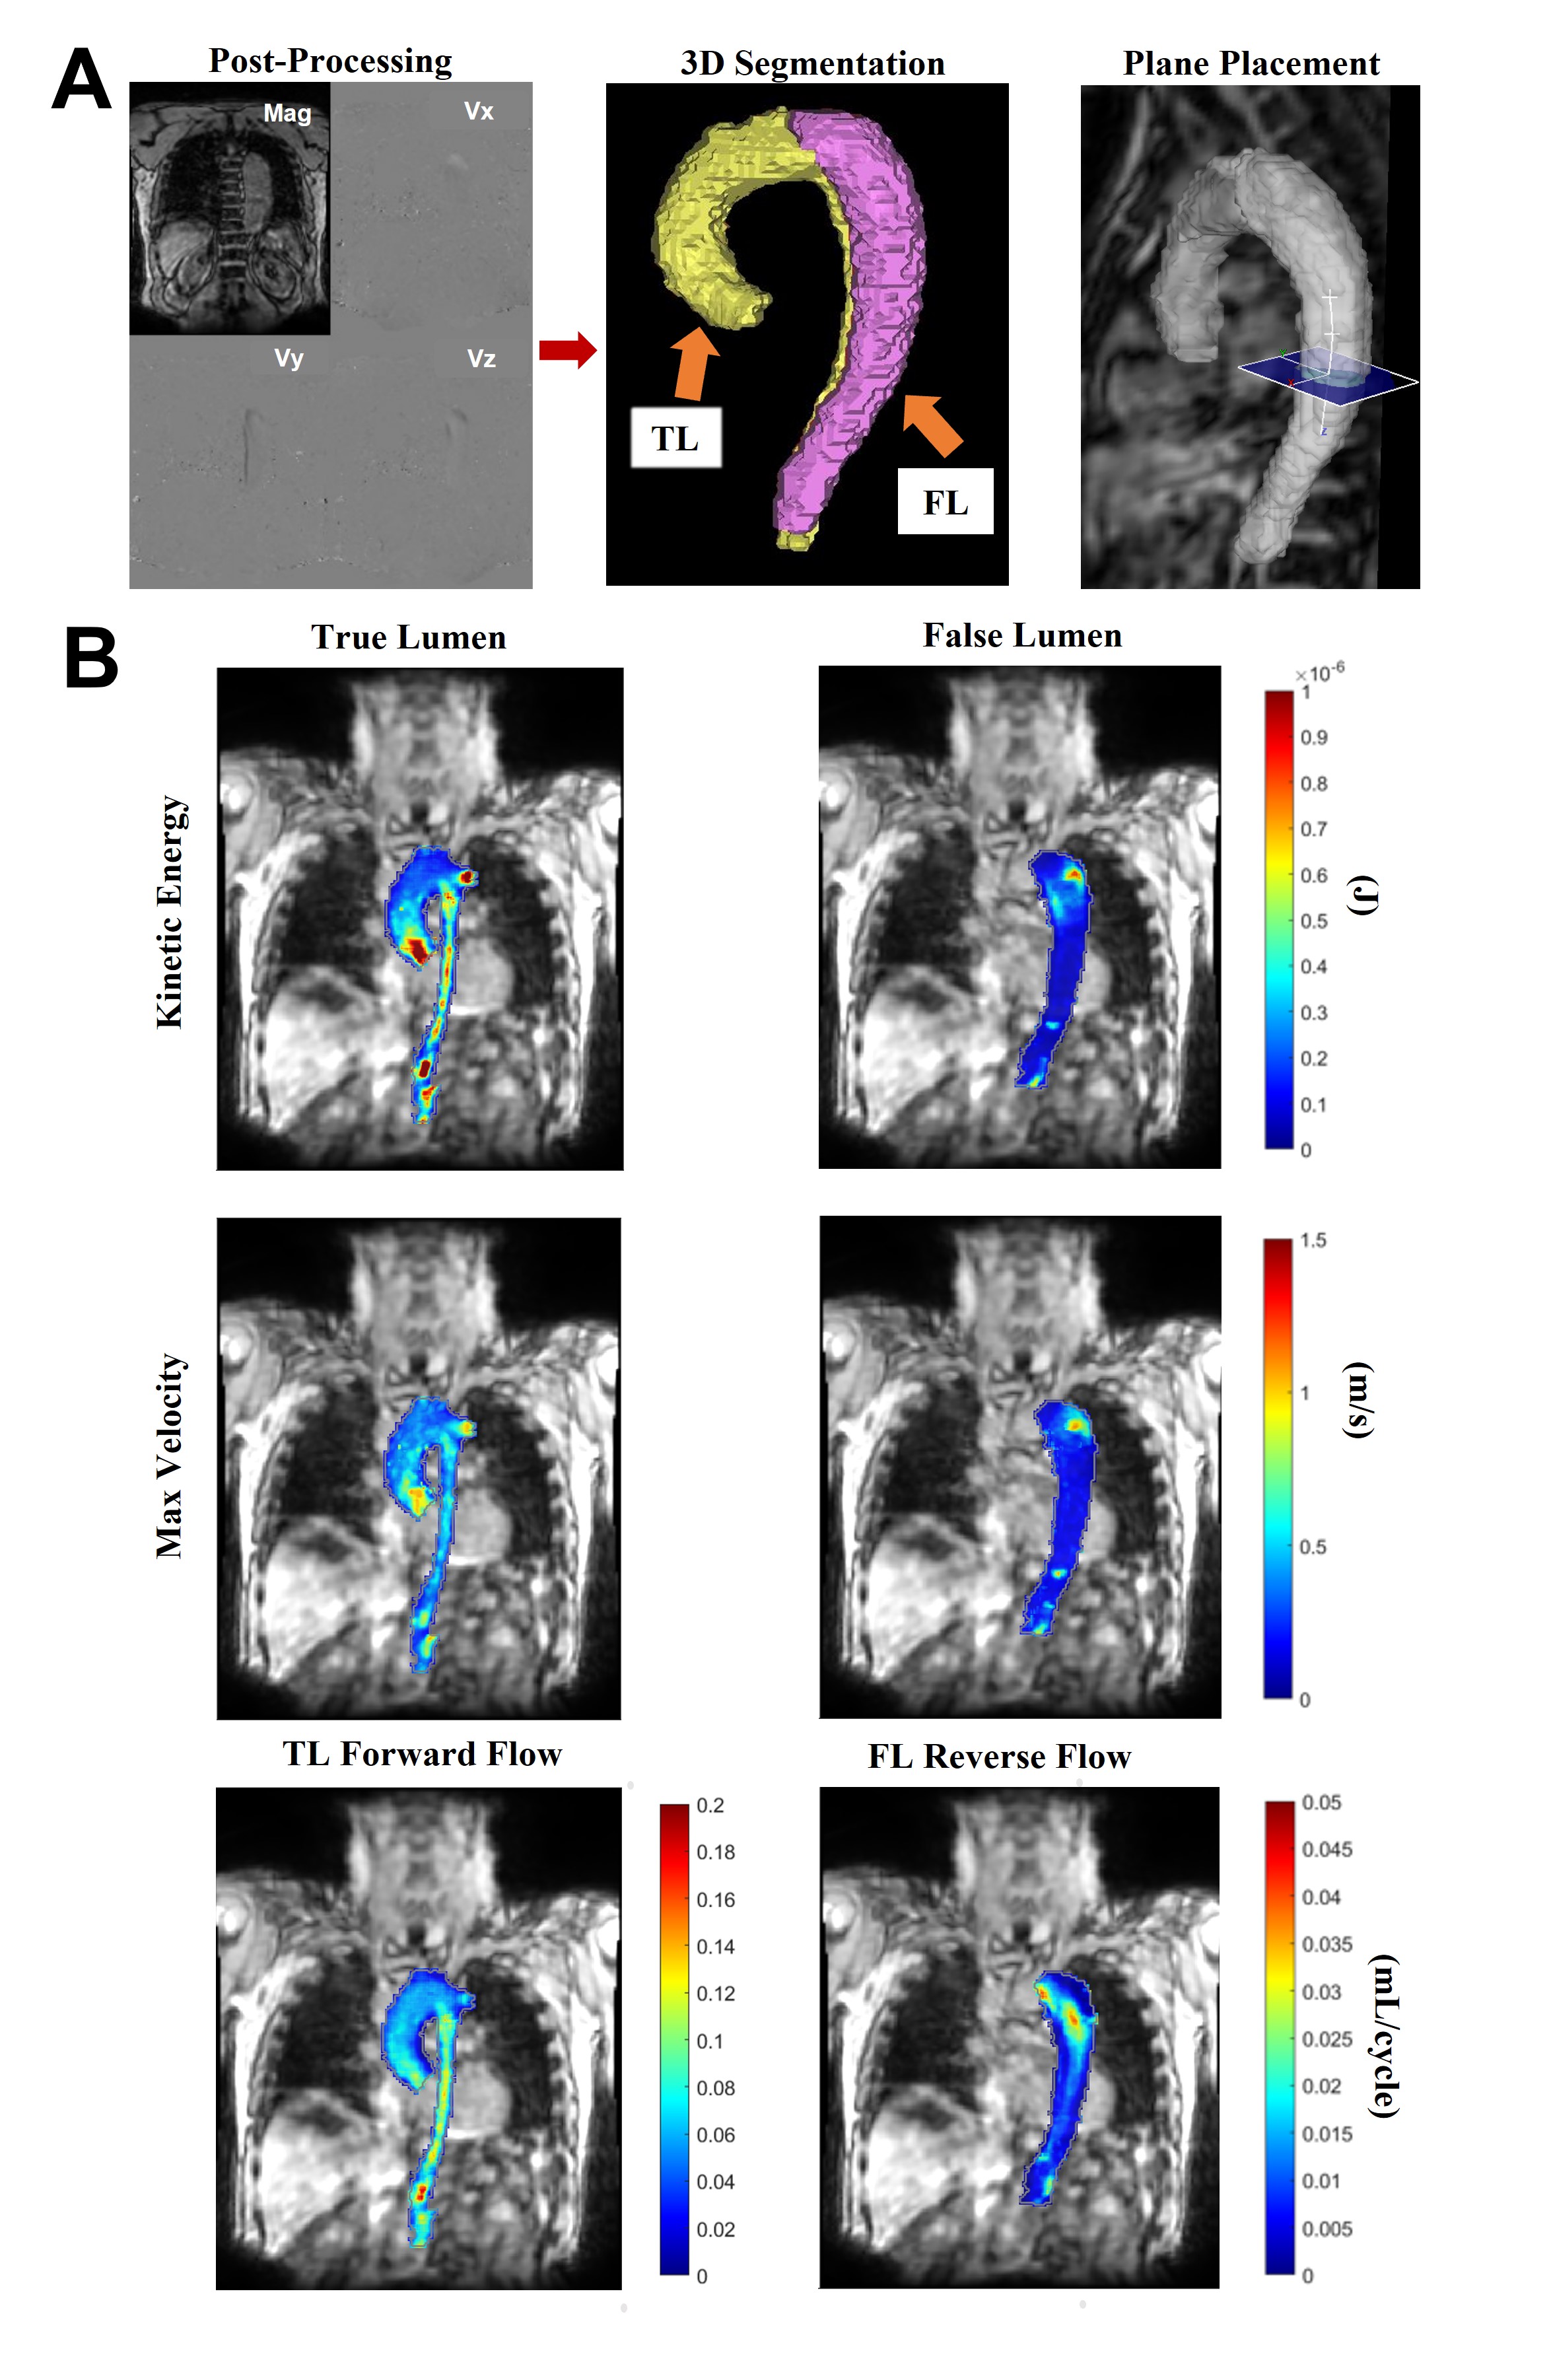
We retrospectively identified TBAD patients with baseline and follow-up 4DF at least 120 days apart. Patients with descending aorta intervention before the baseline scan or between scans were excluded. The TL and FL were manually segmented for each scan and voxel-wise total KE, MV, FF, and RF were calculated using an in-house Matlab tool5 (MATLAB; The MathWorks, Natick, MA) (Figure 1). KE was summed over the cardiac cycle and luminal volume. FF and RF were summed over the cardiac cycle then averaged over luminal volume. 4DF data sets included prospective and retrospective ECG gating. To account for the effect of partial coverage of cardiac cycle by prospective gating, analysis was only performed on the percentage of the cardiac cycle captured by all scans (67.3%). Aortic diameter was measured from MRA images acquired at the time of 4DF. For the 2D planar validation, an oblique transverse plane orthogonal to the descending aorta at the level of the inferior pulmonary veins was placed across the aortic segmentation4 (EnSight; Ansys, USA). Through-plane forward and reverse flow was summed over the cardiac cycle. Pearson correlations were performed between aortic growth rate and parameter changes over time, and between volumetric and 2D planar flow.Results
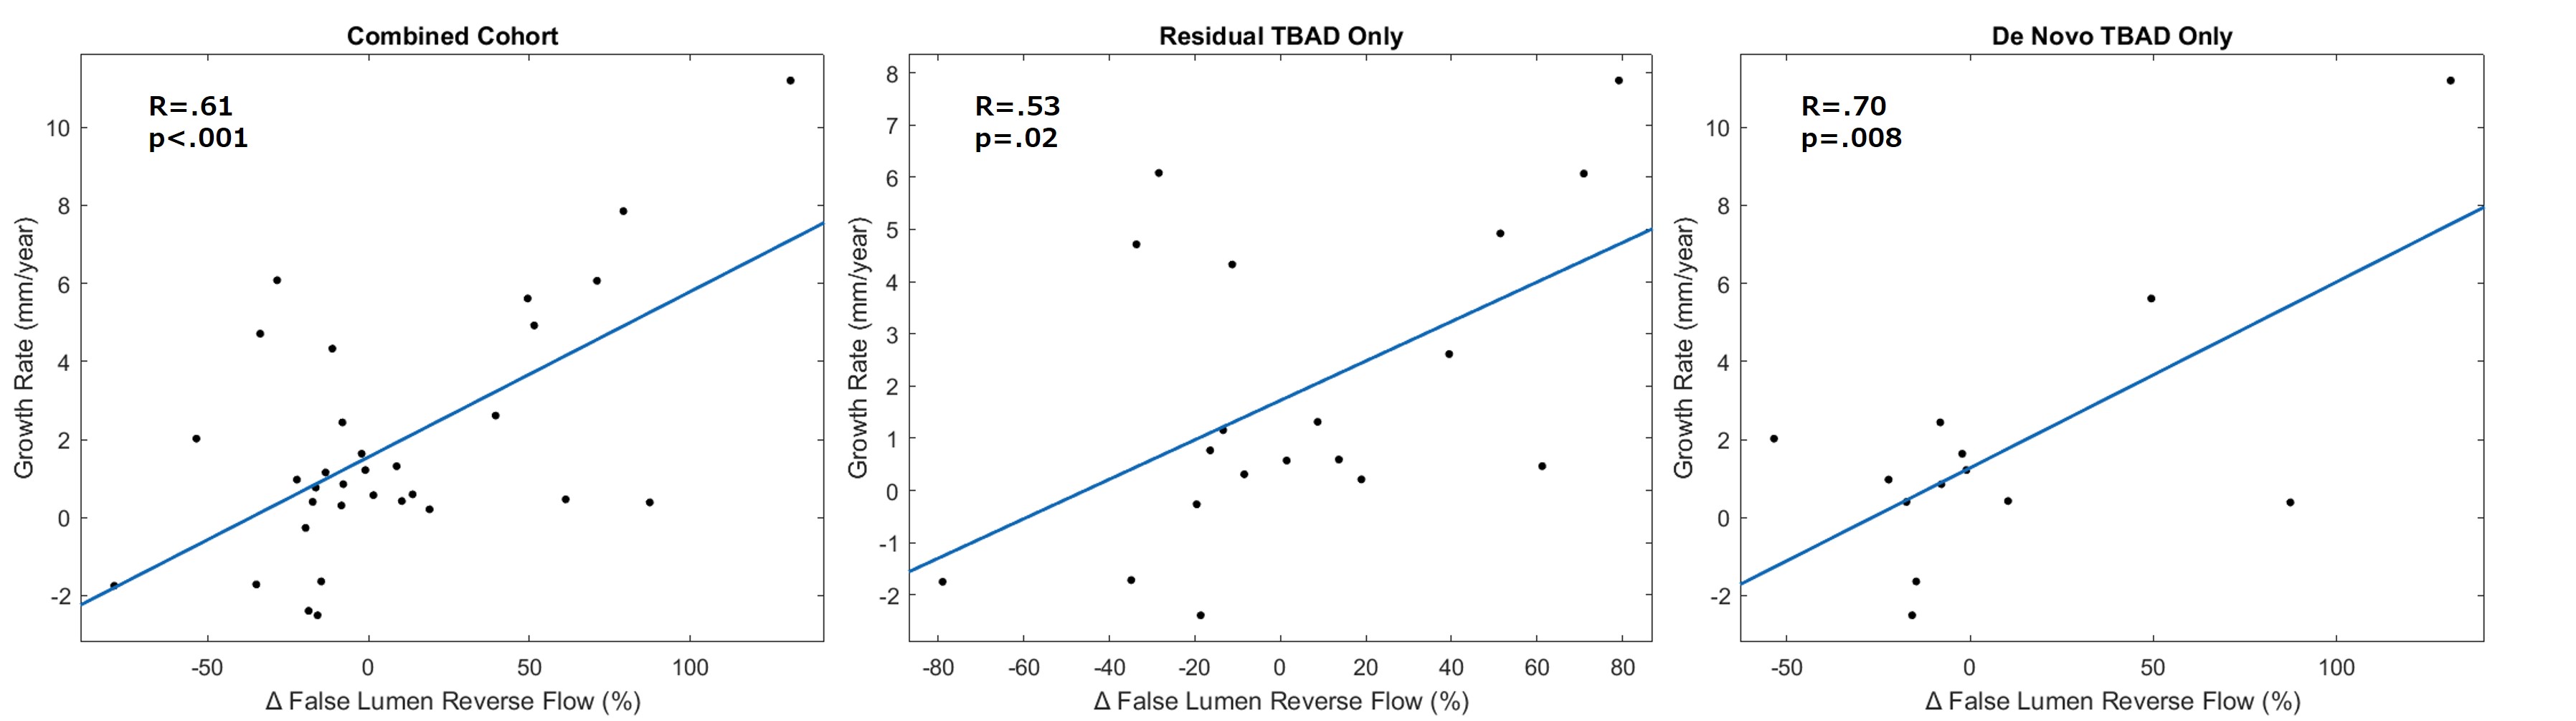
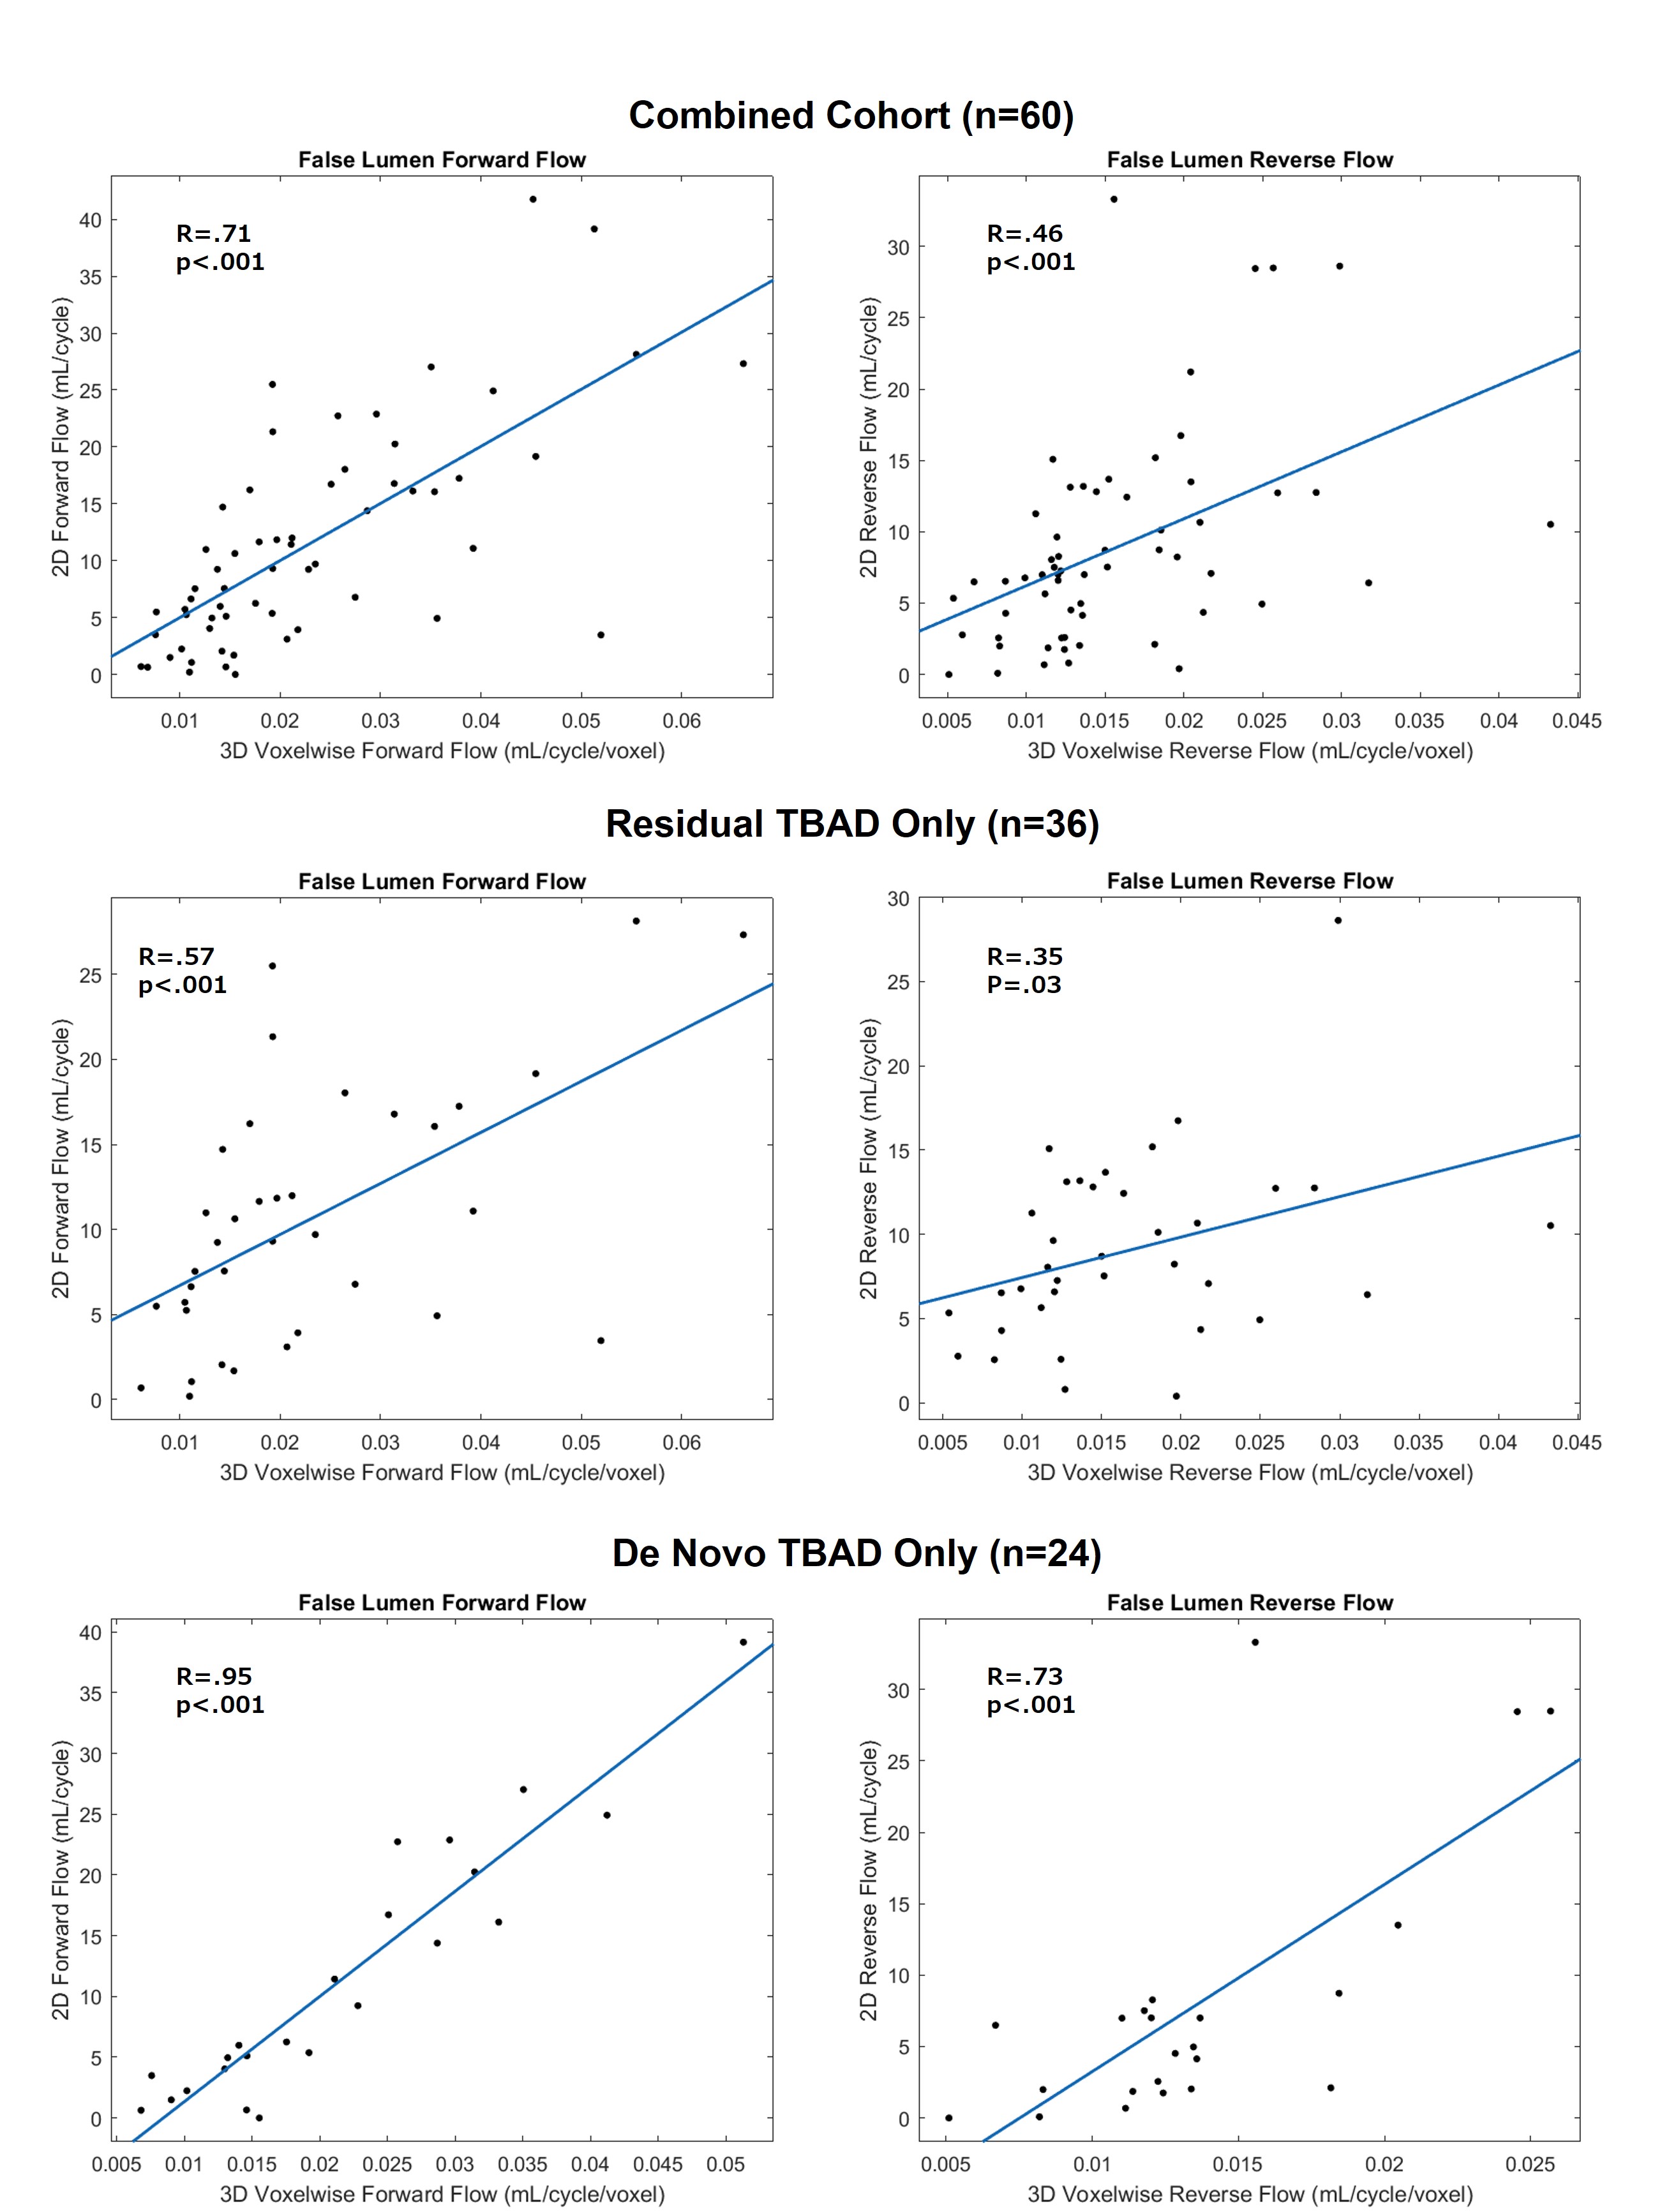
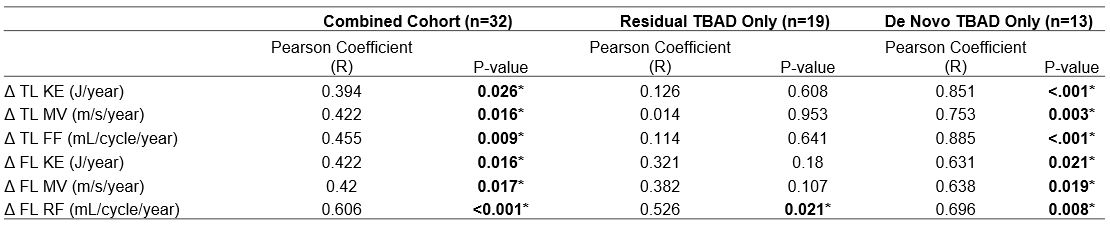
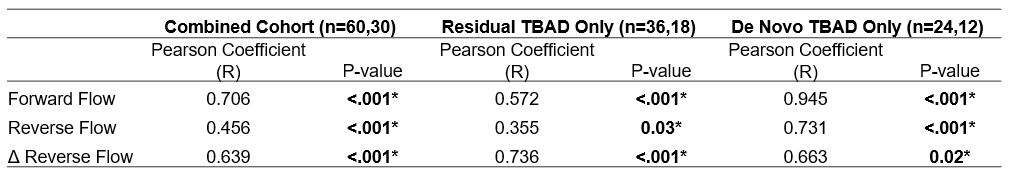
32 patients met inclusion criteria (age: 56.9±14.1 years, Female: 13, n=19 rTBAD, n=13 dnTBAD (8 chronic, 5 acute at baseline). Mean follow up time was 538.3±470.7 days. Baseline diameter did not correlate with growth rate. In the entire cohort, Δ TL KE (r=0.39, p=0.025), Δ TL MV (r=0.42, p=0.02), Δ TL FF (r=0.45, p=0.009), Δ FL KE (r=0.42, p=0.02), Δ FL MV (r=0.42, p=0.02), and Δ FL RF (r=0.61, p<.001) correlated with growth rate. In rTBAD only, Δ FL RF (r=0.53, p=0.02) correlated with growth (Figure 2), while in dnTBAD only, all six correlations remained significant (Table 1).30 patients with baseline and follow-up scans were included in the 2D planar validation. 2 patients were excluded due to FL isolated to the proximal descending aorta. Both baseline and follow-up scans were used (n=60 overall). In the combined cohort, volumetric FF and RF correlated with 2D planar flow (FF: r=0.71, p<.001; RF: r=0.46, p<.001) (Figure 3). In dnTBAD only (n=24) there were higher Pearson correlation coefficients than in rTBAD only (n=36) (dnTBAD- FF: r=0.95, p<.001; RF: r=0.73, p<.001. rTBAD- FF: r=0.57, p<.001; RF: r=0.35, p=0.03). Changes in 2D planar RF also significantly correlated with Δ FL RF in the combined cohort (n=30, r=0.64, p<.001), rTBAD only (n=18, r=0.74, p<.001), and dnTBAD only (n=12, r=0.66, p=0.02) (Table 2). 2D planar RF at baseline did not significantly correlate with aortic growth, nor did changes in 2D RF with aortic growth.
Conclusion
This study suggests that changes in 4DF derived hemodynamic parameters over time correlate with aortic growth rate in TBAD. High energy and high velocity flow in the TL and FL correlate with aortic growth. Moreover, high energy flow and RF in the FL increased with growth, with FL RF as the most robust association across subgroups. These results may be capturing FL pressurization and dynamism as drivers of expansion and are consistent with treatment approaches that reduce flow into the FL as a protective mechanism against aortic growth. Differences in subgroup parametric stratification also suggest dnTBAD and rTBAD are hemodynamically distinct and warrant separate evaluation. Moreover, the 4DF derived 2D planar method significantly correlated with voxel-wise results, supporting the method’s validity. Despite this, 2D planar RF did not correlate with aortic growth, suggesting that 3D hemodynamics are superior for TBAD risk stratification. Potential limitations of the 2D planar method include local differences in FL flow patterns along its course due to reentry tears and thrombus formation and noise affecting slow FL flow. The improvement in Pearson coefficient from overall RF to Δ RF, which partially controls for individual anatomy, may show mitigation of these issues. This study highlights changes in 3D hemodynamics over time as a potential tool in TBAD management and supports the validity of this 2D planar method, even though it did not correlate with aortic growth.Acknowledgements
No acknowledgement found.References
1. Zilber ZA, Boddu A, Malaisrie SC, et al. Noninvasive Morphologic and Hemodynamic Evaluation of Type B Aortic Dissection: State of the Art and Future Perspectives. Radiol Cardiothorac Imaging. 2021;3(3):e200456.
2. Nienaber CA, Kische S, Rousseau H, et al. Endovascular repair of type B aortic dissection: long-term results of the randomized investigation of stent grafts in aortic dissection trial. Circ Cardiovasc Interv. 2013;6(4):407–416.
3. Chu S, Kilinc O, Pradella M, et al. Baseline 4D Flow-Derived in vivo Hemodynamic Parameters Stratify Descending Aortic Dissection Patients with Enlarging Aortas. Front Cardiovasc Med. 2022;9:905718.
4. Evangelista A, Pineda V, Guala A, et al. False Lumen Flow Assessment by Magnetic Resonance Imaging and Long-Term Outcomes in Uncomplicated Aortic Dissection. J Am Coll Cardiol. 2022;79(24):2415-2427.
5. Jarvis K, Pruijssen JT, Son AY, et al. Parametric Hemodynamic 4D Flow MRI Maps for the Characterization of Chronic Thoracic Descending Aortic Dissection. J Magn Reson. Imaging. 2020;51(5):1357-1368.
Figures