3832
Evaluation of diastolic ventricular interdependence using simultaneous left and right heart transvalvular real time phase contrast CMR
Simon Thalén1, Peder Sörensson2, Daniel Giese3, Andreas Sigfridsson1, and Martin Ugander1,4
1Department of Clinical Physiology, Karolinska Institutet and Karolinska University Hospital, Stockholm, Sweden, 2Department of Cardiology, Karolinska Institutet and Karolinska University Hospital, Stockholm, Sweden, 3Siemens Healthineers, Erlangen, Germany, 4Kolling Institute, Royal North Shore Hospital, and Charles Perkins Centre, Sydney, Australia
1Department of Clinical Physiology, Karolinska Institutet and Karolinska University Hospital, Stockholm, Sweden, 2Department of Cardiology, Karolinska Institutet and Karolinska University Hospital, Stockholm, Sweden, 3Siemens Healthineers, Erlangen, Germany, 4Kolling Institute, Royal North Shore Hospital, and Charles Perkins Centre, Sydney, Australia
Synopsis
Keywords: Flow, Velocity & Flow, Ventricular interdependence
Diastolic ventricular interdependence occurs in several clinical settings, most notably pericardial effusion and constrictive pericarditis. It is measured using Doppler echocardiography or invasive cardiac catheterization where the respiratory variation in velocity or pressure is measured. In pericardial effusion it is an early sign of hemodynamic significance which is not always correlated to the volume of effusion. In constrictive pericarditis, it is used to separate constrictive and restrictive physiologies. In this study a method to measure diastolic ventricular interdependence by simultaneously quantifying the respiratory variation in mitral and tricuspid early inflow velocities using real time phase contrast CMR is presented.Background
Diastolic ventricular interdependence occurs when an increased pressure gradient between the atrium and ventricle in one side of the heart causes a decreased pressure gradient between the atrium and ventricle on the other side of the heart. This occurs during normal respiration, as negative intrapleural pressures during inspiration increase the venous return and rate of filling of the right heart, thus decreasing the rate of filling of the left heart. During expiration the opposite occurs. Ventricular interdependence is measured using Doppler echocardiography or invasive cardiac catheterization where the respiratory variation in velocity or pressure is measured. Increased ventricular interdependence can occur in several clinical settings, most notably pericardial effusion and constrictive pericarditis. In pericardial effusion, diastolic ventricular interdependence is an early sign of hemodynamic significance of the effusion which is not always correlated to the volume of effusion. In constrictive pericarditis, an increased diastolic ventricular interdependence is a valuable tool in separating constrictive and restrictive physiologies. The aim of this study was to develop a method to measure diastolic ventricular interdependence by simultaneously quantifying the respiratory variation in mitral and tricuspid early inflow velocities using semi-automatic analysis of real time phase contrast (RT-PC) CMR images.Methods
Clinically referred patients (n=21, age 58±19 years, 56% male) with no pericardial effusion or pericardial thickening underwent through-plane RT-PC CMR imaging using a research sequence at 3T (MAGNETOM Skyra, Siemens Healthcare, Erlangen, Germany) in a basal short-axis view over a 30 s acquisition during free breathing. Image acquisition parameters were: TR 3.7 ms, water excitation pulse with flip angle 10°, slice thickness 8 mm, FOV 360x266 mm2, matrix 208x135, velocity encoding (VENC) 150 cm/s and shared velocity encoding enabled. Compressed sensing with an acceleration factor of 7.7 was used to achieve a temporal resolution of 48 ms. Additionally, one patient with constrictive pericarditis and one patient with a hemodynamically significant pericardial effusion were imaged to illustrate clinical feasibility. Image analysis was performed using an in-house developed plugin to freely available software (Segment, Medviso AB, Lund, Sweden). The user manually delineated a region of interest encompassing the mitral and tricuspid orifices, respectively (Figure 1). The peak left ventricular outflow, calculated as the negative mitral flow component through the image plane, marked the middle of systole, and was used to automatically segment the data into individual cardiac cycles. The peak early velocity of each cardiac cycle was identified as the first peak with a velocity above the mean + one standard deviation of the velocity in that timeframe. The highest (Vmax) and lowest (Vmin) peak early inflow velocities were recorded. The respiratory variation was defined as (Vmax-Vmin)/Vmax and calculated. A spectral plot (first two rows in Figure 2 A, B and C) of all velocities with peak early velocities indicated and a plot of M-mode signal intensities (last row in Figure 2 A, B and C) over the lung-diaphragm interface was displayed. This allowed for visualization of breathing and for the user to ensure that each reported peak occurred during inspiration or expiration respectively.Results
The respiratory variation in mitral and tricuspid early inflow velocity in patients without constrictive pericarditis or pericardial effusion was (mean±SD) 22±7% (upper limit 36%) and 38±7% (upper limit 52%). The patient with constrictive pericarditis had a respiratory variation in mitral and tricuspid early inflow velocities of 60% and 44%, respectively. The patient with 35 mm pericardial effusion had a respiratory variation in mitral and tricuspid early inflow velocities of 62% and 64%, respectively.Conclusion
This study demonstrates the feasibility in evaluation of diastolic ventricular interdependence by the proposed semi-automatic analysis of respiratory variation in early mitral and tricuspid inflow velocity using RT-PC CMR.Acknowledgements
No acknowledgement found.References
No reference found.Figures
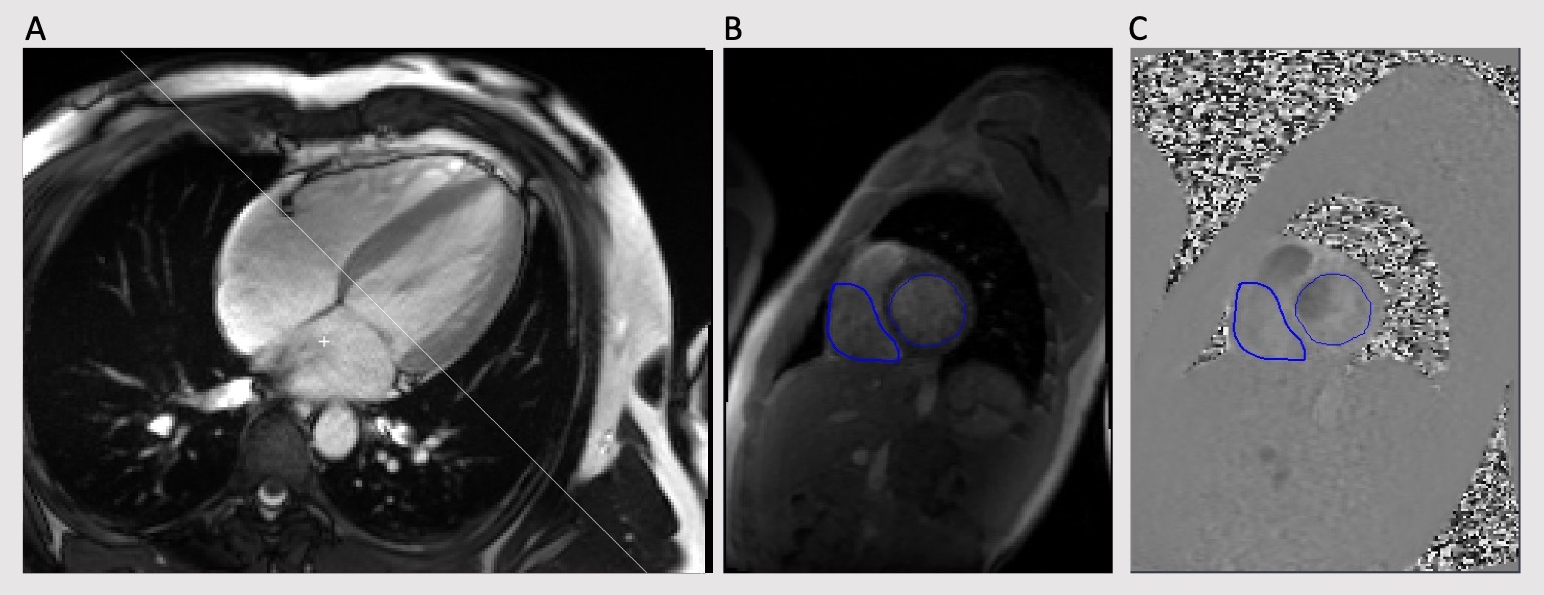
Figure 1. A four
chamber long-axis cine acquisition in end systole that shows how the plane for
through-plane RT-PC imaging was prescribed (A). Regions of interest for the
mitral and tricuspid valves are shown in magnitude and phase images (B and C).
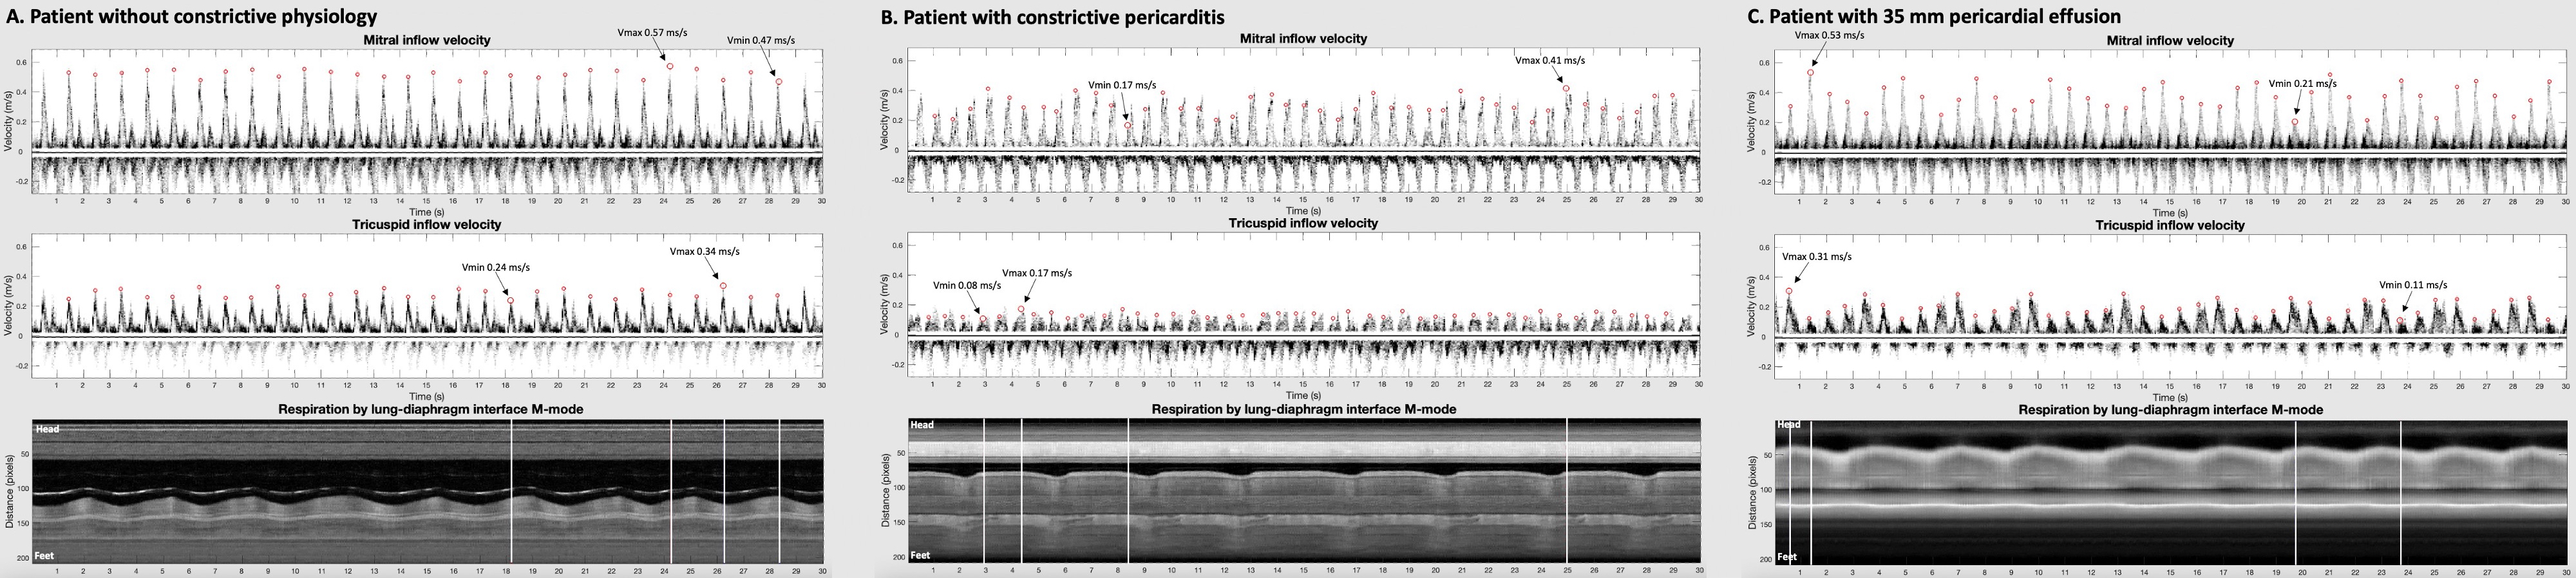
Figure 2. Mitral and tricuspid RT-PC
velocity data as analysed by the software plugin. The upper panels show
spectral plots of all velocities with peak early velocities denoted as a red circle.
The highest and lowest peak are indicated. The bottom panel shows M-mode over
the diaphragm to visualize breathing. Patient A had no constrictive physiology,
mitral and tricuspid variations of 18% and 30%. Patient B had constrictive pericarditis,
mitral and tricuspid variations of 60% and 44%. Patient C had a 35 mm
pericardial effusion, mitral and tricuspid variations of 62% and 64%.
DOI: https://doi.org/10.58530/2023/3832