3830
Hemodynamic analysis of intracranial aneurysms before and after flow diverter stents implantation based on 4D Flow MRI1Center for Biomedical Imaging Research, Tsinghua University, Beijing, China, 2Changhai Hospital, Shanghai, China
Synopsis
Keywords: Flow, Velocity & Flow, Hemodynamics
Intracranial aneurysm has become an important issue because of the high morbidity and the high mortality rate due to aneurysm rupture. Recently, the flow diverter stent has been considered as an effective device for the treatment of aneurysms by modifying the hemodynamics of the aneurysm. 4D Flow MRI can can offer three-dimensional visualization of blood flow pattern and a comprehensive analysis of hemodynamics. In this study, we calculated and analyzed the hemodynamics in aneurysm hemodynamics before and after the implantation of flow diverter stents based on 4D Flow MRI.Introduction
Aneurysm is a bulge in the wall of a blood vessel caused by an abnormal change in the local blood vessels, which often occur in the intracranial and carotid vessels. Intracranial aneurysms have a relatively high probability of occurrence in the general population. For example, the prevalence of the Unruptured intracranial aneurysms (UIAs) in the adult generation is 3%. Intracranial aneurysm has been an important issue because of the high morbidity and the high mortality rate due to aneurysm rupture1. Recently, flow diverter stent has become an effective device for treating aneurysms. In general, flow diverter stent induces thrombosis by changing the hemodynamics in the aneurysm, thereby promoting aneurysm healing. Hemodynamics variation is one of the most important factors in flow diverter stents implantation for aneurysms treatment. Therefore a more accurate assessment of the hemodynamics and a better evaluation of the flow pattern are crucial for studies concerning flow diverter stents implantation for treatment of aneurysms. The three-directional velocity-encoded phase contrast magnetic resonance imaging (termed ‘4D Flow MRI’) can offer three-dimensional visualization of blood flow pattern and enable a comprehensive analysis of hemodynamics2. This study aimed to calculate and analyze the hemodynamics of aneurysm hemodynamics before and after implantation of the flow diverter stent based on 4D Flow MRI.Methods
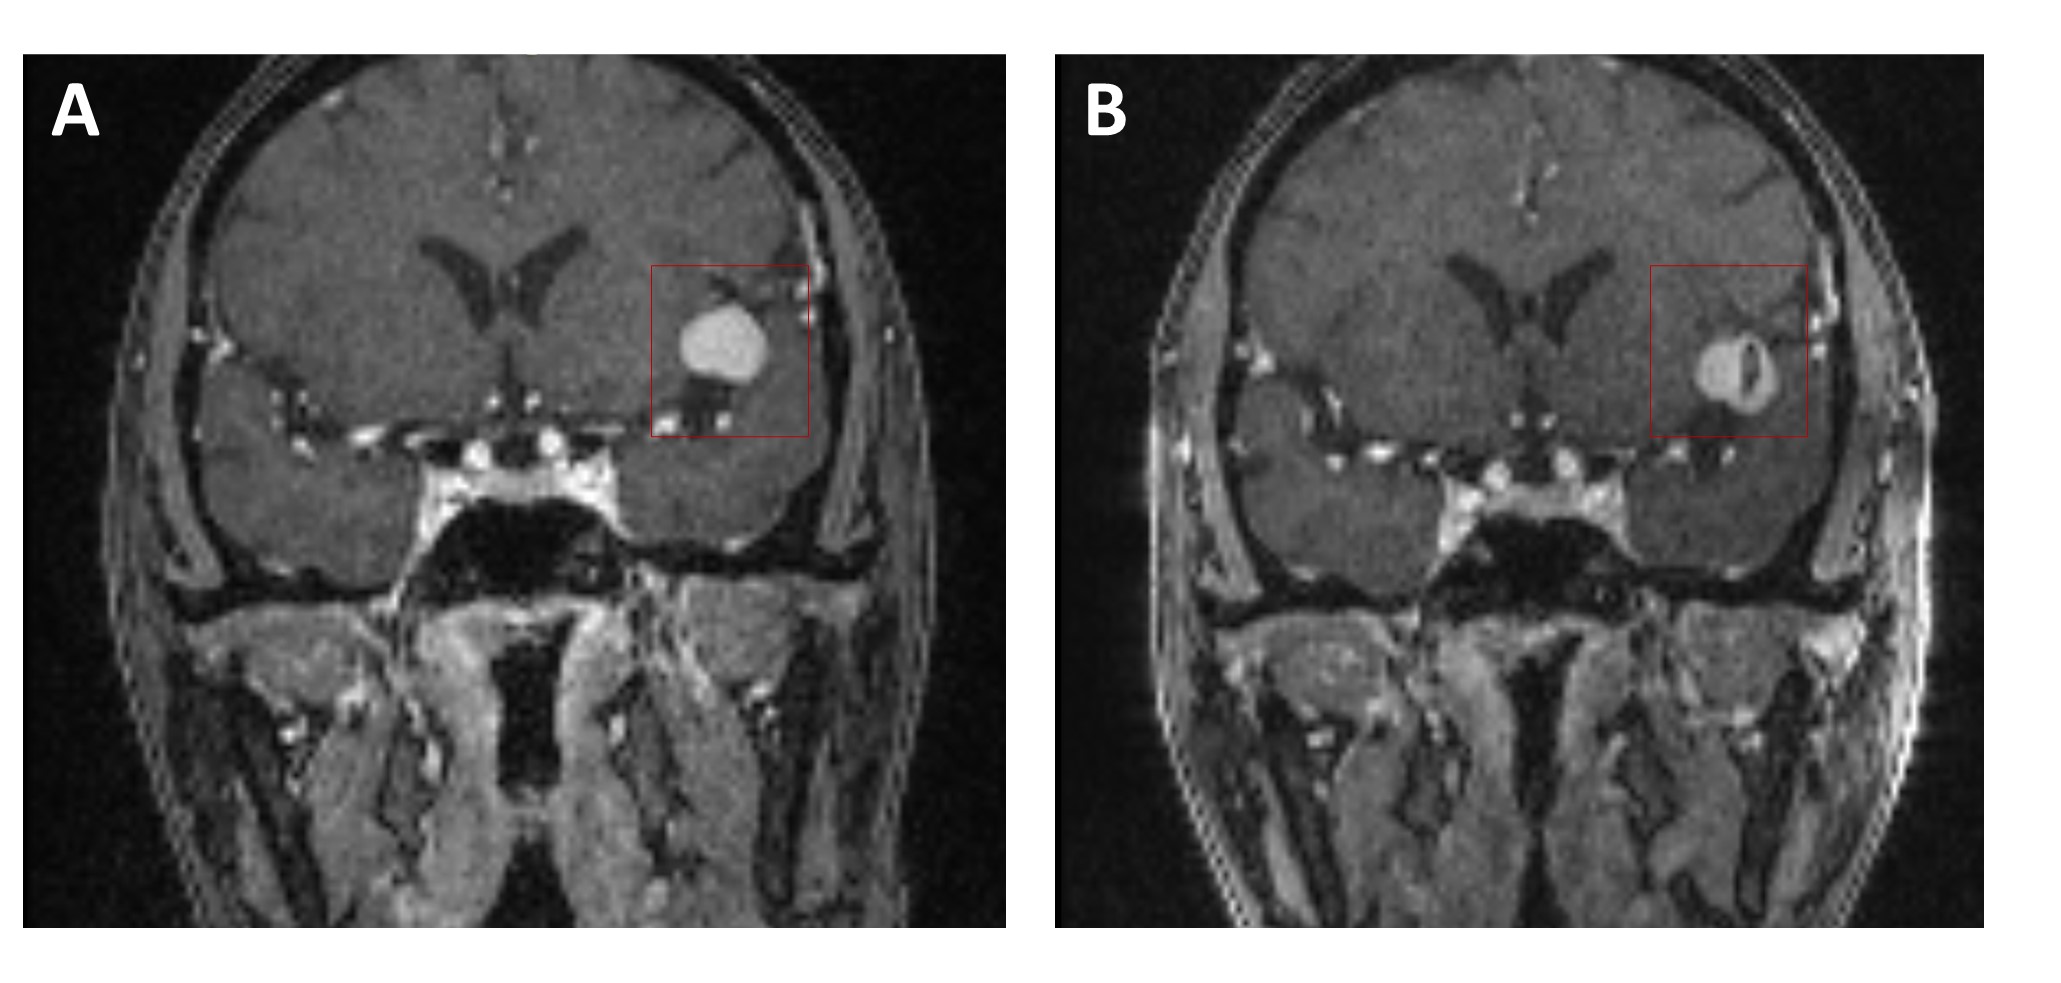
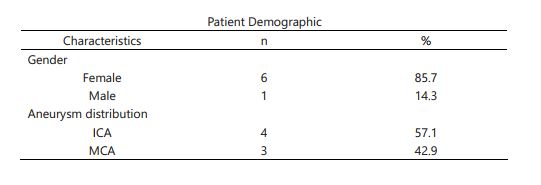
Patient inclusion criteriaThe 4D Flow MRI images were collected from nine patients with aneurysms receiving flow diverter stents implantation at Changhai Hospital (Shanghai, China). One patient with giant aneurysm on left internal carotid artery (ICA) and one patient with giant aneurysm on middle cerebral artery (MCA) were excluded because the blood flow patterns were too complex to analyze. In our study, seven patients (mean age, 55 ± 10.5 years; 1 male) were included (Table 1). Informed consent was obtained from all the patients. The dataset example was shown in Figure 1.
MRI acquisition
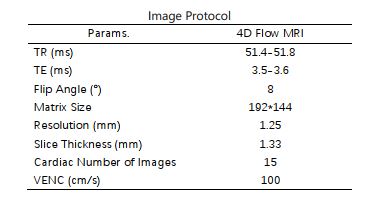
All scans were performed at 3T Siemens Skyra. Each patient received two scans and 4D Flow MRI images were obtained within three days before and after the flow diverter stents implantation procedure. The image protocol was also shown in Table 2.
3D Blood Flow Visualization and Hemodynamics Quantification
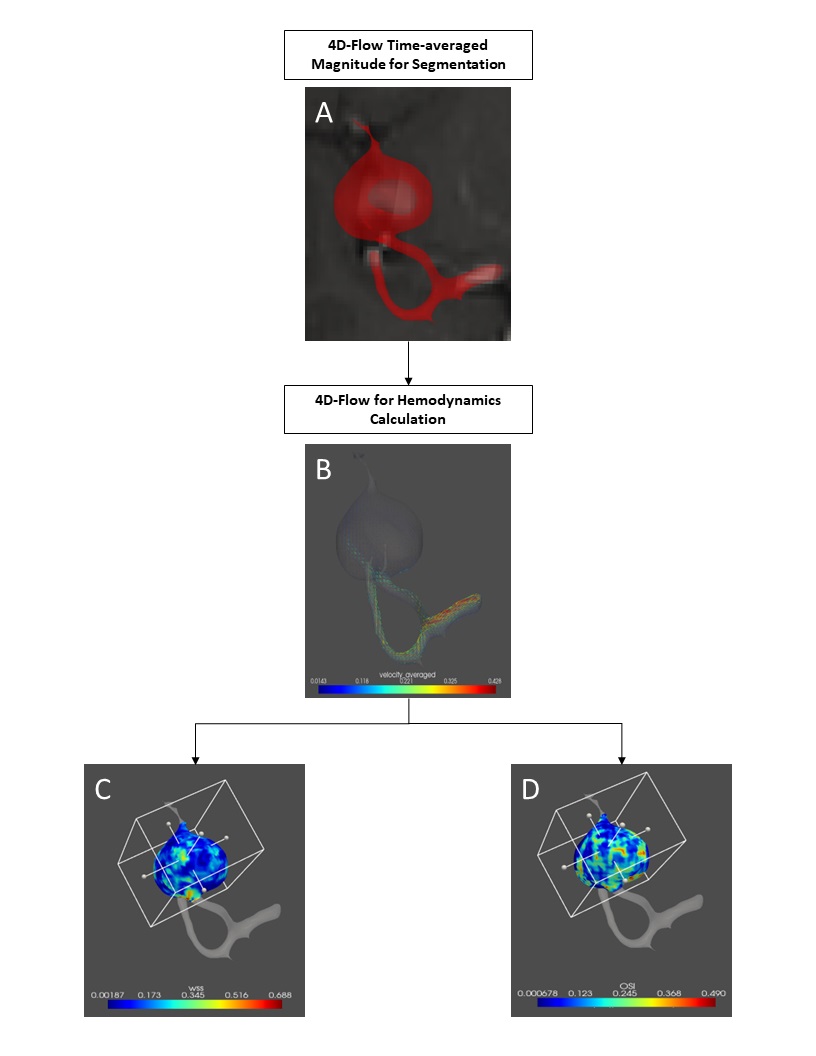
In our study, we used Fu's workflow3 to 3D visualize the blood flow in aneurysms and calculate the hemodynamics. First, we segmented and obtained a 3D vascular model based on 4D Flow Time-averaged Magnitude. Then we manually selected the part of the aneurysm and calculated the flow velocities, wall shear stress (WSS) and oscillatory shear index (OSI). The workflow was shown in Figure 2.
Results
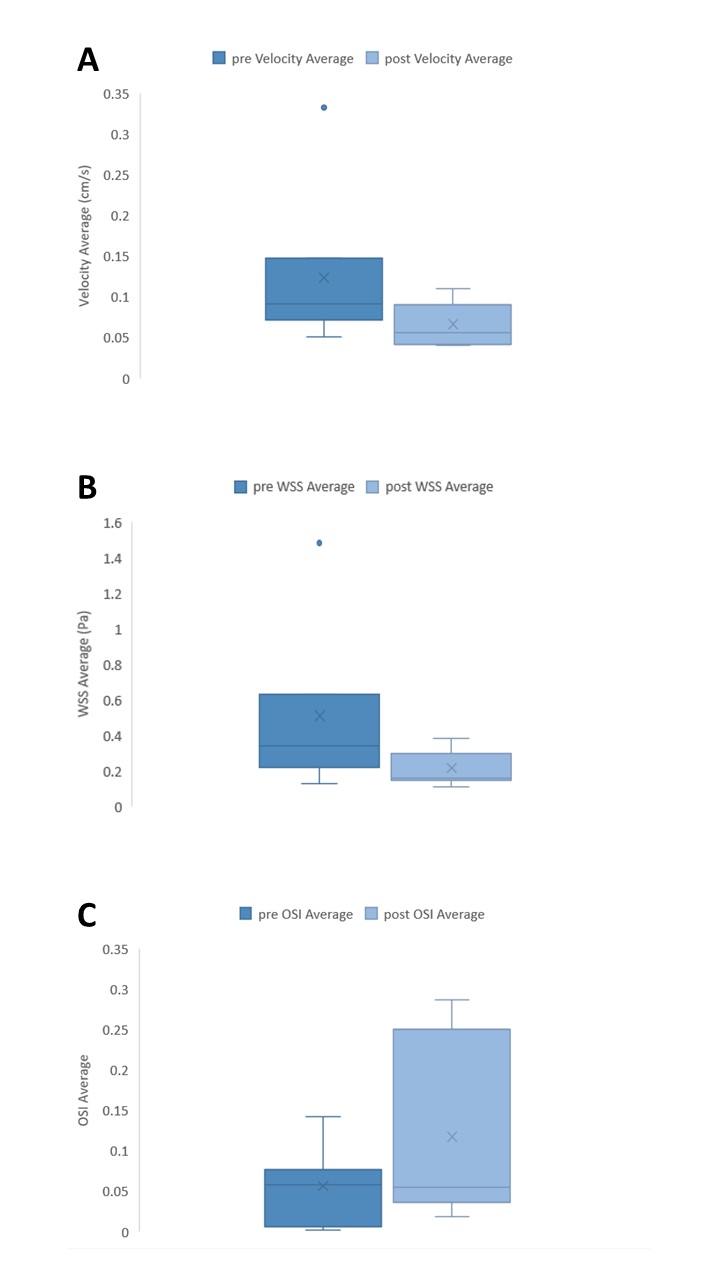
By analyzing the data, we finally obtained the blood flow velocities, WSS and OSI in the aneurysms before and after surgery. The results of flow velocity average(mean value before surgery, 0.13 ± 0.09 cm/s; mean value after surgery, 0.07 ± 0.02 cm/s), WSS average (mean value before surgery, 0.52 ± 0.42 Pa; mean value after surgery, 0.23 ± 0.09 Pa) and OSI average (mean value before surgery, 0.06 ± 0.04, mean value after surgery, 0.10 ± 0.10) were shown in Figure 3. In our analysis results, the values of flow velocity average and WSS average showed overall decreasing trends, and the values of OSI average showed overall increasing trend.Discussion and conclusion
The trends of the hemodynamic parameters in this experiment were consistent with previous studies investigating the effect of inflow stents on hemodynamics4. However, none of the changes in hemodynamic parameters in this experiment were significant probably due to the limitation of the amount of study subjects. In the future, we will include more patients and take more hemodynamic parameters into account to further investigate the hemodynamic variations of intracranial aneurysms before and after flow diverter stent implantation based on 4D Flow MRI. Moreover, we will attempt to predict the healing of aneurysms after flow diverter stent implantation based on hemodynamics. As an exploratory experiment, our study demonstrated that 4D Flow MRI could be used as a tool to assess the hemodynamics before and after flow diverter stent implantation procedure. Moreover, the use of 4D Flow MRI provided relatively reliable results of hemodynamic parameters.Acknowledgements
We are grateful to Changhai Hospital for providing 4D Flow MRI images of the patients for this study.References
[1] Etminan N, Rinkel GJ. Unruptured intracranial aneurysms: development, rupture and preventive management. Nat Rev Neurol. 2016 Dec;12(12):699-713.
[2] Markl M, Frydrychowicz A, Kozerke S, Hope M, Wieben O. 4D flow MRI. J Magn Reson Imaging. 2012 Nov;36(5):1015-36.
[3] Fu M, Peng F, Zhang M, Chen S, Niu H, He X, Xu B, Liu A, Li R. Aneurysmal wall enhancement and hemodynamics: pixel-level correlation between spatial distribution. Quant Imaging Med Surg 2022.
[4] Wang C, Tian Z, Liu J, Jing L, Paliwal N, Wang S, Zhang Y, Xiang J, Siddiqui AH, Meng H, Yang X. Flow diverter effect of LVIS stent on cerebral aneurysm hemodynamics: a comparison with Enterprise stents and the Pipeline device. J Transl Med. 2016 Jul 2;14(1):199.
Figures