3828
Assessment of Altered Hemodynamics in Patients with Hypertrophic Obstructive Cardiomyopathy using 4D Flow MRI1Department of Radiology, Tongji Hospital, Tongji Medical College, Huazhong University of Science and Technology, Wuhan, China, 2MR Collaboration, Siemens Healthineers Ltd, Shanghai, China
Synopsis
Keywords: Flow, Blood, 4D flow MRI; Hemodynamics; Energy loss; Hypertrophic Obstructive Cardiomyopathy;
Hypertrophic Obstructive Cardiomyopathy (HOCM) is characterized by dynamic obstruction of blood flow in the left ventricular outflow tract. 4D flow MRI can be used for comprehensive evaluation of cardiac and aortic hemodynamics by visualization of the complex spiral LVOT 3D blood flow patterns. This study used 4D flow MRI to evaluate the degree of LVOT obstruction and the flow energy loss in patients with HOCM. The results showed that spiral flow and viscous energy loss were associated with the LVOT pressure gradient, and played a role in structural remodeling of the left ventricle.Introduction
Hypertrophic obstructive cardiomyopathy (HOCM) is one of main causes of sudden cardiac death (SCD) and progressive heart failure because of increased pressure gradient in the left ventricular outflow tract (LVOT) [1]. Doppler ultrasound is commonly used to assess the degree of LVOT obstruction. However, Doppler ultrasound is operator-dependent and estimates flow rate and pressure gradient only in a standard 2D plane. Four-dimensional (4D) flow MRI is a non-invasive modality that can be used for dynamic 3D visualization of blood flow velocity patterns along 3 spatial directions and evaluate hemodynamics in the LVOT and the aortic root [2]. This study investigated pathological hemodynamic changes in the aorta of patients with HOCM using 4D flow MRI.Methods
Study cohortTwenty-one patients with HOCM (13 males; 44.7±3.7 years old) were consecutively enrolled for cardiac MRI examinations between July 2022 and October 2022. Informed consent was obtained from all patients in this prospective study. Cardiac MRI scanning protocol All the participants underwent CMRI examinations on a MAGNETOM Skyra 3T MRI scanner (Siemens Healthineers, Germany). The 4D flow MRI was acquired during free breathing using prospective electrocardiography gating. The 4D flow MRI sequence parameters were as follows: echo time, 2.61 ms; flip angle, 12°; VENC, 150 to 300 cm/s (depending on the maximal velocity of LVOT); field of view, 400mm×241mm; matrix size, 192×165; voxel size, 2.1×2.1×2.1mm; temporal resolution, 36.96 ms.
MRI data analysis
Two cardiovascular radiologists performed vessel segmentation and hemodynamic parameter analysis using the CVI 42 software (version 5.14.0, Circle Cardiovascular Imaging Inc., Canada). The peak velocity was measured in multiple continuous planes of LVOT. The measurement planes were placed perpendicular to the long axis of the aorta and the regions of interest were drawn to measure maximum energy loss (ELmax) and average energy loss (ELave). The 3 segmentations included in kinetic energy analysis of blood flow were as follows: (1) energy loss from the LVOT to the aortic root; (2) energy loss from the LVOT to the origin of the first brachiocephalic branch; and (3) energy loss from the LVOT to the mid descending aorta at the level of the aortic root.
Statistical analysis
Statistical analysis was performed using the SPSS statistical software (version 25.0, IBM SPSS Inc., Chicago, IL). The differences in flow velocities between ultrasound and 4D flow MRI measurements were analyzed by the Wilcoxon Mann-Whitney test. Spearman correlation analysis was performed to determine the relationship between pressure gradient and energy loss in different planes. P<0.05 was considered statistically significant.
Results
The peak velocity estimates from the Doppler ultrasound for LVOT were higher than those measured by 4D flow MRI (4.0±1.9 m/s vs. 2.1±0.9 m/s, p<0.001). Peak velocity at the obstruction site was underestimated by 4D flow MRI but showed significant association with the LVOT gradient (LVOTG) (Spearman coefficient rs=0.683, p<0.001). The viscous energy losses in all the three planes showed strong correlation with the LVOTG (Figures 3, respectively; P<0.05 for all). The comparison of ELmax and ELave values at the three levels demonstrated strongest correlation between ELave at the level of the aortic root and LVOTG estimates from Doppler ultrasound (rs=0.666, p<0.001). The ascending aorta of the HOCM patients showed substantial loss of viscous energy. The stream-line diagram shows the abnormally increased spiral blood flow above the aortic valve plane (Figures 1 and 2).Discussion
This study demonstrated the potential of 4D flow MRI in accurately estimating abnormal hemodynamics in patients with HOCM. Doppler ultrasound based on the Bernoulli equation does not assess blood pressure recovery after stenosis [3]. Furthermore, the degree of stenosis measured multiple times by Doppler ultrasound vary significantly [4]. The accurate assessment of the aberrant hemodynamics because of obstruction is crucial for clinical decisions regarding the timing for surgery. Our results showed that blood flow velocity and energy loss at specific segments of the aorta were accurately detected by 4D flow MRI. Furthermore, 4D flow MRI provided three-dimensional dynamic assessment of blood flow in the entire ventricle and the aorta. Blood flow energy loss in all the three planes were significantly associated with the LVOT peak pressure gradient. The average loss of viscous energy at the root of the aorta showed the strongest correlation with the pressure gradient. The streamline diagram showed spiral blood flow because of stenosis throughout the aorta, especially in the ascending aorta. A study by van Ooij et al reported integrated 4D flow MRI with T1 mapping to assess the aberrant blood flow in patients with hypertrophic cardiomyopathy and demonstrated association between abnormal LVOT flow, increased LVOT pressure gradient or energy loss, and adverse myocardial remodeling [5]. Therefore, our study demonstrated that 4D flow MRI may be used for assessing abnormal blood flow patterns and the corresponding changes in cardiac structure and function.Conclusions
Spiral flow in the root of the ascending aorta is common in patients with HOCM. This aberrant blood flow causes loss of viscous energy, increased left ventricular workload, and subsequent structural remodeling of the left ventricle. Therefore, 4D flow MRI is a useful method to assess hemodynamic changes in the aorta and the left ventricle in patients with HOCM.Acknowledgements
No acknowledgement found.References
1. Maron, B.J. and M.S. Maron, Hypertrophic cardiomyopathy. The Lancet, 2013. 381(9862): p. 242-255.
2. Soulat, G., P. McCarthy, and M. Markl, 4D Flow with MRI. Annu Rev Biomed Eng, 2020. 22: p. 103-126.
3. Abbas, A.E., et al., Invasive Versus Echocardiographic Evaluation of Transvalvular Gradients Immediately Post-Transcatheter Aortic Valve Replacement. Circ Cardiovasc Interv, 2019. 12(7): p. e007973.
4. Minners, J., et al., Inconsistent grading of aortic valve stenosis by current guidelines: haemodynamic studies in patients with apparently normal left ventricular function. Heart, 2010. 96(18): p. 1463-8.
5. van Ooij, P., et al., 4D flow MRI and T1 -Mapping: Assessment of altered cardiac hemodynamics and extracellular volume fraction in hypertrophic cardiomyopathy. J Magn Reson Imaging, 2016. 43(1): p. 107-14.
Figures
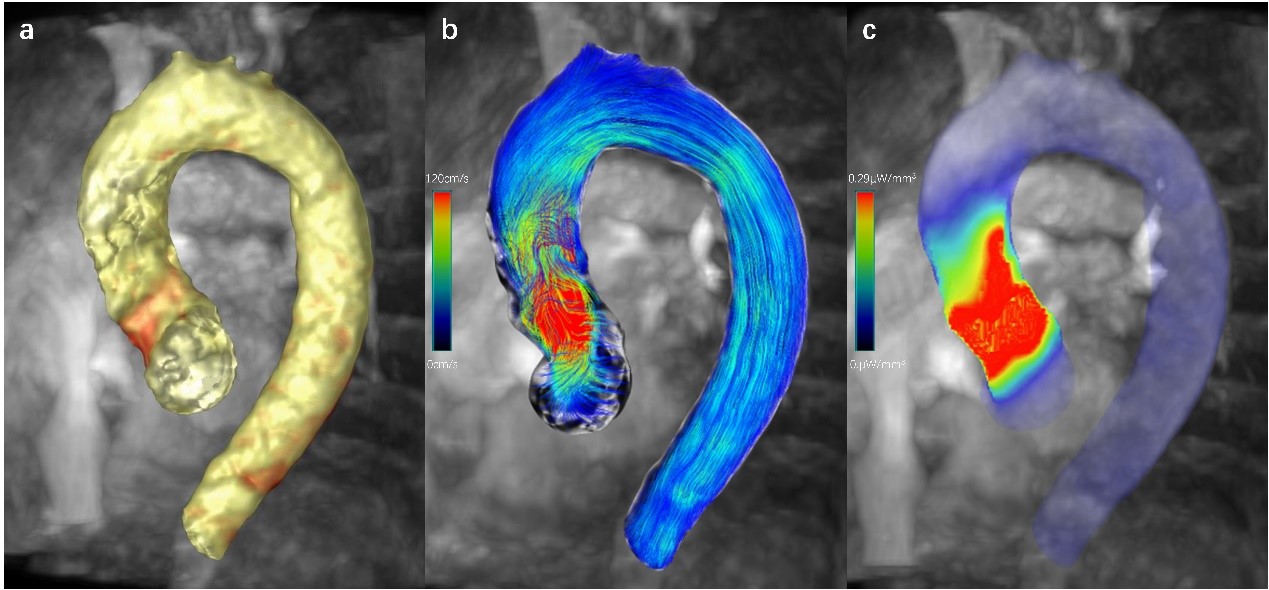
Figure 1. The 4D flow MR images of a 56 year old male patient with HOCM. (a) Segmented vessel from the LVOT to the descending aorta. (b) The blood flow velocity streamlining from the LVOT to the descending aorta. As shown, flow velocity in the narrow part of the LVOT is significantly increased. (c) Three-dimensional distribution of the end-diastolic viscous energy loss. As shown, the increased loss of viscous energy is mainly concentrated at the LVOT obstruction and the aortic root. Note: LVOT, left ventricular outflow tract.
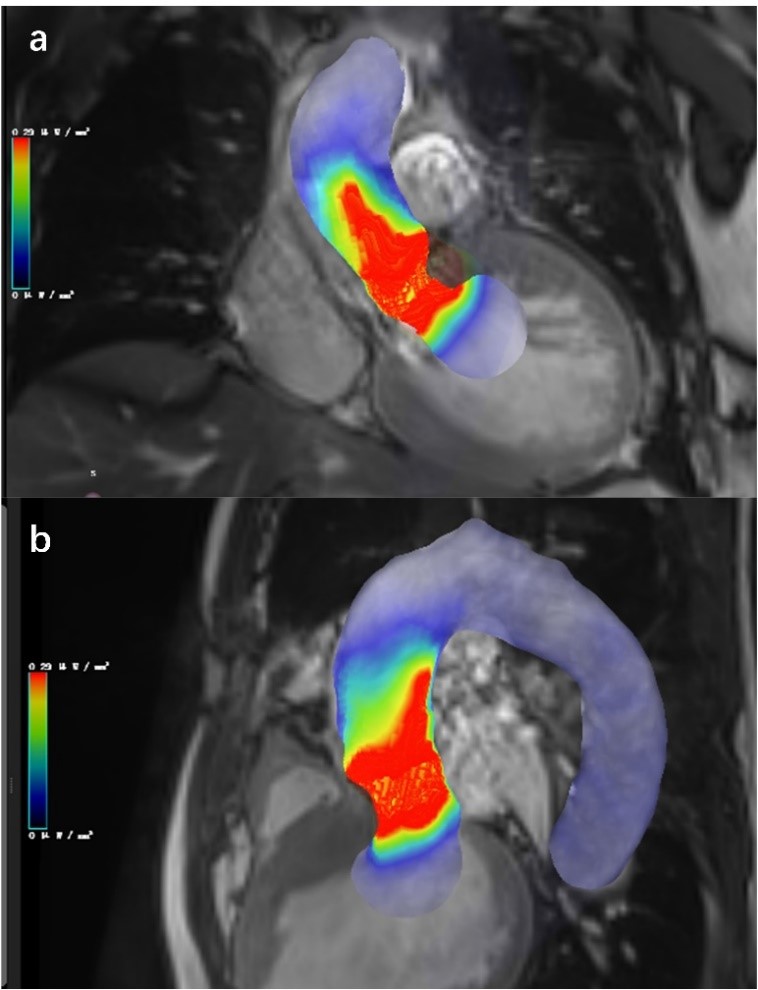
Figure 2. The 4D flow MRI images of a 56-year-old male patient with HOCM.(a-b) Maximum projection of viscous energy loss in the (a) left ventricular outflow tract and (b) three-chamber cine plane.
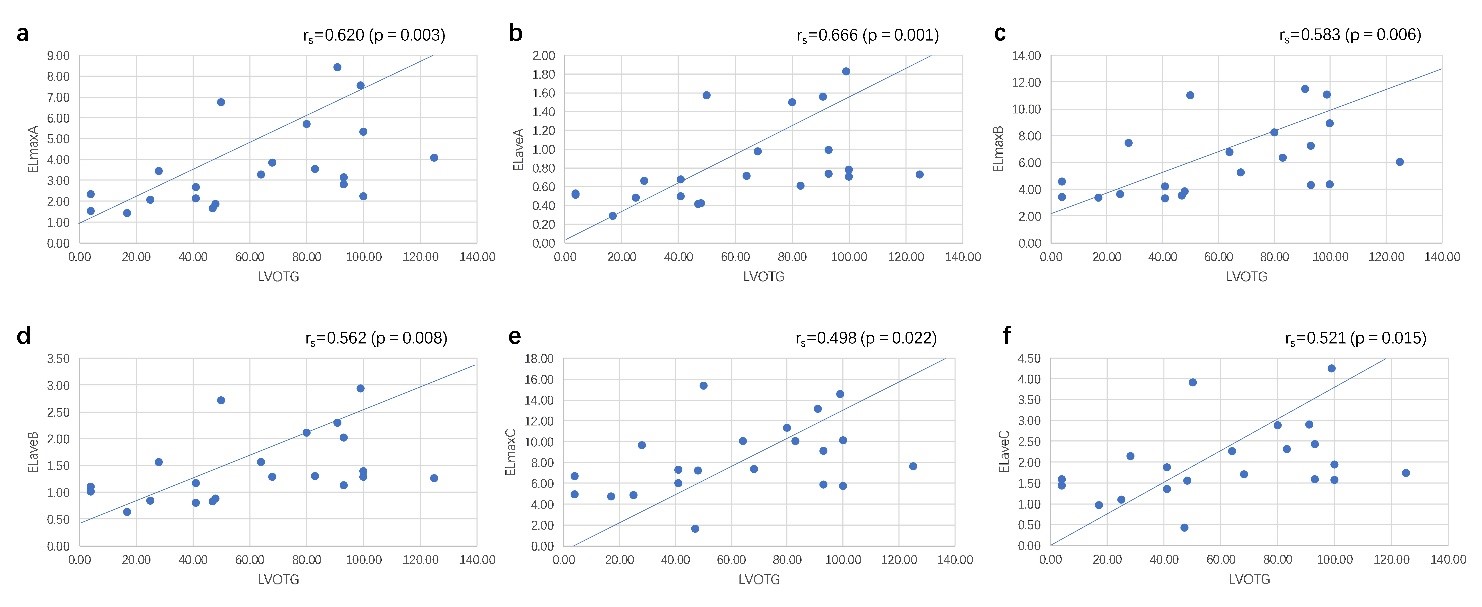
Figure 3. The viscous energy losses correlations with LVOTG. The ELmax and ELave of blood flow from the LVOT to the aortic root(a-b), from the LVOT to the origin of the first brachiocephalic branch (c-d) and from the LVOT to the mid descending aorta at the level of the aortic root(e-f).