3827
Oscillatory Wall Shear Stress in patients with Bicuspid Aortic Valve and Aortic Regurgitation1Department of Health, Medicine and Caring Sciences (HMV), Linköping University, Linköping, Sweden, 2Center for Medical Image Science and Visualization (CMIV), Linköping University, Linköping, Sweden, 3Department of Cardiac Sciences, Cumming School of Medicine, University of Calgary, Calgary, AB, Canada, 4Stephenson Cardiac Imaging Centre, Libin Cardiovascular Institute, Calgary, AB, Canada, 5Department of Radiology, University of Calgary, Calgary, AB, Canada, 6Alberta Children’s Hospital Research Institute, University of Calgary, Calgary, AB, Canada
Synopsis
Keywords: Flow, Vessels, Aorta
Individuals with bicuspid aortic valve (BAVs) and aortic regurgitation have higher rate of aortic complications compared to individuals with stenotic and functioning BAVs. We sought to investigate wall shear stress (WSS) and oscillatory shear index (OSI) in the ascending aorta of BAVs with functioning valves, stenotic and regurgitant valves, as well as controls with tricuspid aortic valves. BAVs with regurgitation had similar WSS compared to all other groups, but OSI was almost twice as high. This finding may be related to the pendulum volume between the aorta and the left ventricle. Studying OSI may improve the understanding behind BAV aortopathy.
Background
Bicuspid aortic valve (BAV) is the most common congenital heart defect and affects 0.5-2% of the population worldwide1. The prevalence of aortic dilatation in BAVs is 50%-80% and increases in the presence of valve stenosis or regurgitation 2. However, the clinical outcome is different in patients with aortic stenosis and regurgitation. Patients with aortic regurgitation and BAV have higher rate of aortic complications compared to patients with stenotic and normally functioning BAV 3. Wall shear stress (WSS) and the oscillatory shear index (OSI) are known hemodynamic parameters that affect endothelial cells. OSI is a descriptor for non-uniaxial shear stress, and it is more likely to be high in regions of low WSS. Nevertheless, OSI can also be elevated in regions of physiological or high WSS in case of flow reversal. The aim of this study was to investigate if individuals with BAV with aortic regurgitation had altered WSS and OSI in the ascending aorta compared to functioning and stenotic BAVs, as well as normally functioning tricuspid aortic valves.Methods
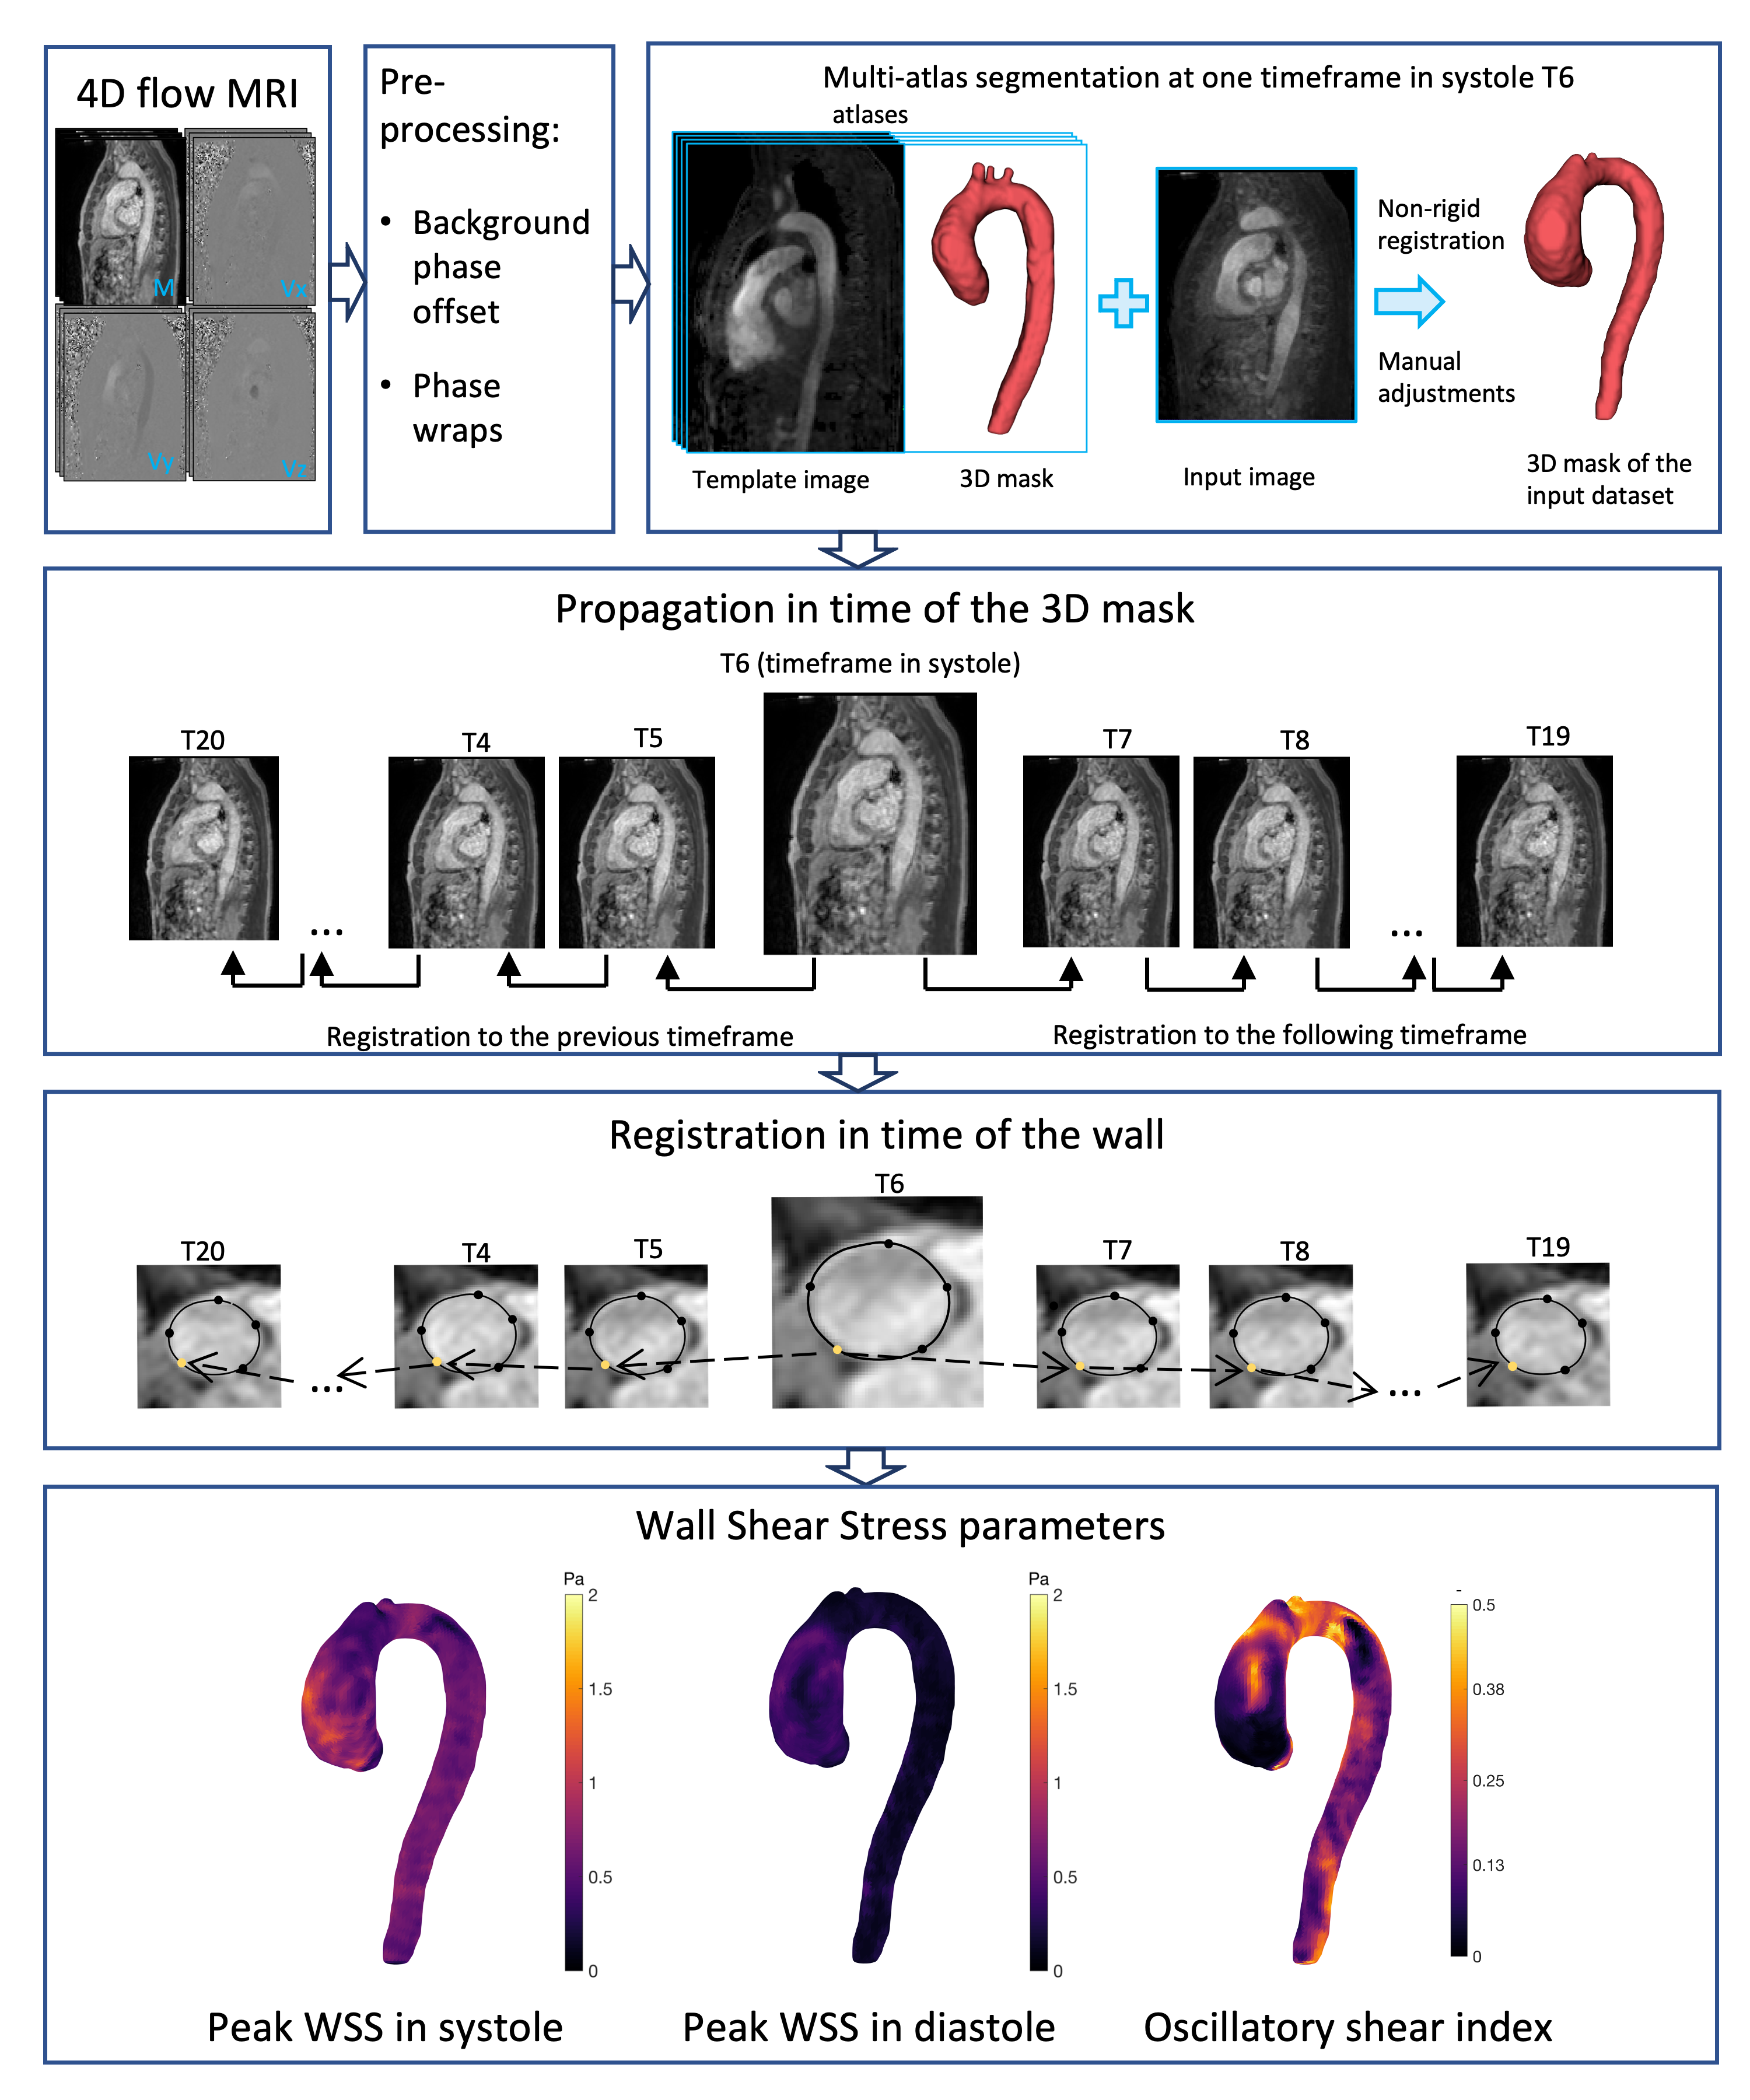
In this cross-sectional retrospective study, 42 research subjects were included as a subgroup of a prospective observational clinical outcome registry at the Stephenson Cardiac Imaging Center, Calgary, Canada. The research subjects underwent an MRI protocol including 4D flow MRI at 3T scanners (Prisma or Skyra, Siemens, Erlangen, Germany). Aortic regurgitation was graded based on regurgitant fraction and aortic stenosis was graded based on peak velocity from 2D phase-contrast MR images. The research subjects were classified in the three following groups: patients with functional BAV, namely no regurgitation and/or stenosis (fBAV, N=13); patients with pure or prevalent aortic regurgitation (arBAV, N=14); patients with pure or prevalent aortic stenosis (asBAV, N=15). Additionally, 16 healthy volunteers with tricuspid aortic valves (TAV) were included. A workflow of the methods is reported in Figure 1. Phase-contrast magnetic resonance angiography (PC-MRA) images were computed from the magnitude and velocity images at one time frame in systole. 3D segmentation was performed using multi-atlas segmentation approach, combined with manual adjustments. Time-resolved segmentations were generated by registering the 3D segmentation to every other timeframe in the 4D Flow MRI data with a non-rigid registration method 4. Isosurfaces representing the aortic wall were then created and smoothed. The systolic mesh was then projected to the isosurfaces the other timeframes with a with a non-rigid variant of the iterative closest point algorithm5, allowing for computation of time resolved parameters at each node in the wall. WSS vectors at each timeframe were computed using the method of Potters et al 6 and the oscillatory shear index (OSI) was derived. The inner points of the aortic annulus, and the insertion of the brachiocephalic trunk were manually identified on the PC-MRA images and used to define the ascending aorta. Flow rate curves were created by averaging the flow rate curves on three planes close to the mid ascending aorta, and the first inflection point was identified to separate systole from diastole. Time peak WSS in systole and diastole, as well as OSI were reported as average values in the ascending aorta for each subject. Finally, when the data were normally distributed, a two-tailed unpaired student’s t-test was used to compare pairwise the four groups. If not normally distributed, a non-parametric Wilcoxon rank sum test was used. Bonferroni correction was applied to compensate for multiple comparisons, and a p-value = 0.008 was considered as significant (0.05/6 number of comparisons).Results
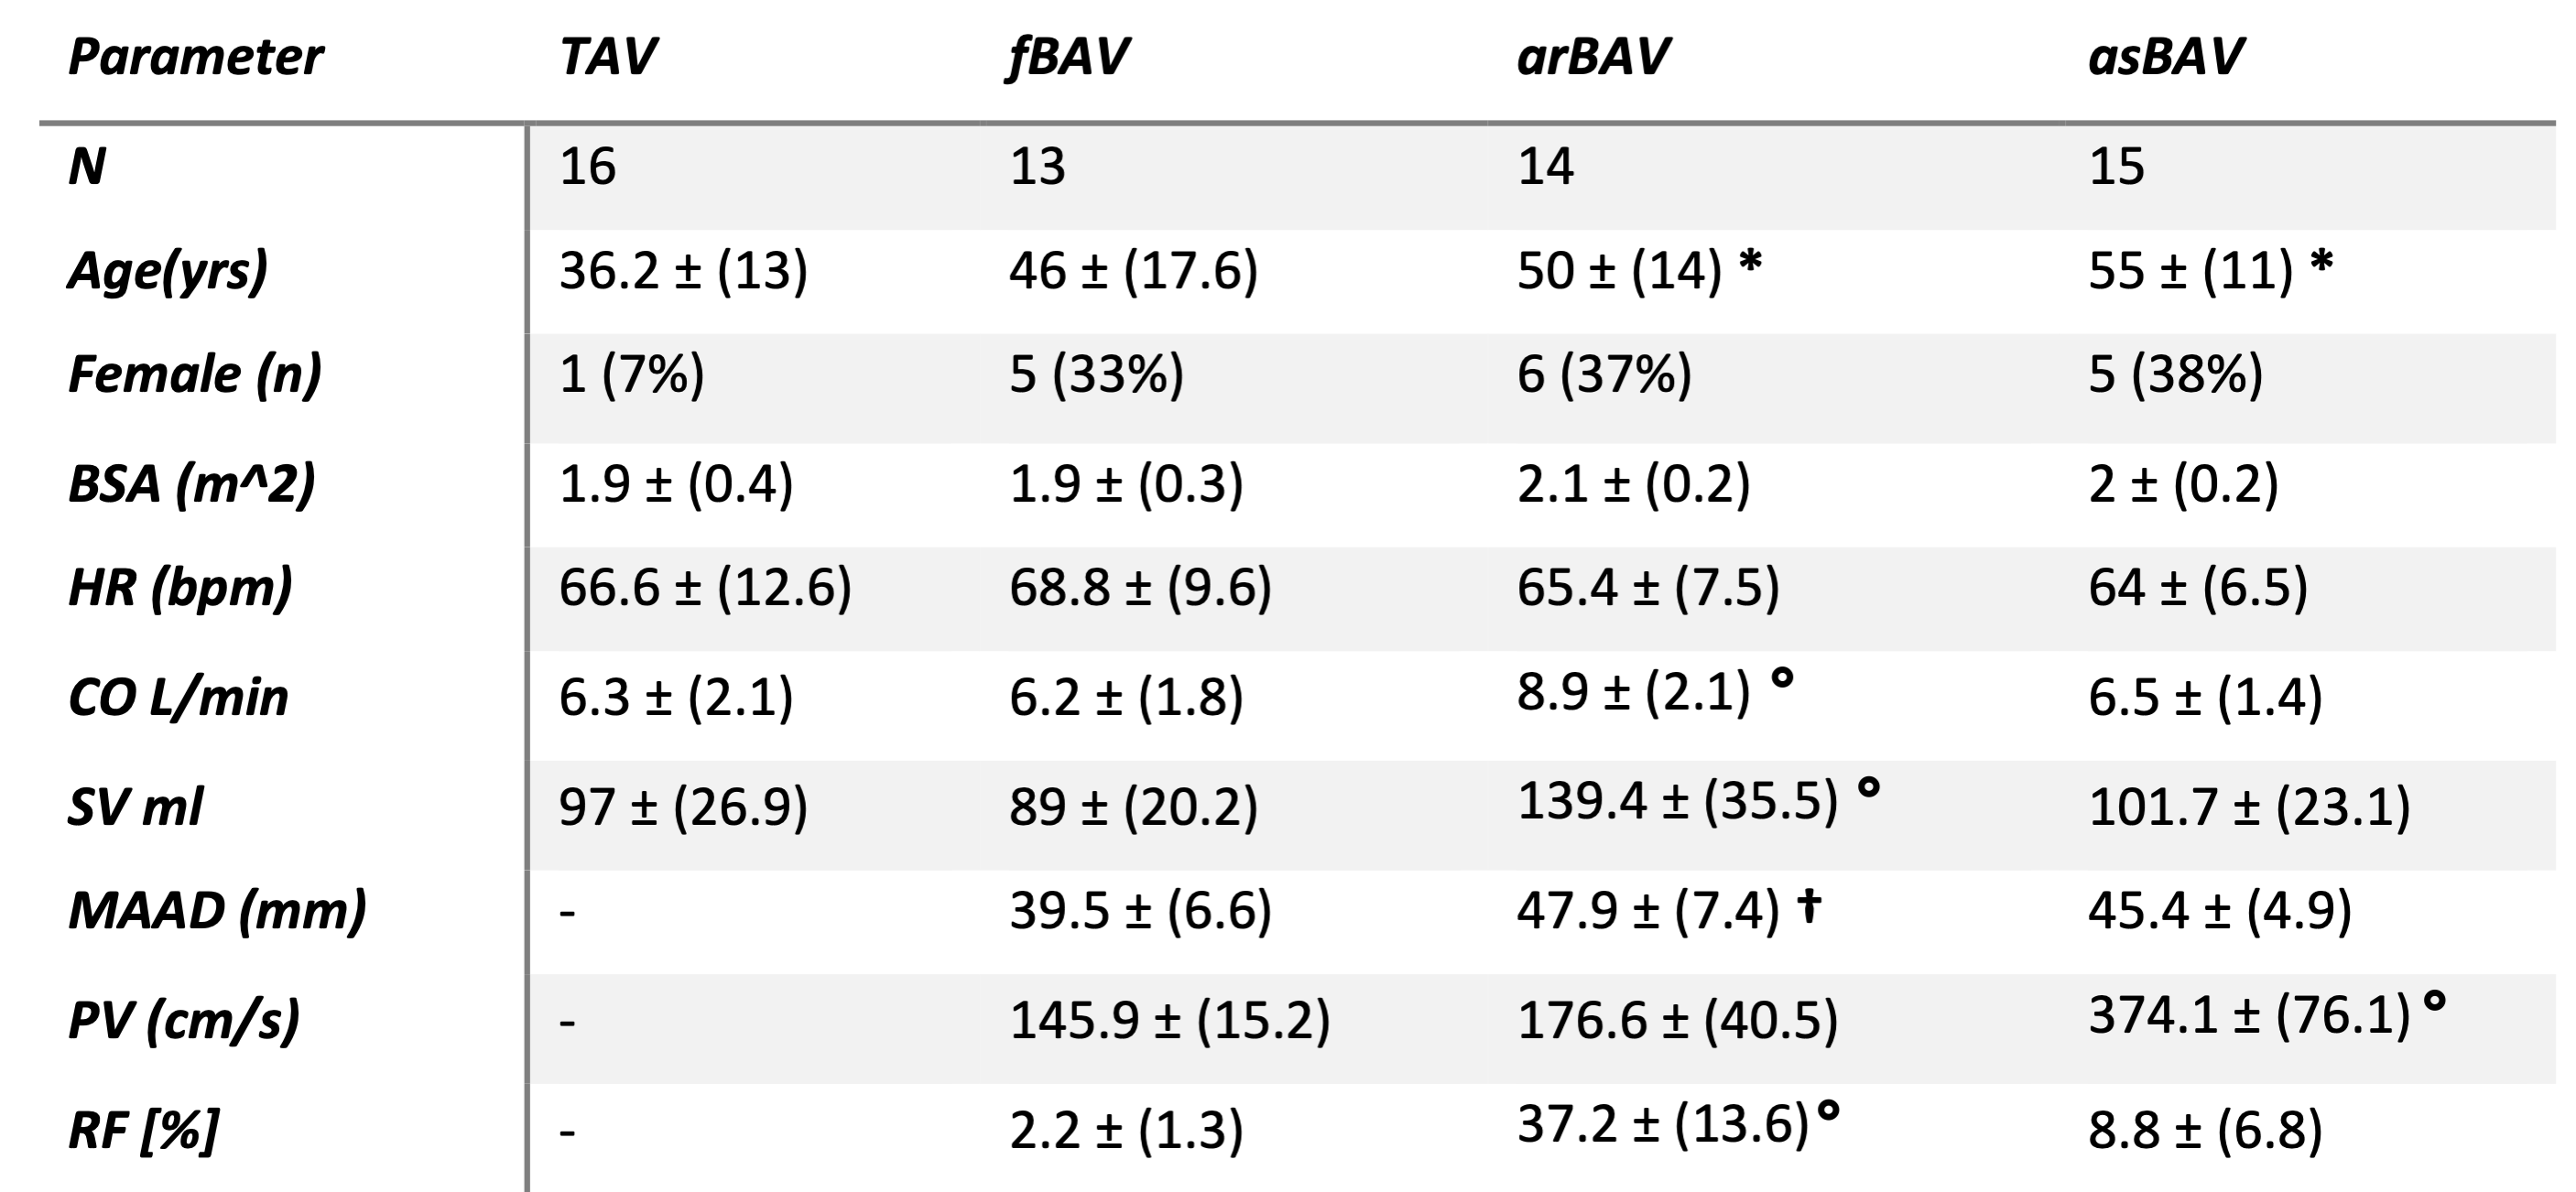
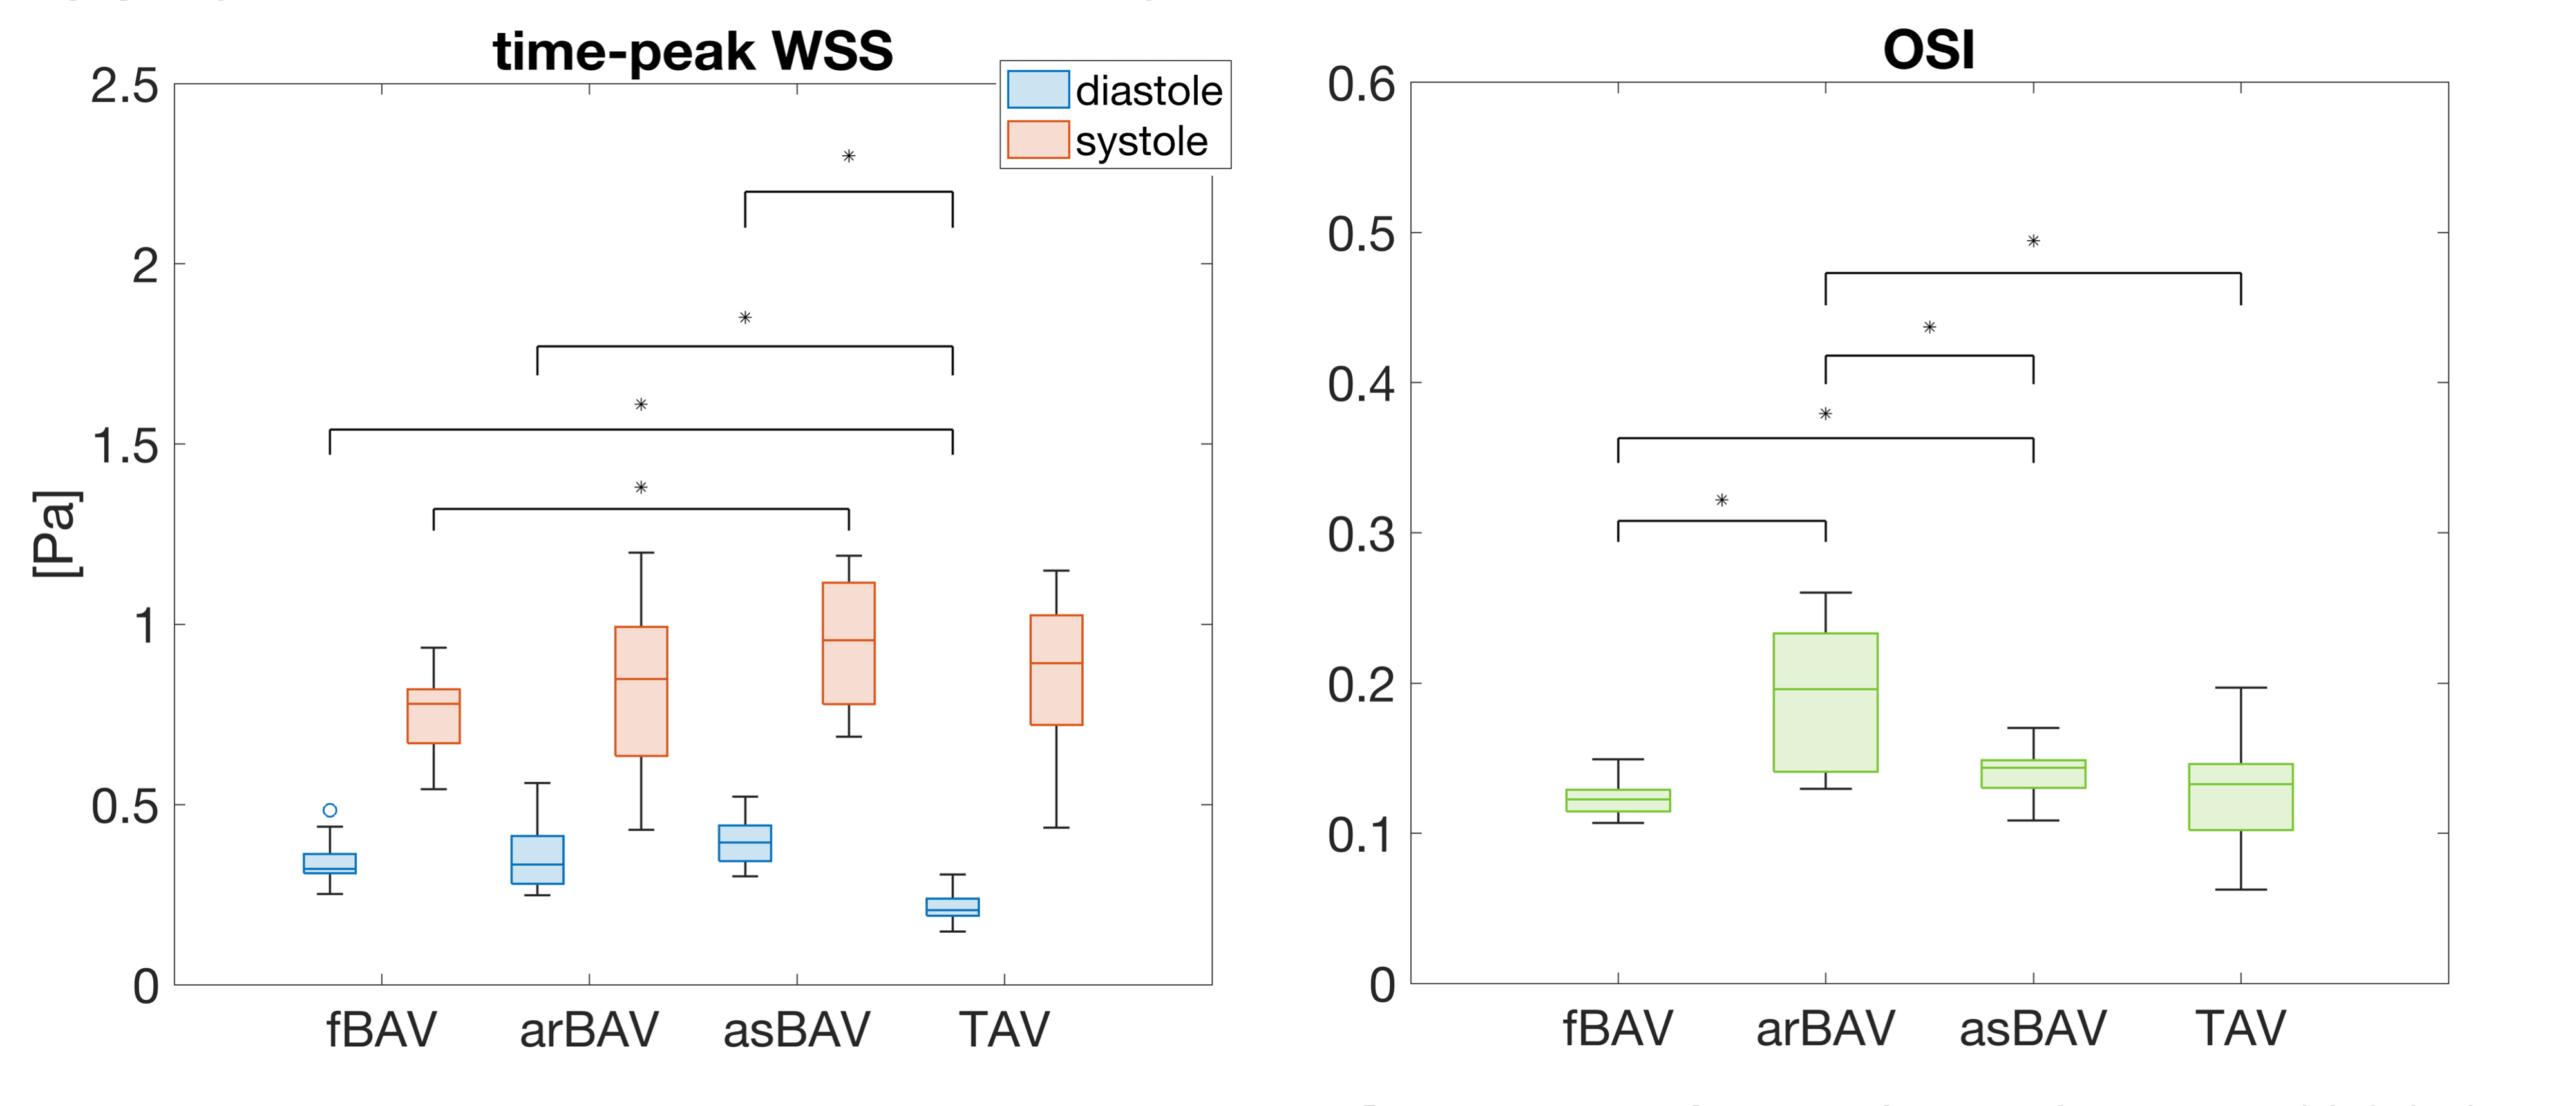
Table 1 reports demographics and clinical characteristics for the four groups. The functioning BAVs and the TAV controls were less dilated than the BAVs with regurgitation and BAV with stenosis. BAVs with aortic regurgitation had higher stroke volume and cardiac output. Time-peak WSS in systole and diastole and OSI are reported in Figure 2. BAV with aortic regurgitation had similar WSS in systole and diastole compared to the other groups, but higher OSI (p ≤ 0.001).Discussion
In this study, OSI stands out as a clear marker of abnormal WSS patients with BAV and aortic regurgitation. OSI was almost twice as high in BAV patients with aortic regurgitation when compared to all other groups studied here. The finding that BAV patients with aortic regurgitation have high OSI may be explained by the pendulum volume between the aorta and left ventricle caused by the regurgitation. Interestingly, the commonly used peak WSS was not different in BAV with aortic regurgitation compared to the other groups.Conclusion
This study highlights OSI as a new potential mechanism for the development of BAV aortopathy in patients with aortic regurgitation. Despite the small number of subjects included, these findings suggest that OSI should be considered in future studies that explore the role of WSS in the development of BAV dilatation.Acknowledgements
No acknowledgement found.References
1. Otto, C. M. et al. 2020 ACC/AHA Guideline for the Management of Patients With Valvular Heart Disease: A Report of the American College of Cardiology/American Heart Association Joint Committee on Clinical Practice Guidelines. J. Am. Coll. Cardiol. 77, e25–e197 (2021).
2. Masri, A., Svensson, L. G., Griffin, B. P. & Desai, M. Y. Contemporary natural history of bicuspid aortic valve disease: a systematic review. Heart Br. Card. Soc. 103, 1323–1330 (2017).
3. Masri, A. et al. Aortic Cross-Sectional Area/Height Ratio and Outcomes in Patients With Bicuspid Aortic Valve and a Dilated Ascending Aorta. Circ. Cardiovasc. Imaging 10, e006249 (2017).
4. Bustamante, M. et al. Automated multi-atlas segmentation of cardiac 4D flow MRI. Med. Image Anal. 49, 128–140 (2018).
5. Amberg, B., Romdhani, S. & Vetter, T. Optimal Step Nonrigid ICP Algorithms for Surface Registration. in 2007 IEEE Conference on Computer Vision and Pattern Recognition 1–8 (2007). doi:10.1109/CVPR.2007.383165.
6. Potters, W. V., van Ooij, P., Marquering, H., vanBavel, E. & Nederveen, A. J. Volumetric arterial wall shear stress calculation based on cine phase contrast MRI: Volumetric Wall Shear Stress Calculation. J. Magn. Reson. Imaging 41, 505–516 (2015).
Figures