3826
Evaluation of turbulent Kinetic energy and Viscous energy loss on 4D flow MRI in patients with hypertrophic cardiomyopathy1Nippon Medical School, Tokyo, Japan
Synopsis
Keywords: Flow, Cardiovascular
The purpose was to validate whether turbulent kinetic energy (TKE) and viscous energy loss (VEL) reflect the condition of hypertrophic cardiomyopathy (HCM). We included consecutive 32 HCM patients. They were classified into HOCM (HCM with left ventricular outflow tract obstruction [LVOTO]) (n=21) and HNCM (HCM without LVOTO) (n=11) based on cardiac ultrasound. Both TKE and VEL were significantly higher in HOCM than HNCM. The strong correlation was observed between normalized LVmass and normalized TKEpeak in asymptomatic HCM (nTKEpeak r=0.879, p<0.001), but not in symptomatic HCM. The TKEpeak had the strongest correlation to each disease condition than the others.Introduction
In patients with hypertrophic cardiomyopathy (HCM), the increase of cardiac load caused by left ventricle outflow tract (LVOT) obstruction relates to the mortality [1]. The impairment of cardiac ejection efficiency can be measured as energy loss composed of turbulent kinetic energy (TKE) and viscous energy loss (VEL) both of which can be calculated from 4D Flow MRI data [2, 3]. Energy loss based on 4D Flow MRI is expected to be more useful as an index of cardiac workload than Doppler ultrasound which does not take post-stenotic recovery into account [4].Although there already exist a few studies which validated either TKE or VEL evaluation for cardiac diseases, the comparison of these two values in the same subjects has not been performed [5-7]. The purpose of this study was to clarify which energy loss value reflects the disease condition in HCM patients.
Methods
Patients; Between April 2018 and July 2019, we included 32 consecutive HCM patients. Based on cardiac ultrasound examination, 21 were diagnosed as HOCM (HCM with LVOT obstruction) and 11 as HNCM (HCM without LVOT obstruction). MR acquisition and post-processing are summarized in figure 1.MR acquisition; We performed cardiac MRI including 4D Flow MRI using a 3.0-T MRI unit (Achieva; Philips). The parameters of 4D Flow MRI are as follows. TR/TE = 4.3/2.7, FA = 11 degrees, Resolution = 1.7*1.7*2.0 mm3; Triple VENC acquisition=50-150-450 cm/s; k-t PCA (acceleration factor, 5-7), cardiac phase 15-21, free breath acquisition; and acquisition time 8-15 min.).
MR reconstruction; Blood flow velocity and TKE were calculated from multi-VENC 4D Flow data by using offline reconstruction software combining Bayesian estimation (CRECON, Gyrotools) [6]. The reconstruction took approximately 15 minutes per case. VEL was calculated from the blood flow velocity by using Pmod (Pmod). The reconstruction took a few seconds per case.
MR analysis; Pmod was used. The VOI from the left ventricular to the aortic arch was drawn semi-automatically based on phase contrast MRA imaging derived from 4D Flow MRI data. We defined TKEpeak and VELpeak as the highest phase in the all cardiac phase, and TKEsum and VELsum as the sum of the entire cardiac phase. For the normalization, we divided the original value by body mass index (BMI) (e.g. nTKEpeak = TKEpeak/BMI).
Statistics; To validate whether the energy loss parameter reflects the condition of HCM, each parameter was compared between HOCM and HNCM groups and between the group with and without clinical symptoms (NYHA classification 1 vs. 2 and 3) by Mann-Whitney U test. The correlation coefficient between each normalized energy loss parameter and normalized left ventricular (LV) mass (nLVmass, LV mass divided by BMI) was analyzed by Pearson’s test.
Results:
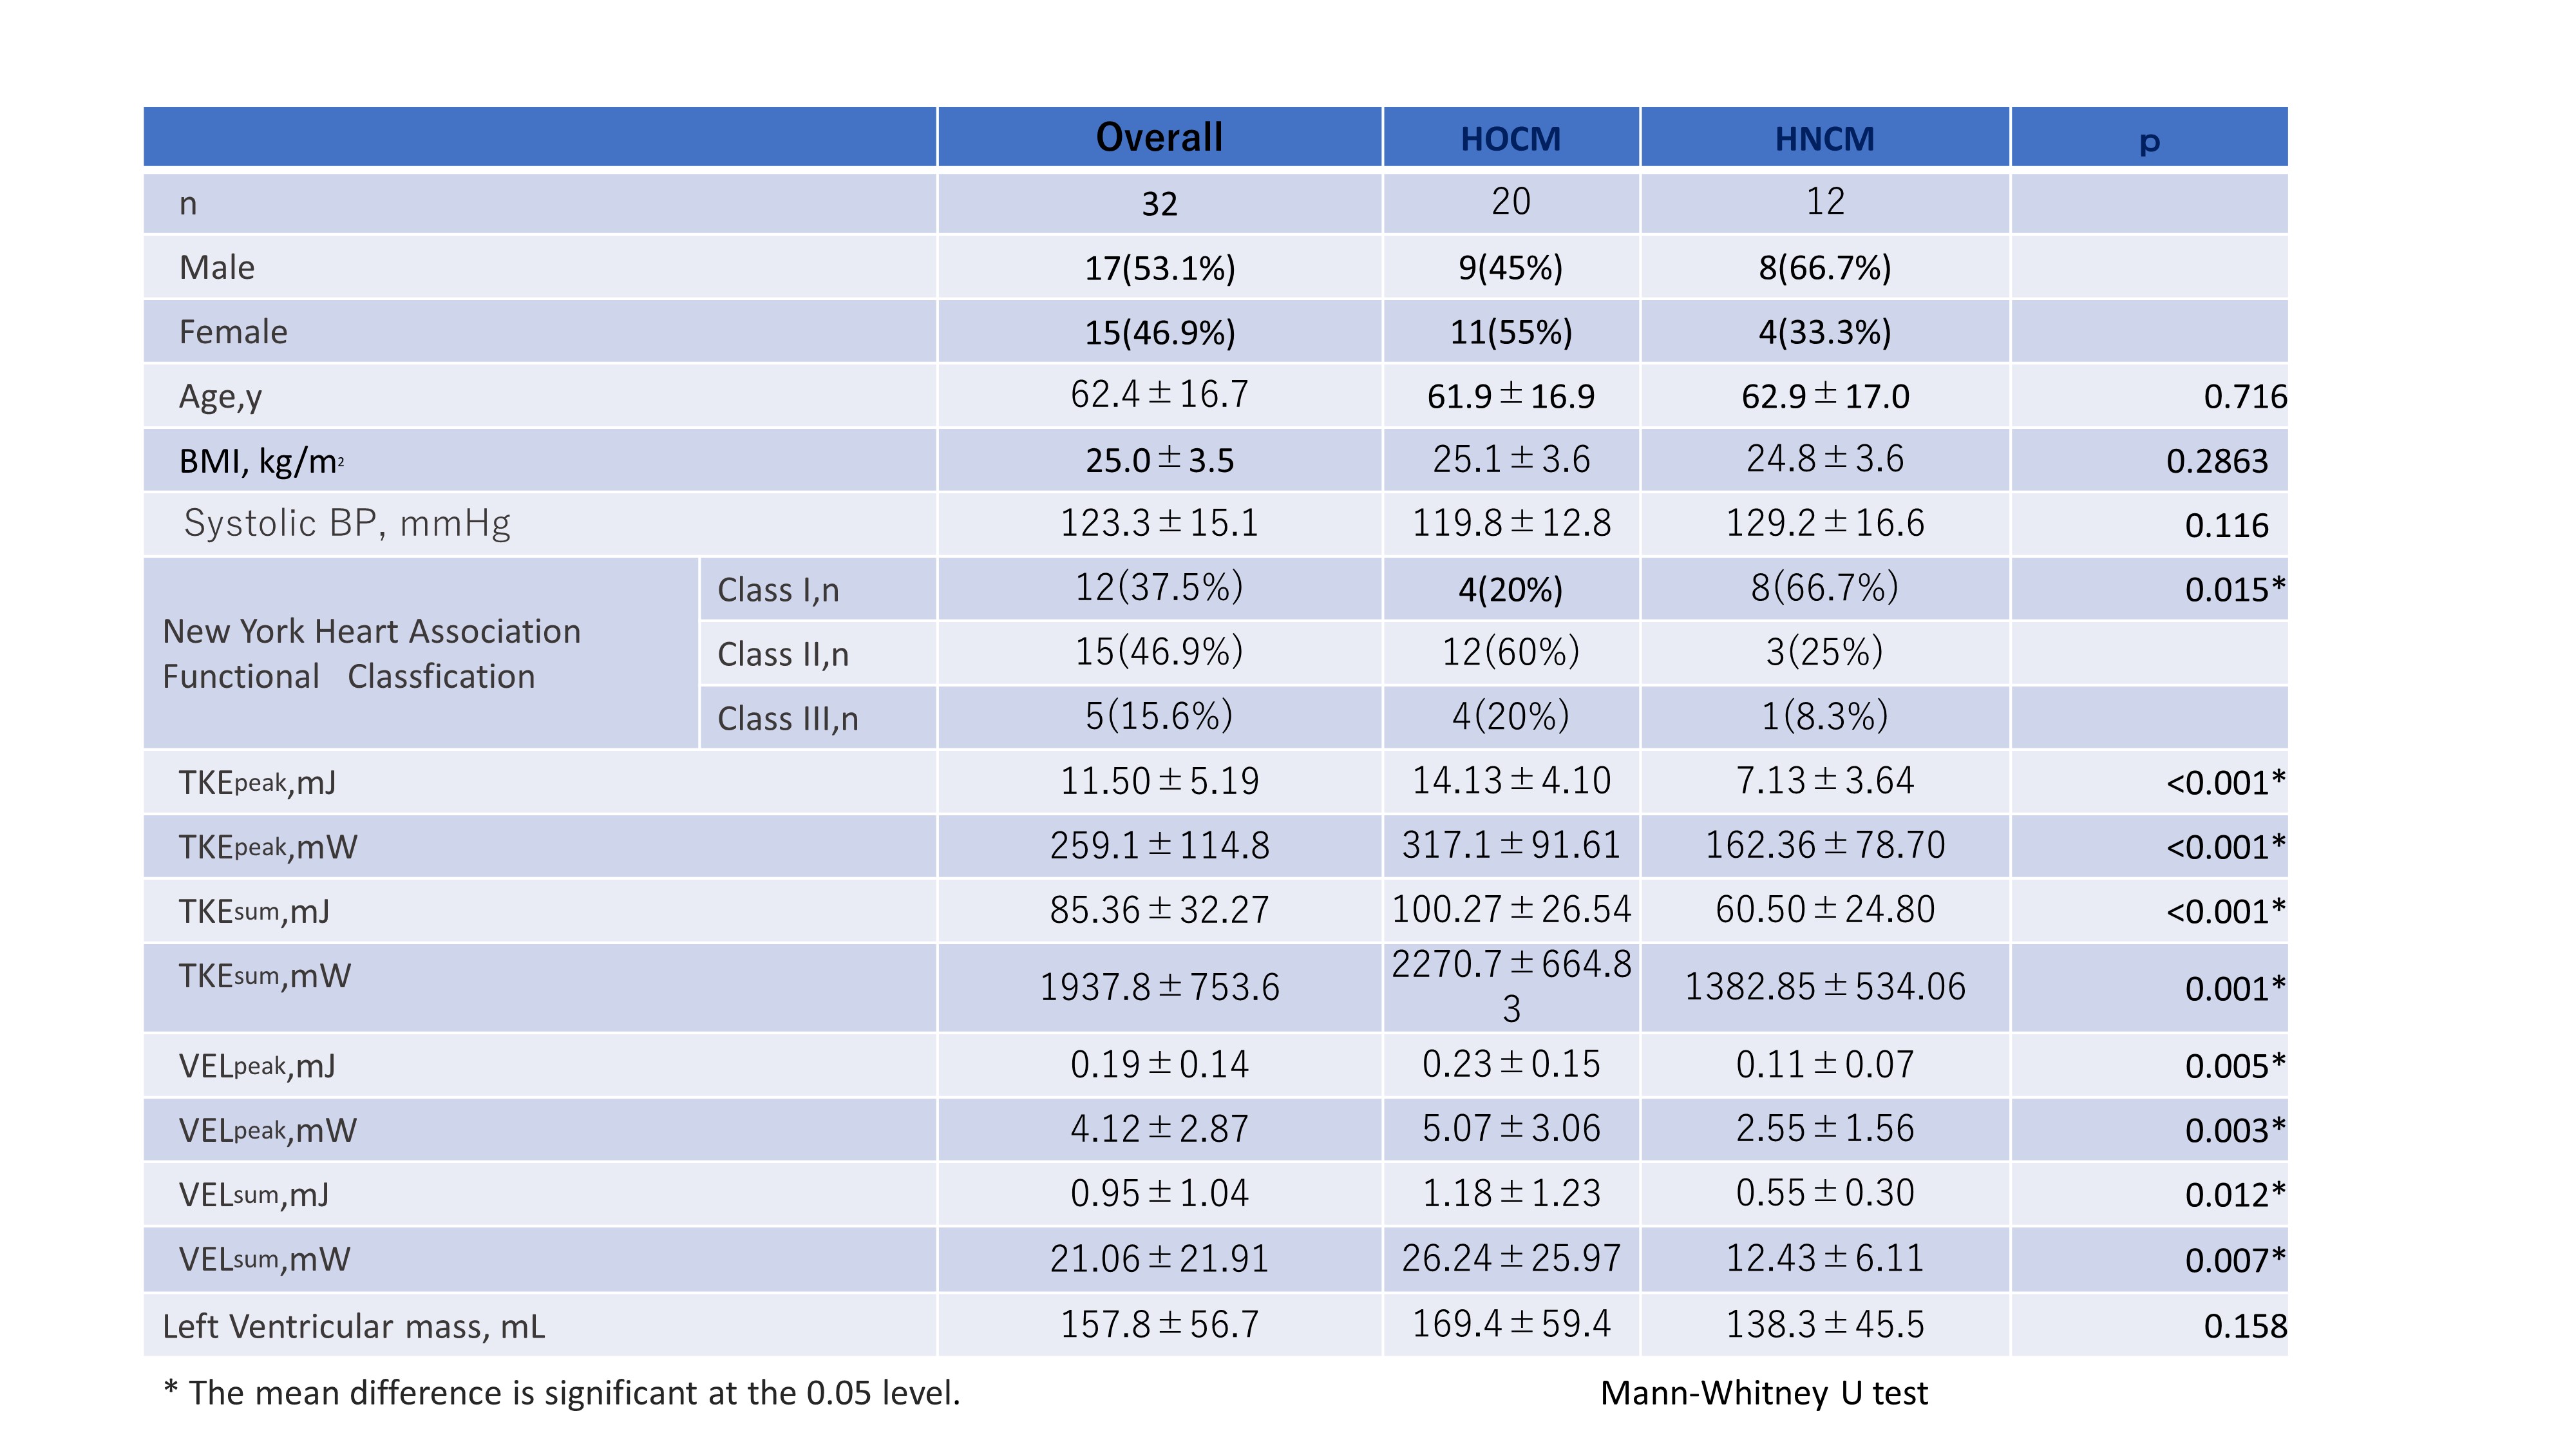
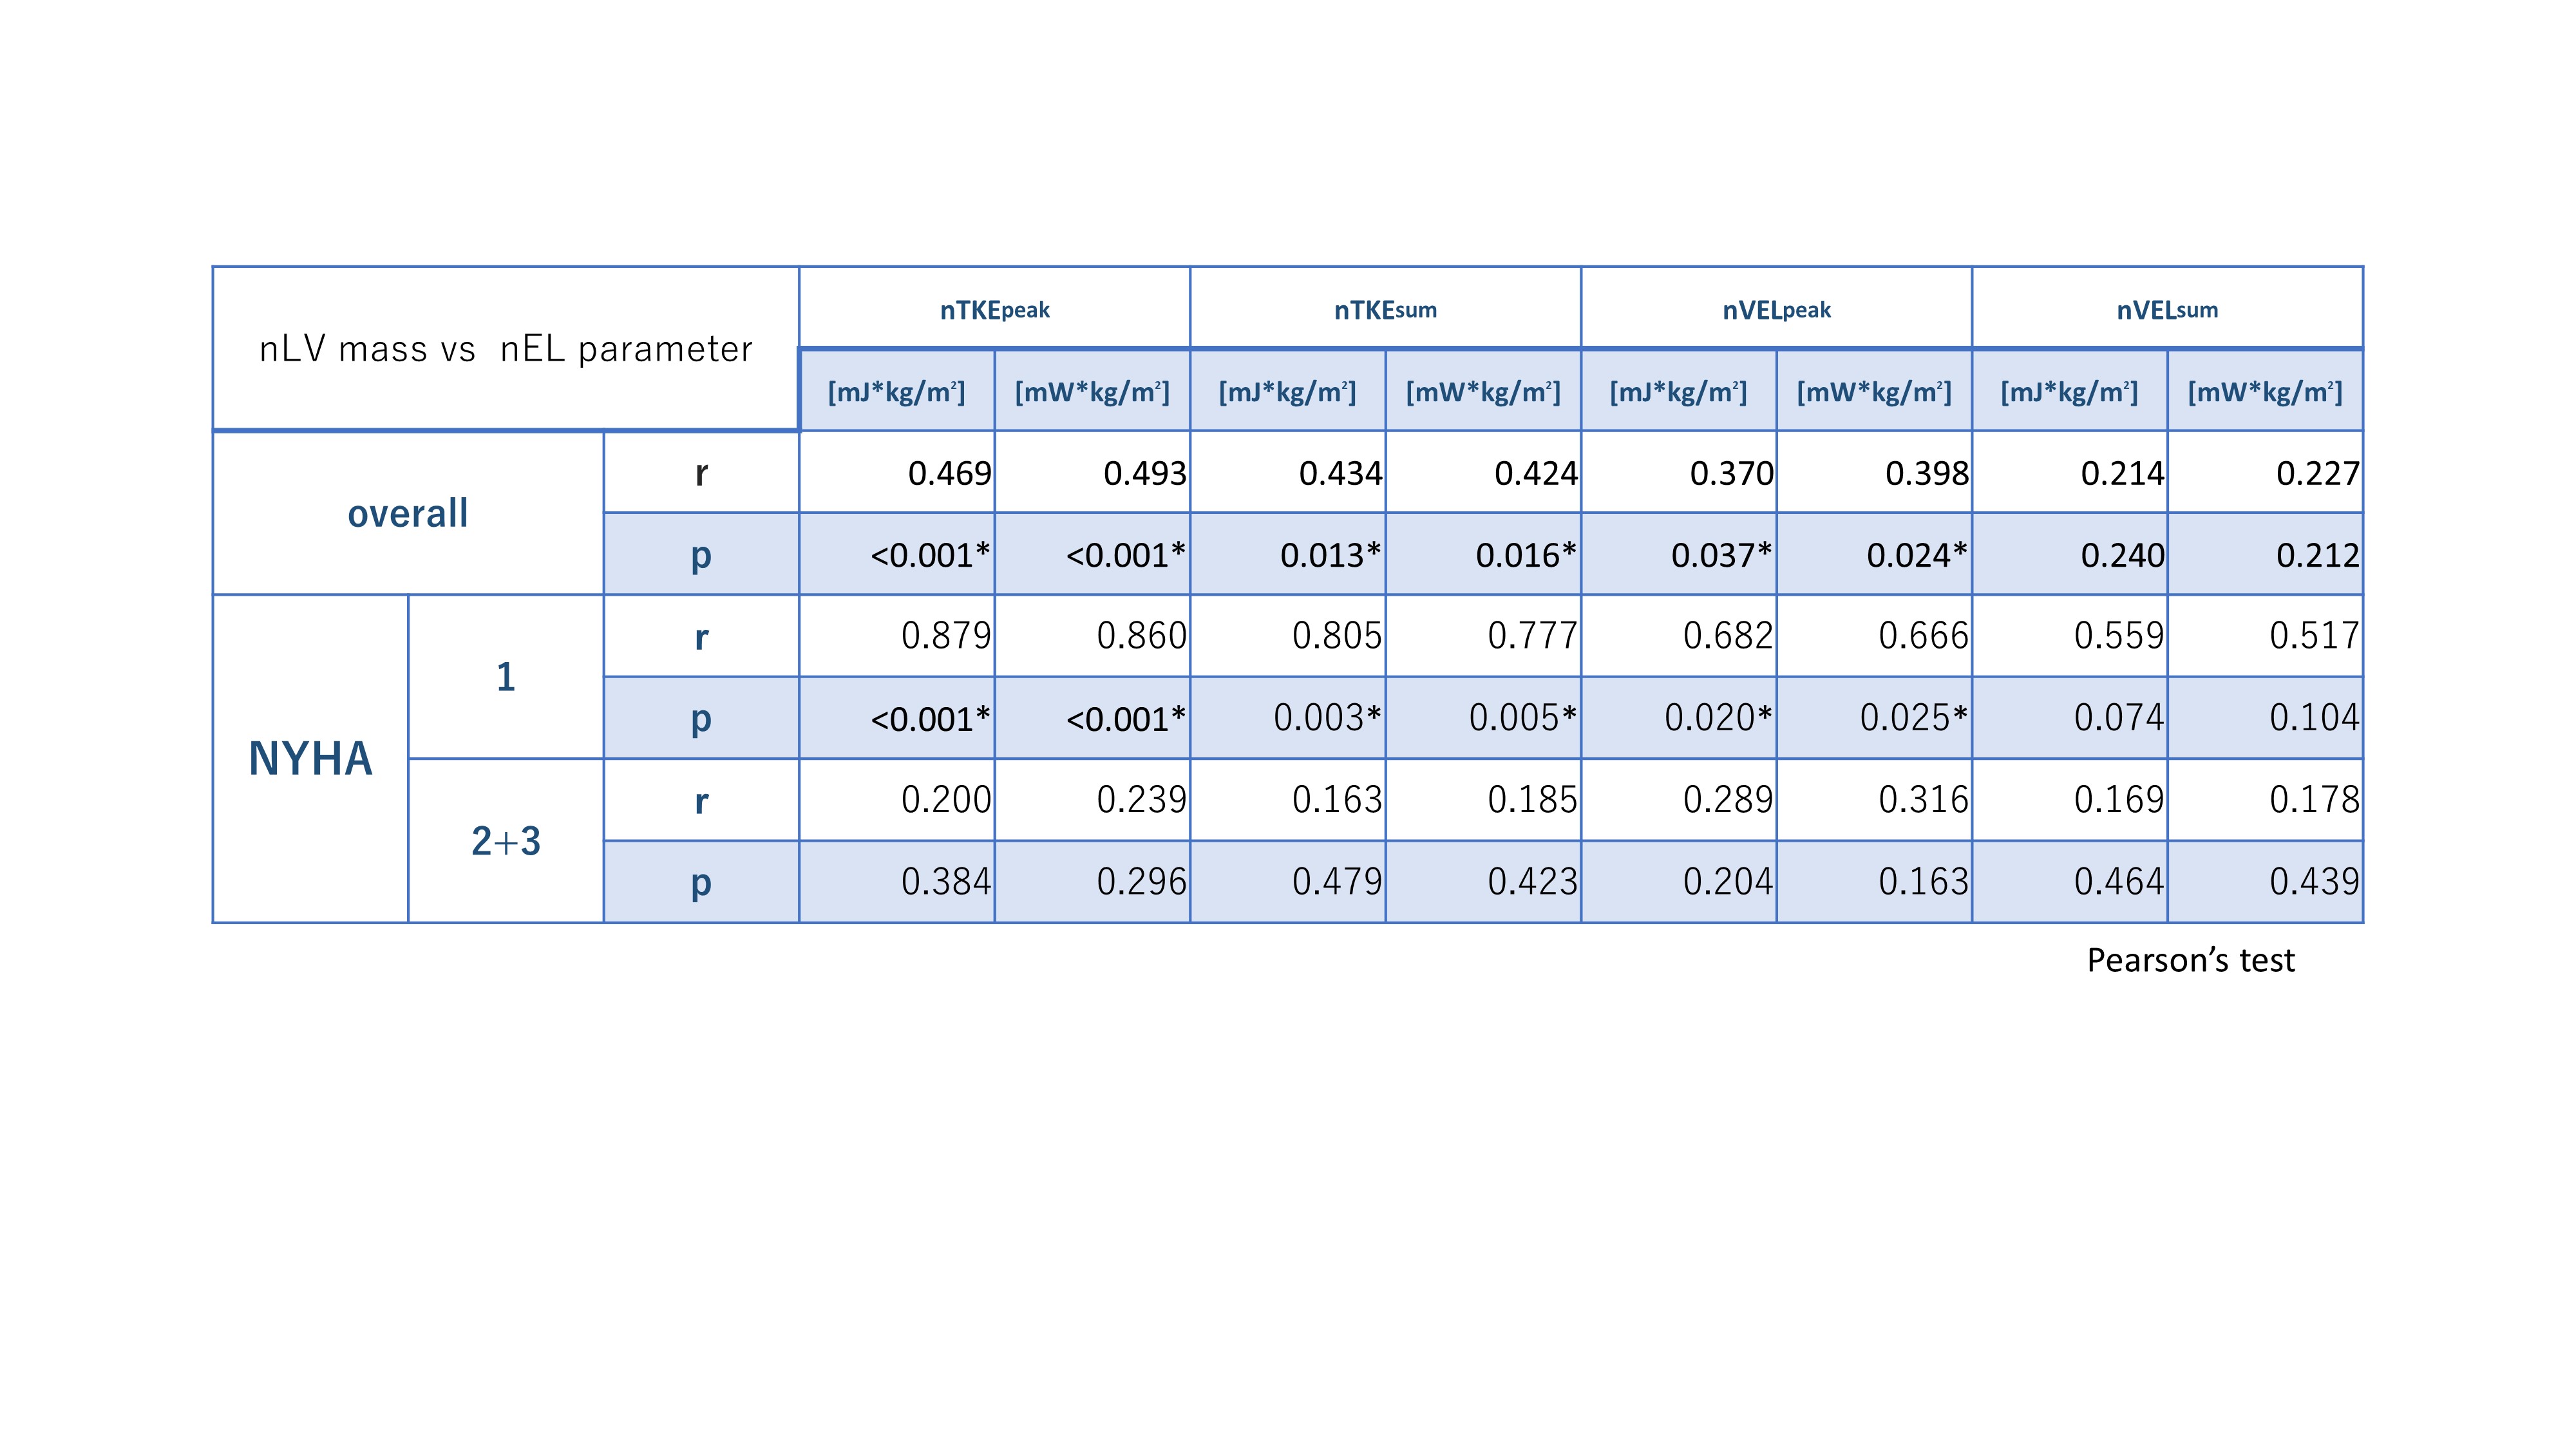
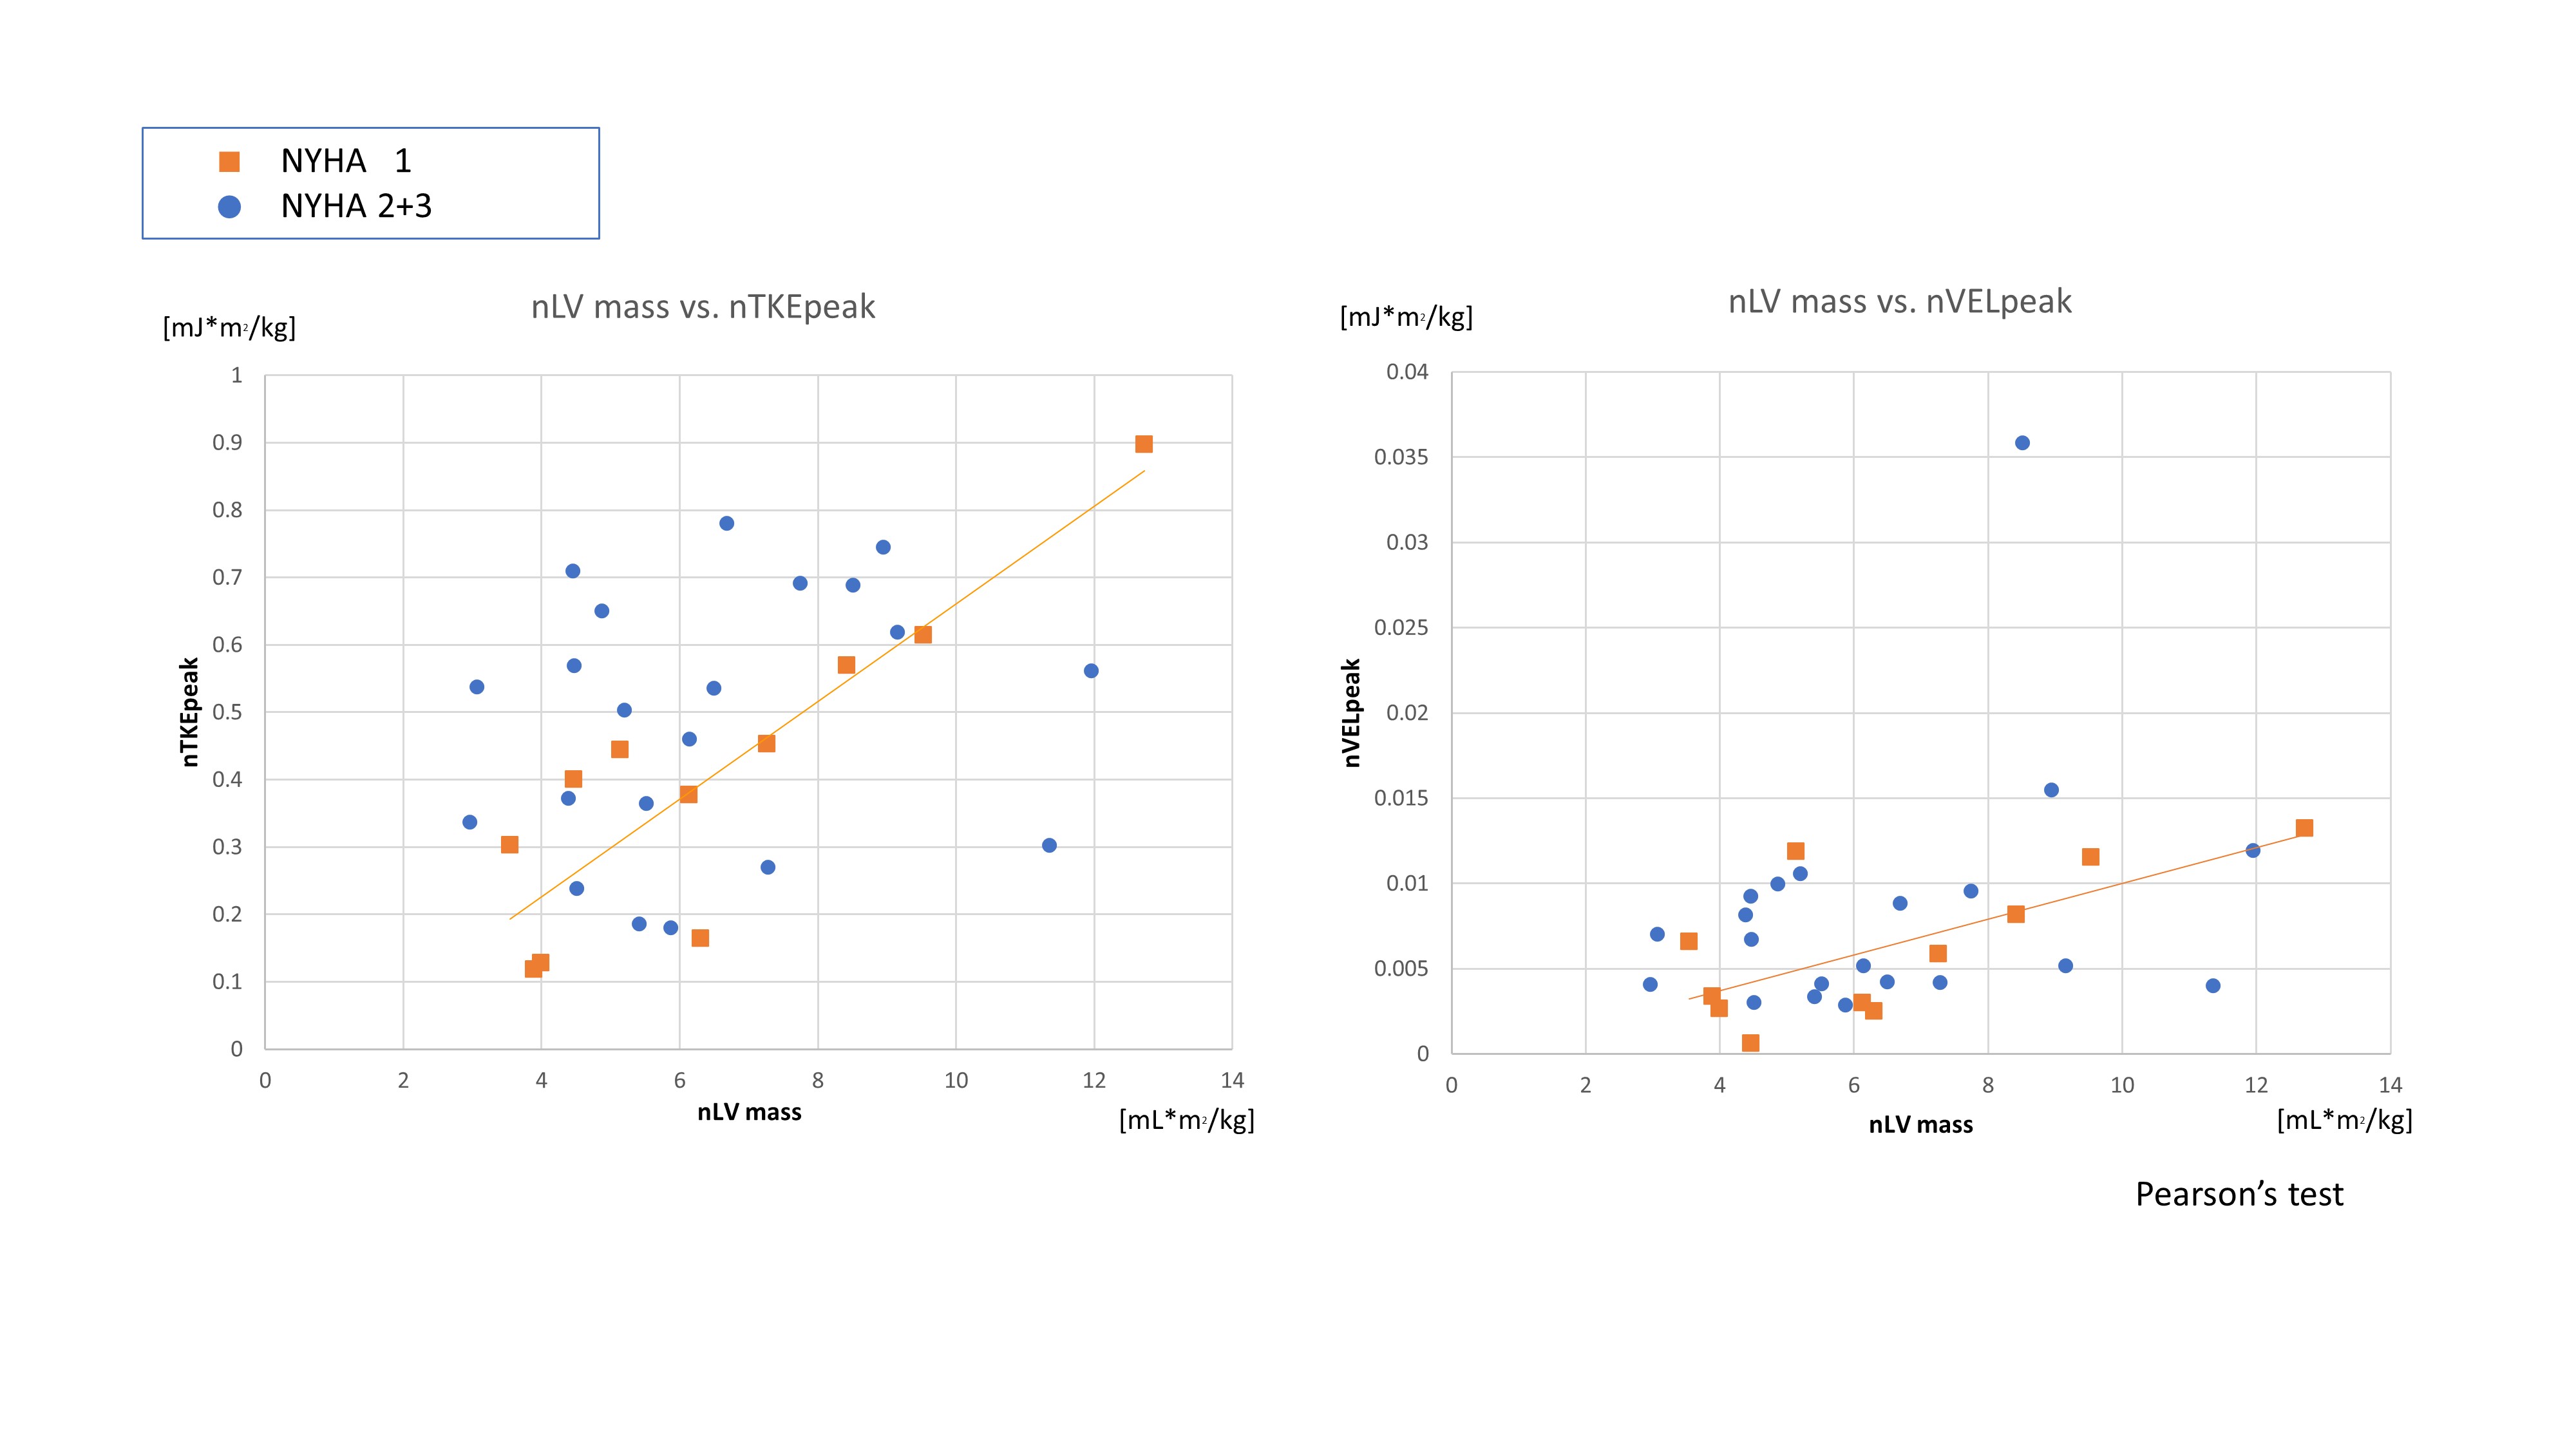
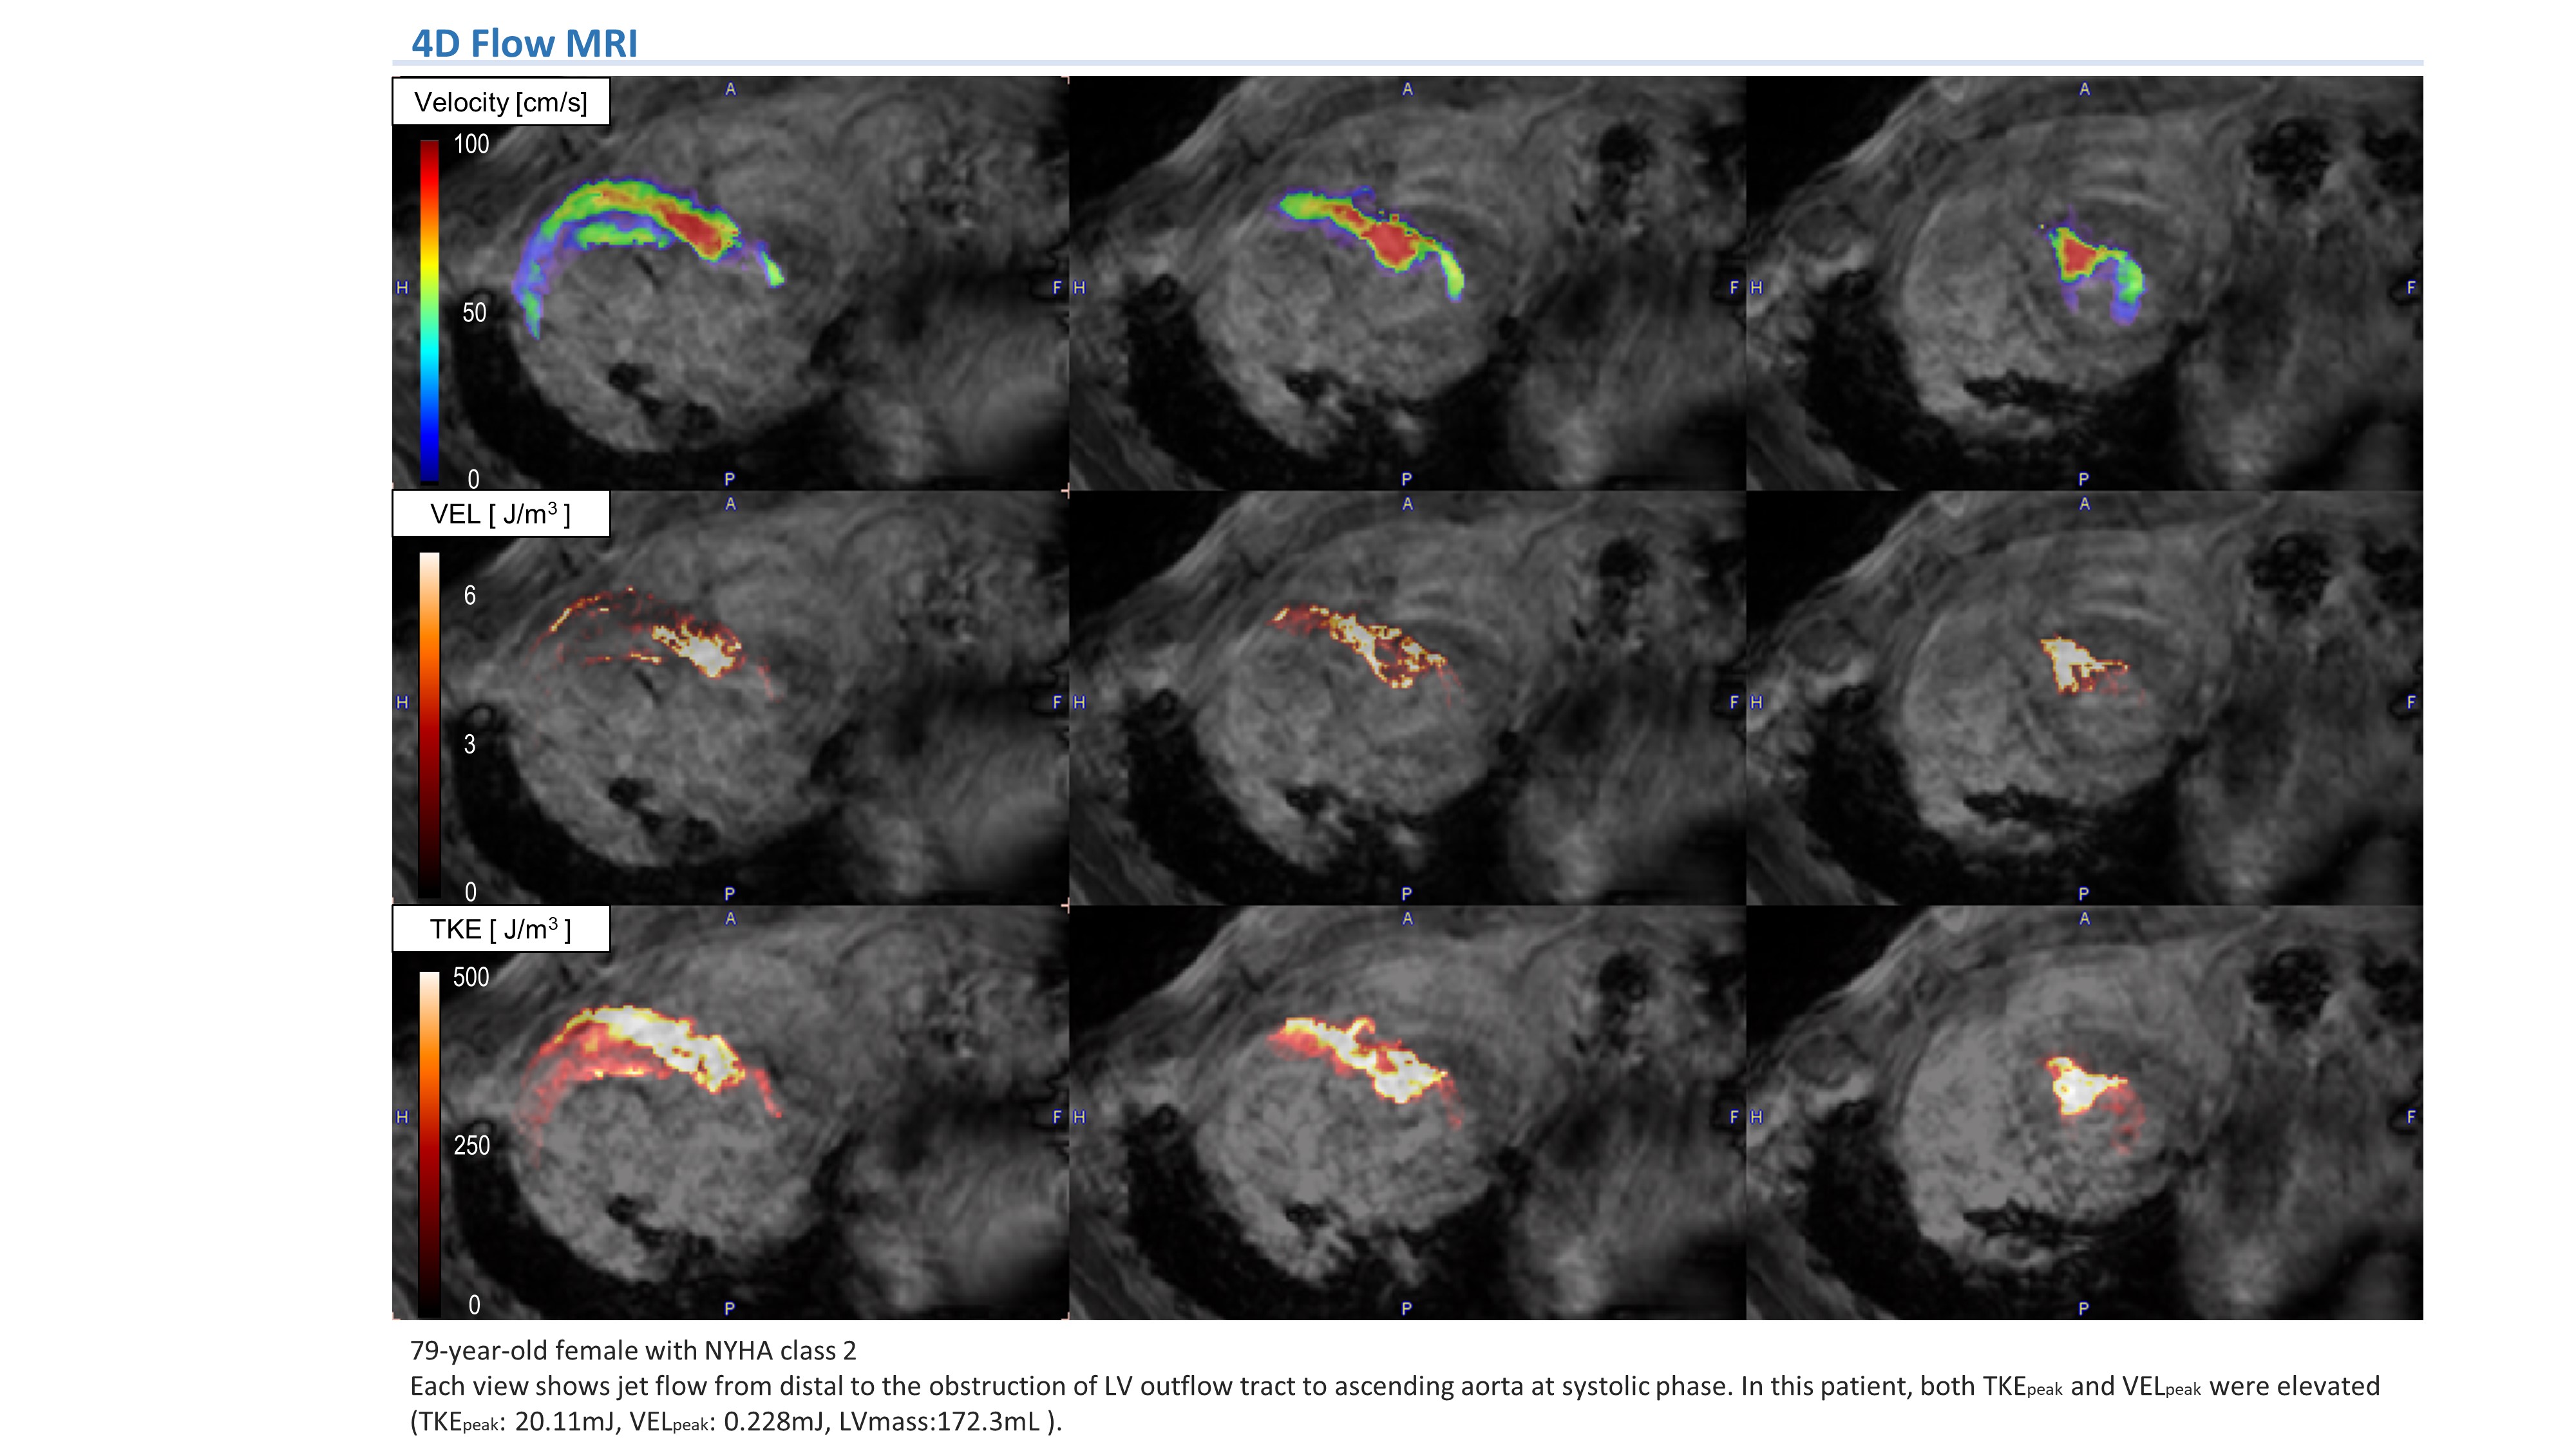
The patients’ characteristics are shown in figure 2. Every energy loss parameter was significantly higher in the HOCM group than HNCM group. There was a tendency of more significant difference in nTKE than in nVEL. Although there was no significant difference among patients with any NYHA classification, each parameter tended to be higher in patients with NYHA≧2 than in patients with NYHA 1(figure 2). The Joule value of nTKEpeak and nVELpeak had a moderate correlation to nLVmass (r=0.469 and 0.370, p<0.001 and 0.037, respectively). Interestingly, a strong correlation was observed between nLVmass and nTKEpeak in NYHA 1 group (r=0.879, p<0.001)(figures 3 and 4), which was not observed in NYHA≧2 group (r=0.200, p=0.384) (Table 3).The representative case is shown in figure 5.
Discussion
The current study revealed that the elevation of TKE or VEL correlated to functional characteristics, the presence of LVOT obstruction, and morphological characteristics, the left ventricular hypertrophy. This correlation was more obvious in TKEpeak value than in the other TKE values or VEL values. Generally, TKE value was much higher than VEL (e.g. The average of TKE was 11.50 mJ, while the average of VELpeak was 0.19 mJ). This difference may be derived from two reasons described below. First, TKE makes a relatively bigger contribution to the total energy loss than VEL in patients with moderate to severe stenotic diseases [9]. Second, VEL is inherently underestimated in the voxel resolution of 4D Flow MRI (pixel ~ 2mm) because it is calculated from the inter-voxel velocity profile [10]. While, the value of TKE is maintained even in voxel resolutions of 4D Flow MRI because it is calculated from the intra-voxel velocity profile [11].The strong correlation between nTKEpeak and nLV mass was observed in asymptomatic patients (r=0.879), but not in symptomatic patients (r=0.200). It is generally considered that the increase of cardiac load induces the pathophysiological reaction resulting in an increase of LV mass [12, 13]. The current study may indicate that the clinical symptom of HCM can be caused by the disruption of this reaction.
We consider two factors as limitations of this study. First, we have a small patient population as NYHA 1 were 11 patients. Second, the effect of premedication on hypertrophy was not taken into account.
Conclusion
Each TKE and VEL value was significantly higher in patients with HOCM than HNCM. Generally, TKEpeak had the strongest correlation to each disease condition. The increase of TKE may induce physiological reaction of left ventricular hypertrophy in HCM patients without clinical symptoms.Acknowledgements
No acknowledgement found.References
[1] Barker AJ. Viscous energy loss in the presence of abnormal aortic flow. Magn Reson Med 2014;72:620-628.
[2]Dyverfeldt P. Quantification of intravoxel velocity standard deviation and turbulence intensity by generalizing phase-contrast MRI. Magn Reson Med 2006;56:850-858.
[3]Maron MS. Effect of left ventricular outflow tract obstruction on clinical outcome in hypertrophic cardiomyopathy. N Engl J Med 2003;348:295-303.
[4] Levine RA. Pressure recovery distal to a stenosis: potential cause of gradient "overestimation" by Doppler echocardiography. J Am Coll Cardiol 1989;13:706-715.
[5] van Ooij P. 4D flow MRI and T1 -Mapping: Assessment of altered cardiac hemodynamics and extracellular volume fraction in hypertrophic cardiomyopathy. J Magn Reson Imaging 2016;43:107-114.
[6] Binter C. Turbulent Kinetic Energy Assessed by Multipoint 4-Dimensional Flow Magnetic Resonance Imaging Provides Additional Information Relative to Echocardiography for the Determination of Aortic Stenosis Severity. Circ Cardiovasc Imaging 2017;10.
[7] Dyverfeldt P. Magnetic resonance measurement of turbulent kinetic energy for the estimation of irreversible pressure loss in aortic stenosis. JACC Cardiovasc Imaging 2013;6:64-71.
[8] Knobloch V. Mapping mean and fluctuating velocities by Bayesian multipoint MR velocity encoding-validation against 3D particle tracking velocimetry.Magn Reson Med 2014;71:1405-1415.
[9] Ha H. Turbulent Kinetic Energy Measurement Using Phase Contrast MRI for Estimating the Post-Stenotic Pressure Drop: In Vitro Validation and Clinical Application. PLoS One 2016;11:e0151540.
[10] Binter C. On the accuracy of viscous and turbulent loss quantification in stenotic aortic flow using phase-contrast MRI. Magn Reson Med 2016;76:191-196.
[11] Ha H. Estimation of turbulent kinetic energy using 4D phase-contrast MRI: Effect of scan parameters and target vessel size. Magn Reson Imaging 2016;34:715-723.
[12] Olivotto I. Maximum left ventricular thickness and risk of sudden death in patients with hypertrophic cardiomyopathy. J Am Coll Cardiol 2003;41:315-321.
[13] Iwata K. Four-dimensional flow magnetic resonance imaging reveals the reduction in turbulent kinetic energy after percutaneous transluminal septal myocardial ablation in hypertrophic obstructive cardiomyopathy. European Heart Journal 2019.
Figures
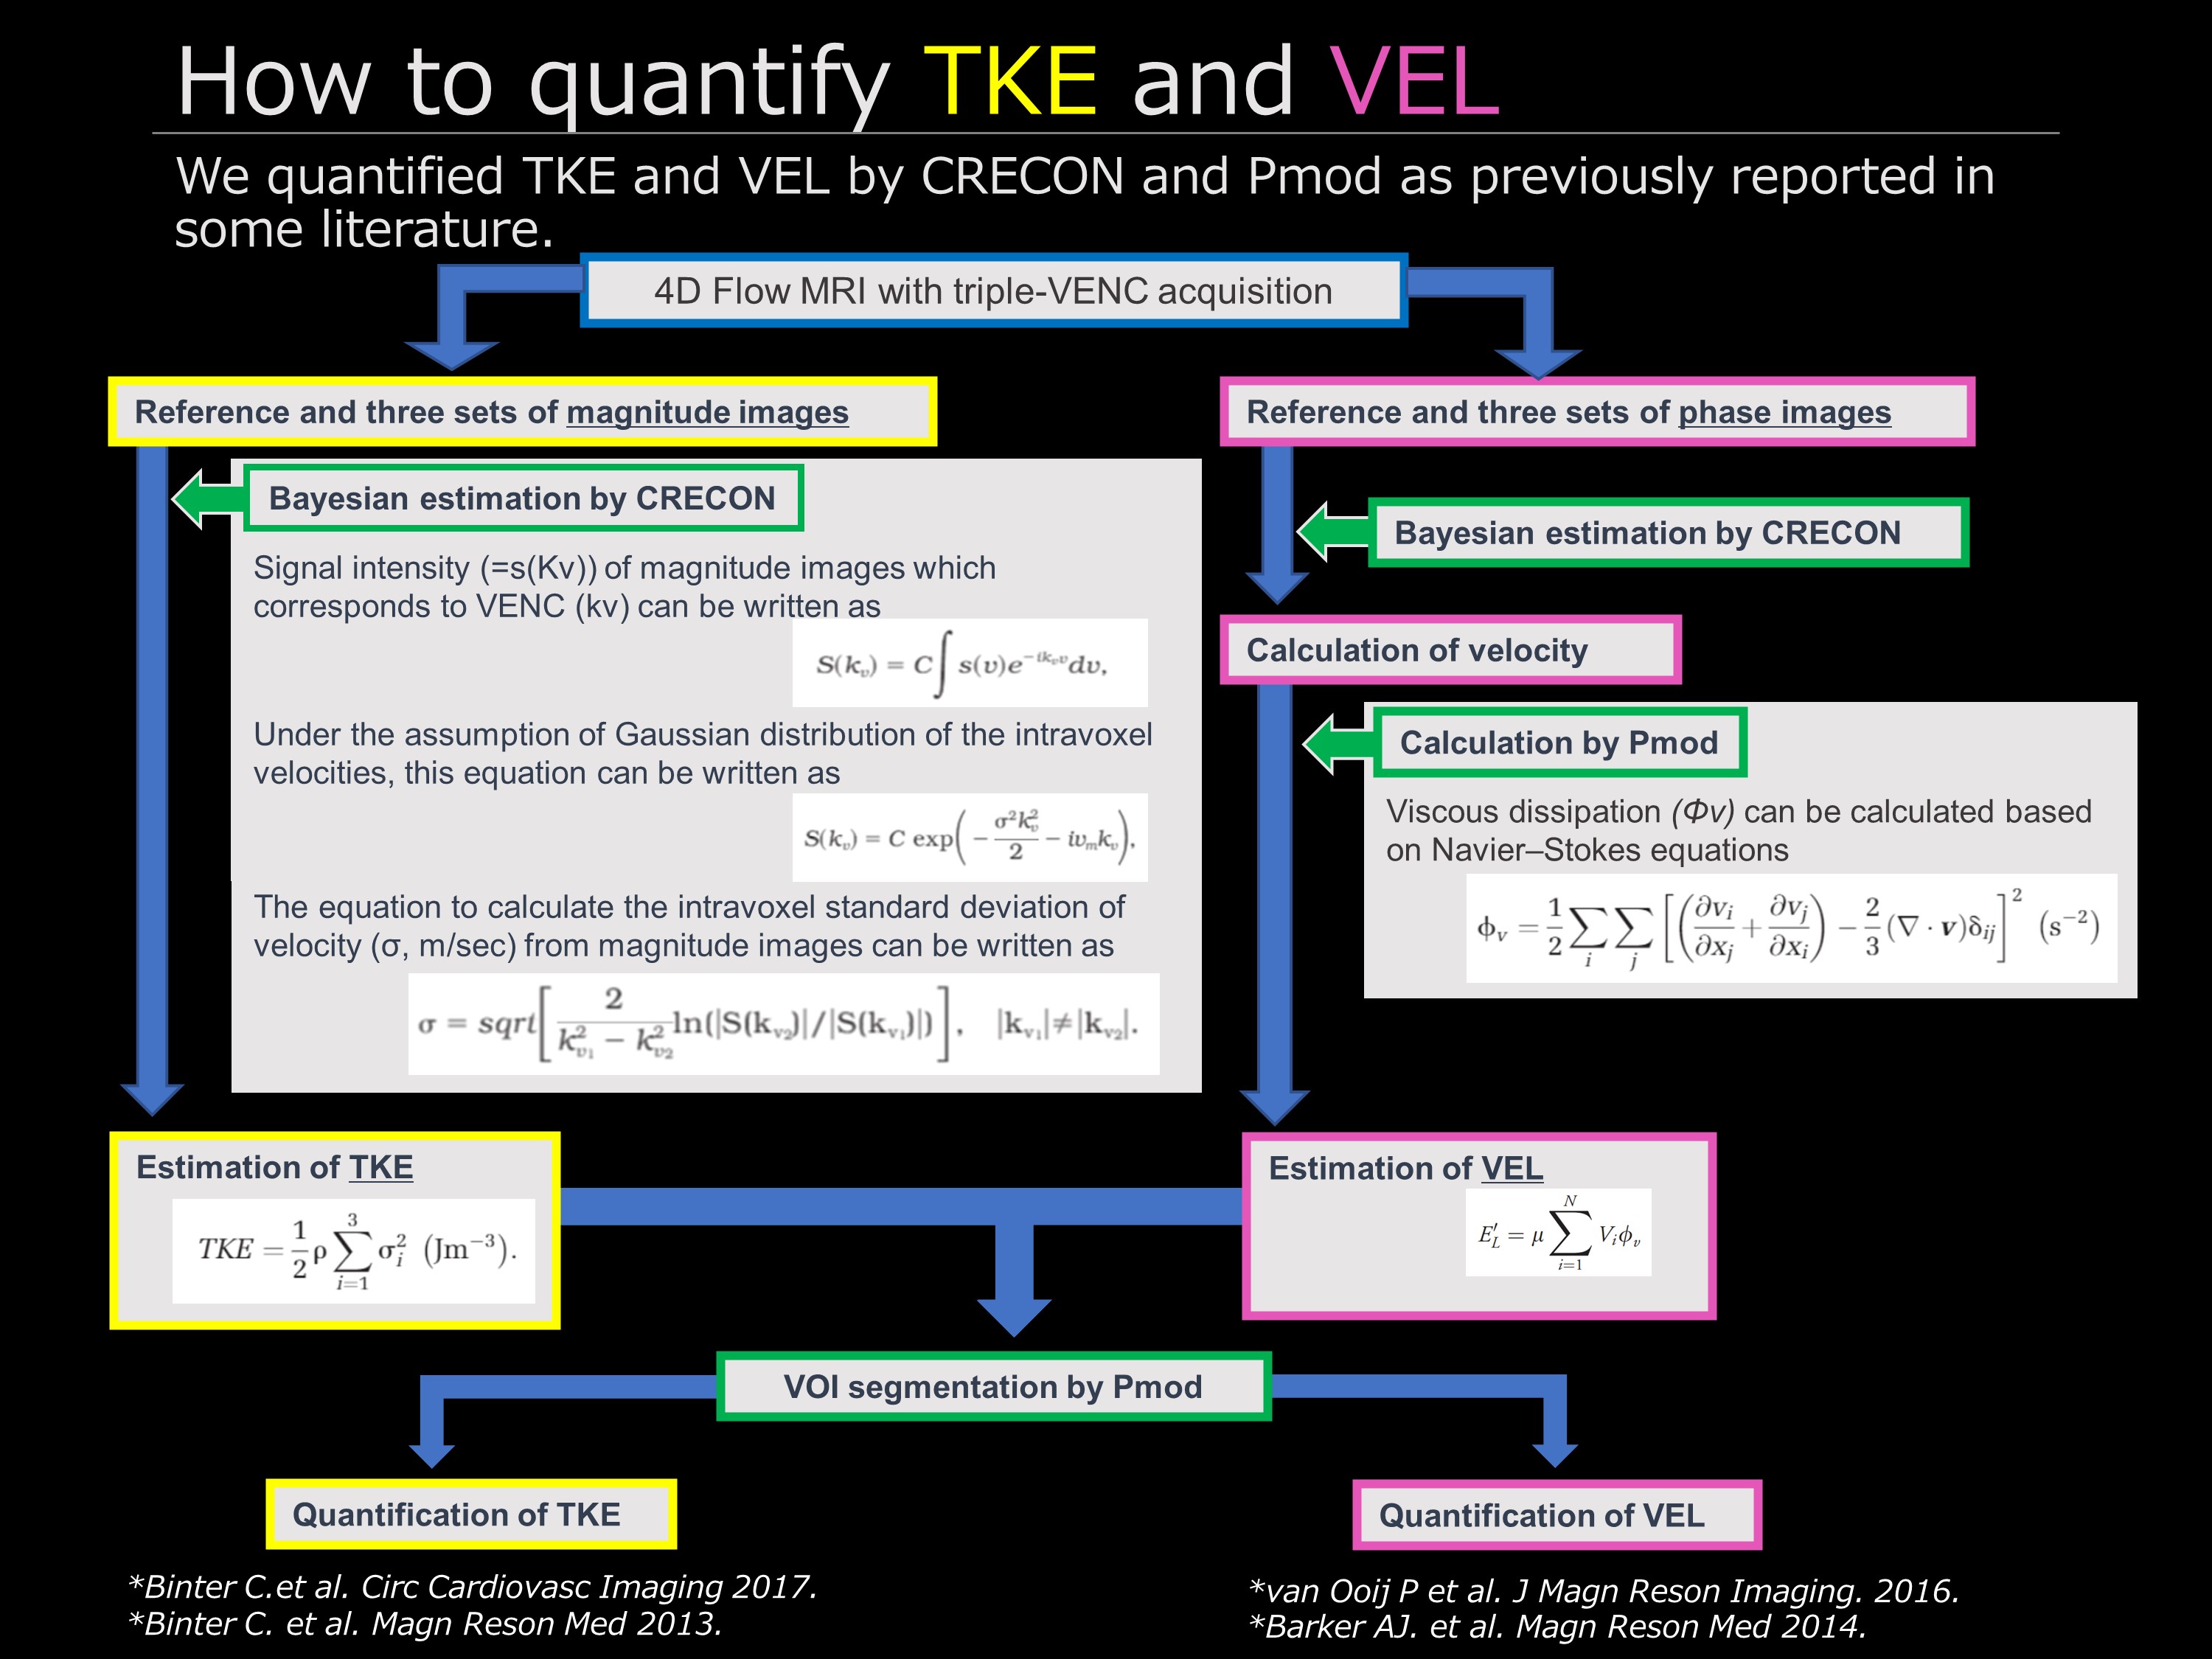
Figure 1 Post-processing flowchart