3825
The Value of 4D Flow MRI Combined with Precontrast T1 mapping Model in Identifying High-risk Varices of Cirrhosis Patients1Department of radiology, The Second Affiliated Hospital of Guangzhou University of Chinese Medicine, Guangzhou, China, 2MR Scientific Marketing, Siemens Healthineers Ltd, Shanghai, China
Synopsis
Keywords: Flow, Velocity & Flow
Noninvasive identification of high-risk varices (HRV) in cirrhosis patients is of significantly value because it could help avoid some unnecessary upper gastrointestinal endoscopy and repeat in a short time to evaluate the efficiency of non-selective beta blockers therapy. This study aims to evaluate the value of 4D flow MRI combined with precontrast T1 in identifying HRV. Our results indicated that the model including SMV forward volume, SMV maximum blood flow, precontrast liver T1 mapping, and precontrast spleen T1 mapping could effectively identify HRV of cirrhosis patients.Purpose:
Gastroesophageal varices(GOV) is a common complication in cirrhosis patients with portal hypertension (PH). Accurately identification of high-risk varices (HRV) is essential for clinical decision-making because it is prone to repture and cause significant upper gastrointestinal bleeding with mortality rates up to 20%1. Upper gastrointestinal endoscopy is currently recommended to perform GOV screening for cirrhosis patients every one to three years2. However, it has some inherent shortcomings, such as cost, invasiveness, discomfort and the logistics of a screening agenda, which limit its extensively application in clinical. According to a recent survey, GOV screening was not applied in around half of concerned patients3. Therefore, it is imperative to explore non-invasive diagnostic methods as a surrogate for GOV screening. PH consists of static components and dynamic components. As the main static component of PH, fibrosis distorts liver parenchymal architecture and remodels hepatic vasculature, increasing intrahepatic vascular resistance (approximately 70-80%). However, as the dynamic (vascular) components (approximately 20-30%)4, hyperdynamic circulation and increased visceral blood flow become the key drivers in the advanced stage of PH, which lead to increased portal pressure and the opening of collateral circulation including GOV. 4D Flow is a new magnetic resonance technology for visualization of hemodynamics, which encoded by three spatial directions with high temporal resolution. It could obtain 3D blood flow information and nearly ten quantitative analysis parameters, which has great advantages in vascular diseases5. We hypothesis that T1 mapping could reflect the static components of PH and 4D flow MRI could reflect the dynamic components of PH. So, the purpose of this study is to establish a model combining 4D flow MRI and T1 mapping to identify HRV.Methods:
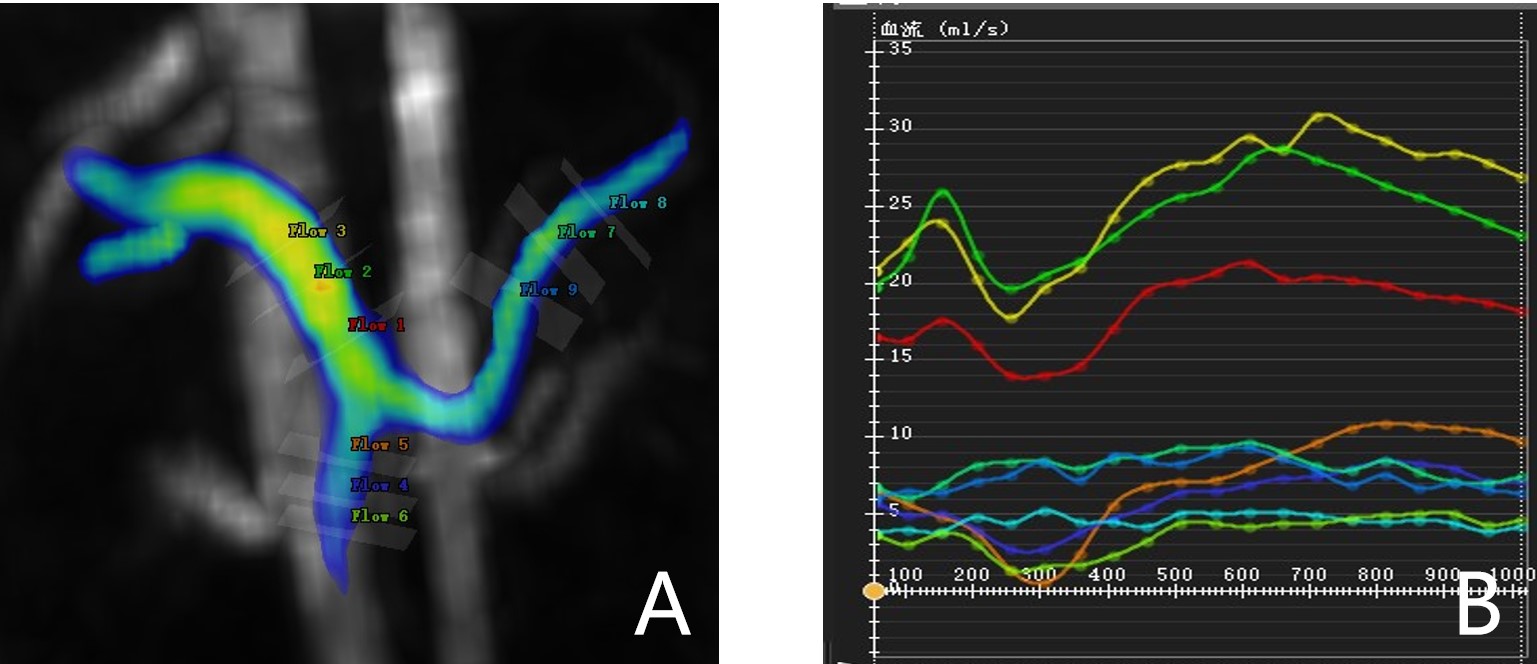
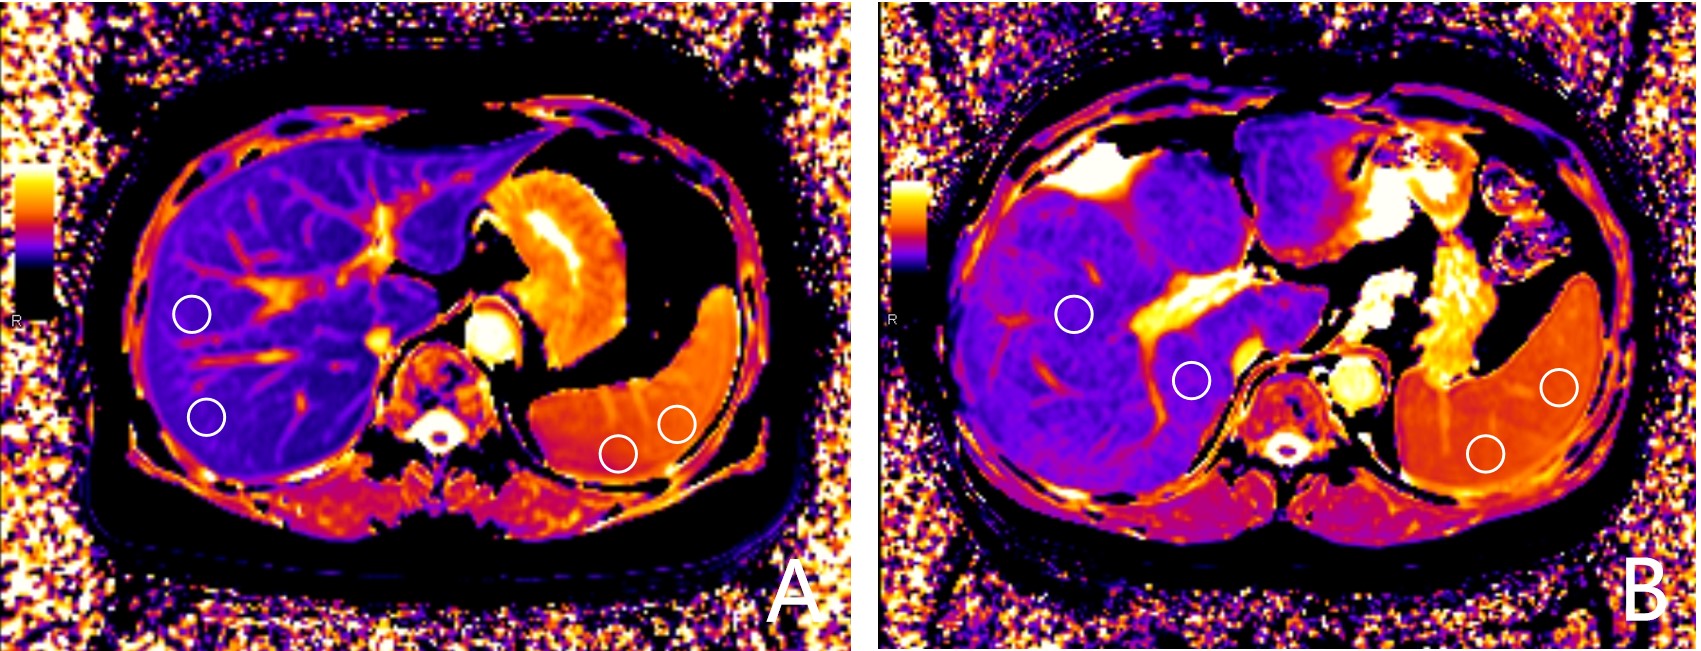
A totel of 25 cirrhosis patients(median age: 53 years old; interquartile range:31-71; 19 men) were enrolled in this study, including 13 patients with HRV and 12 patients with non-HRV. All patients were underwent 4D flow MRI and T1 mapping on a 3T MR scanner (MAGNETOM Prisma, Siemens Healthineers, Erlangen, Germany) with a 18-channel body coil and a 32-channel spine coil. The acquisition parameters of 4D flow were as following: voxel size=3.1×3.1×2.5 mm3; TE/TR= 4.22/50.64 ms; flip angle=7 deg; velocity encoding sensitivity=30 cm/s, free-breathing scanning. All 4D flow images were reconstructed in CVI 4.2 software(Circle,Calgary,Ontario,Canada). A radiologist who was blinded to endoscopy findings reconstructed the patient's portal vein(PV), superior mesenteric vein(SMV), and splenic vein(SV) and calculated the quantitative parameters including corresponding vessel forward volume, peak velocity, maximum pressure gradient, and maximum blood flow(Figure 1) . MOLLI T1 mapping sequence were obtained twice, once before and once 10 min after administration of gadovist (BayerAG,Germany). T1 mapping parameters were as follows: TR/TE=279.12/1.12 ms; flip angle=35 deg; acq matrix=144x256; slice thicknes=12 mm. To measure the liver and spleen T1 mapping, six 10-mm diameter circular regions of interest (ROIs) were placed in the right liver lobe or spleen parenchymal on the central three continuous sections (two ROIs per section, Figure 2). The mean of the six ROI measurements was the patient's liver and spleen T1 mapping. Cirrhosis patients underwent upper gastrointestinal endoscopy within one month before and after MR examination. HRV was defined as patients with medium / large EV and patients with small EV with red signs or decompensated cirrhosis6. 4D Flow MRI and T1 mapping parameters were compared by mann-whitney U-test between HRV and non-HRV groups. Spearman correlation analysis was performed on 4D flow MRI parameters, T1 mapping values of liver and spleen and HRV . Receiver operating characteristic curve (ROC) analysis was performed to determine the performance of 4D flow MRI , liver and spleen T1 mapping and the combine model to early diagnose high-risk varices .Results:
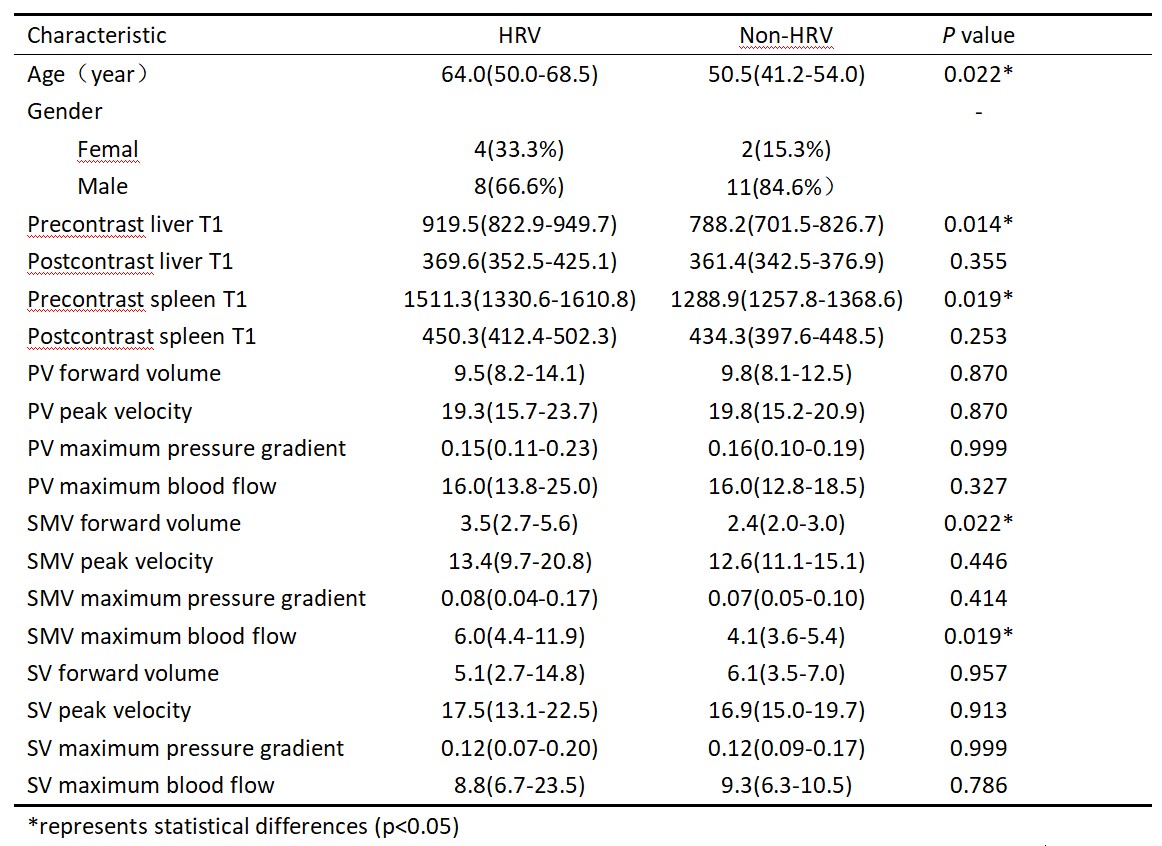
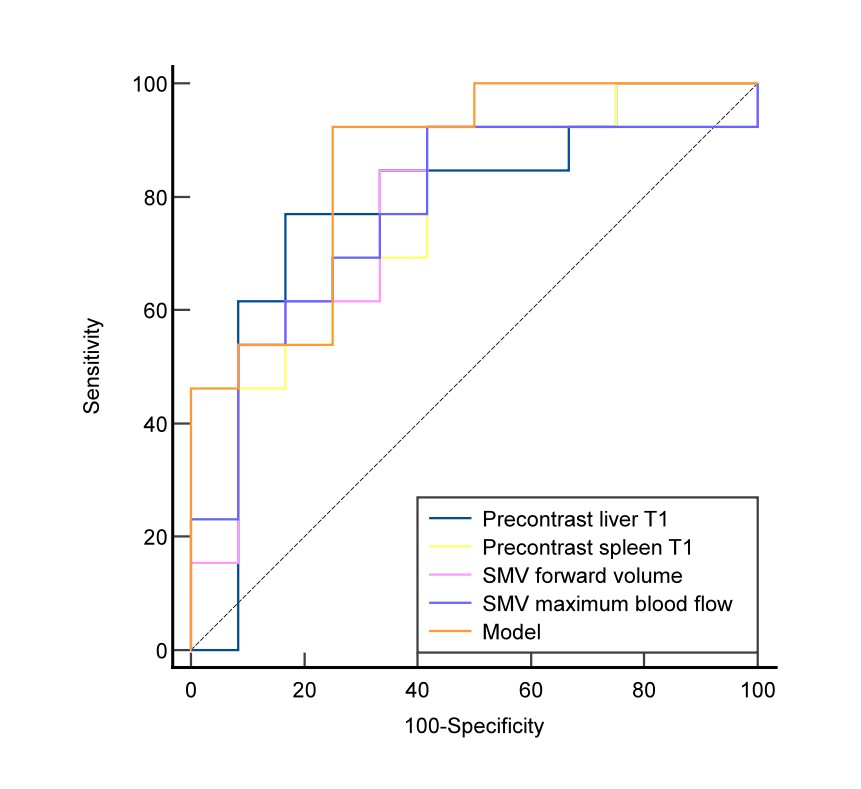
Mann-Whitney U-test indicated that age, precontrast liver mapping, precontrast spleen mapping, SMV forward volume and SMV maximum blood flow had significant difference between these two groups(Table 1). Correlation analysis showed that precontrast liver mapping (r=0.500,P=0.011), precontrast spleen mapping (r=0.477,P=0.016), SMV forward volume(r=0.478,P=0.016), SMV maximum blood flow(r=0.466,P=0.019) were all moderatly positive correlated with high-risk varices. Combine the above parameters to build a model. The AUC of model, precontrast liver mapping, precontrast spleen mapping, SMV forward volume, SMV maximum blood flow’s ROCs in identifying HRV were 0.859, 0.788, 0.776 ,0.769 and 0.776, respectively(Figure 3) .Conclusion:
The model including 4D Flow MRI parameters of SMV forward volume, SMV maximum blood flow, and precontrast liver T1 mapping, precontrast spleen T1 mapping could effectively identify high-risk varices of cirrhosis patients, which may provide a helpful and reliable evidence for clinical diagnosis and treatment.Acknowledgements
We sincerely thank to all the participants in this study.References
1. Pfisterer N, Unger LW, Reiberger T. Clinical algorithms for the prevention of variceal bleeding and rebleeding in patients with liver cirrhosis. World J Hepatol. 2021;13(7):731-7462.
2. de Franchis R. Revising consensus in portal hypertension: report of the Baveno V consensus workshop on methodology of diagnosis and therapy in portal hypertension. J Hepatol. 2010;53(4):762-83.
3. Buchanan PM, Kramer JR, El-Serag HB et al. The quality of care provided to patients with varices in the department of Veterans Affairs. Am J Gastroenterol. 2014;109(7):934-404.
4.Königshofer P, Hofer BS, Brusilovskaya K et al. Distinct structural and dynamic components of portal hypertension in different animal models and human liver disease etiologies. Hepatology. 2022;75(3):610-6225.
5. Hyodo R, Takehara Y, Naganawa S. 4D Flow MRI in the portal venous system: imaging and analysis methods, and clinical applications. Radiol Med. 2022;127(11):1181-11986.
6.Kim BK, Han KH, Park JY et al. A liver stiffness measurement-based, noninvasive prediction model for high-risk esophageal varices in B-viral liver cirrhosis. Am J Gastroenterol. 2010;105(6):1382-90
Figures